Download to read offline
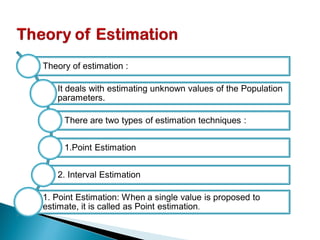
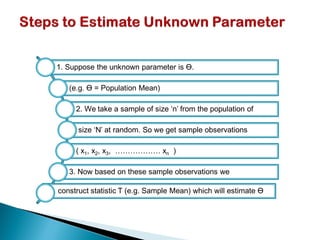
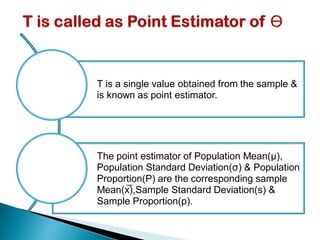
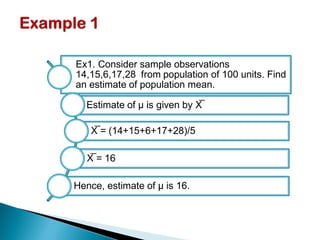
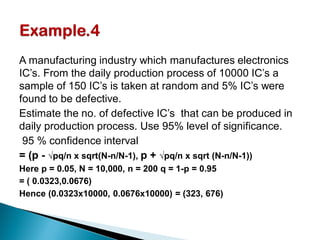
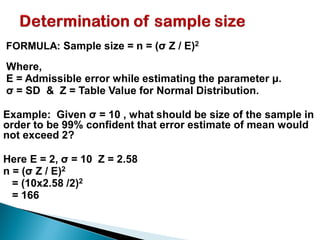

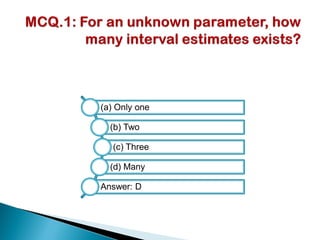
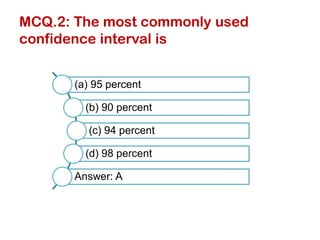


The document provides an overview of estimation techniques in statistics, focusing on point and interval estimation. Point estimation gives a single value to estimate a population parameter based on a sample, while interval estimation uses a range to indicate where the parameter may lie with a certain confidence level. It also includes examples and formulae for calculating sample size and confidence intervals.