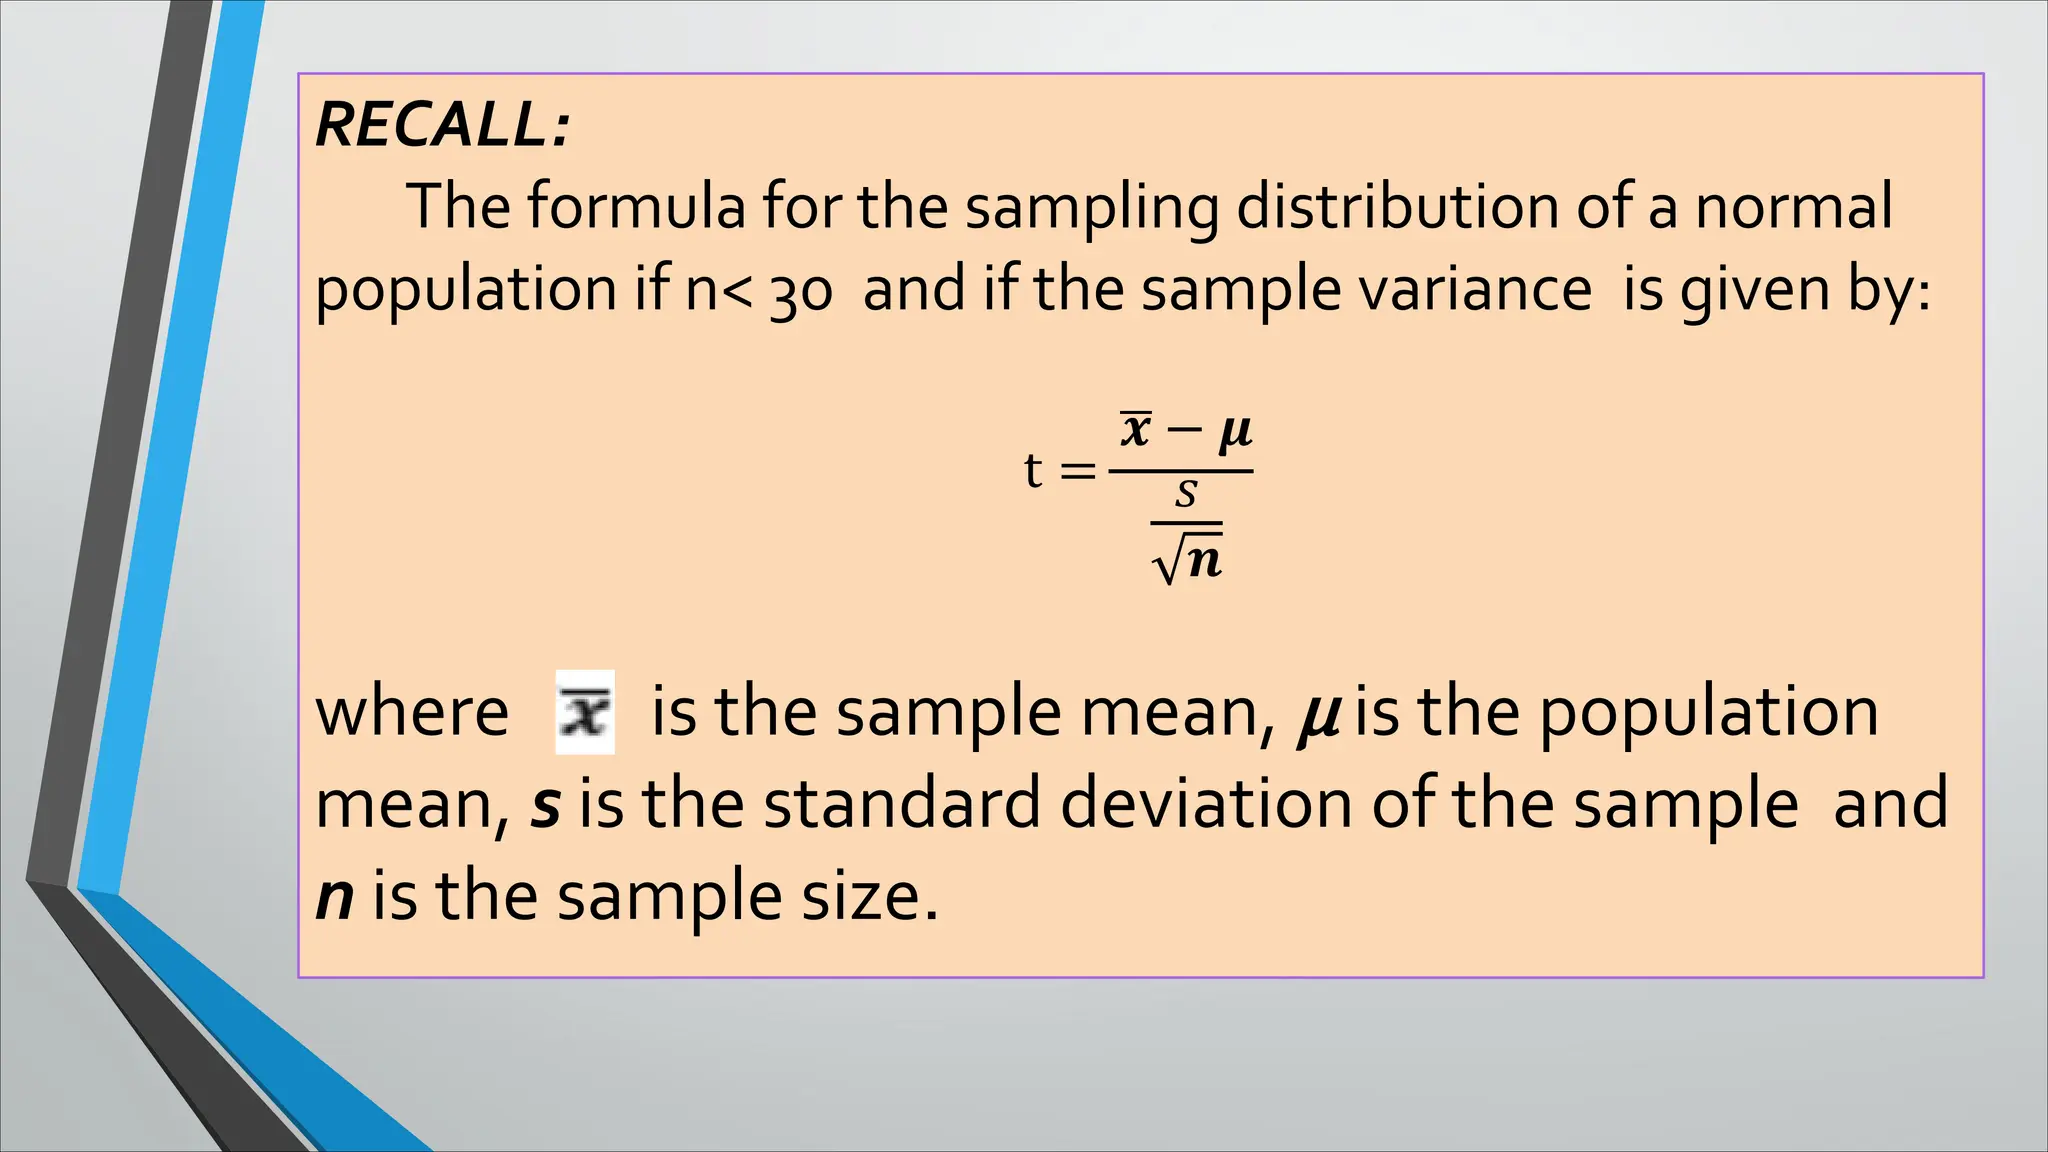
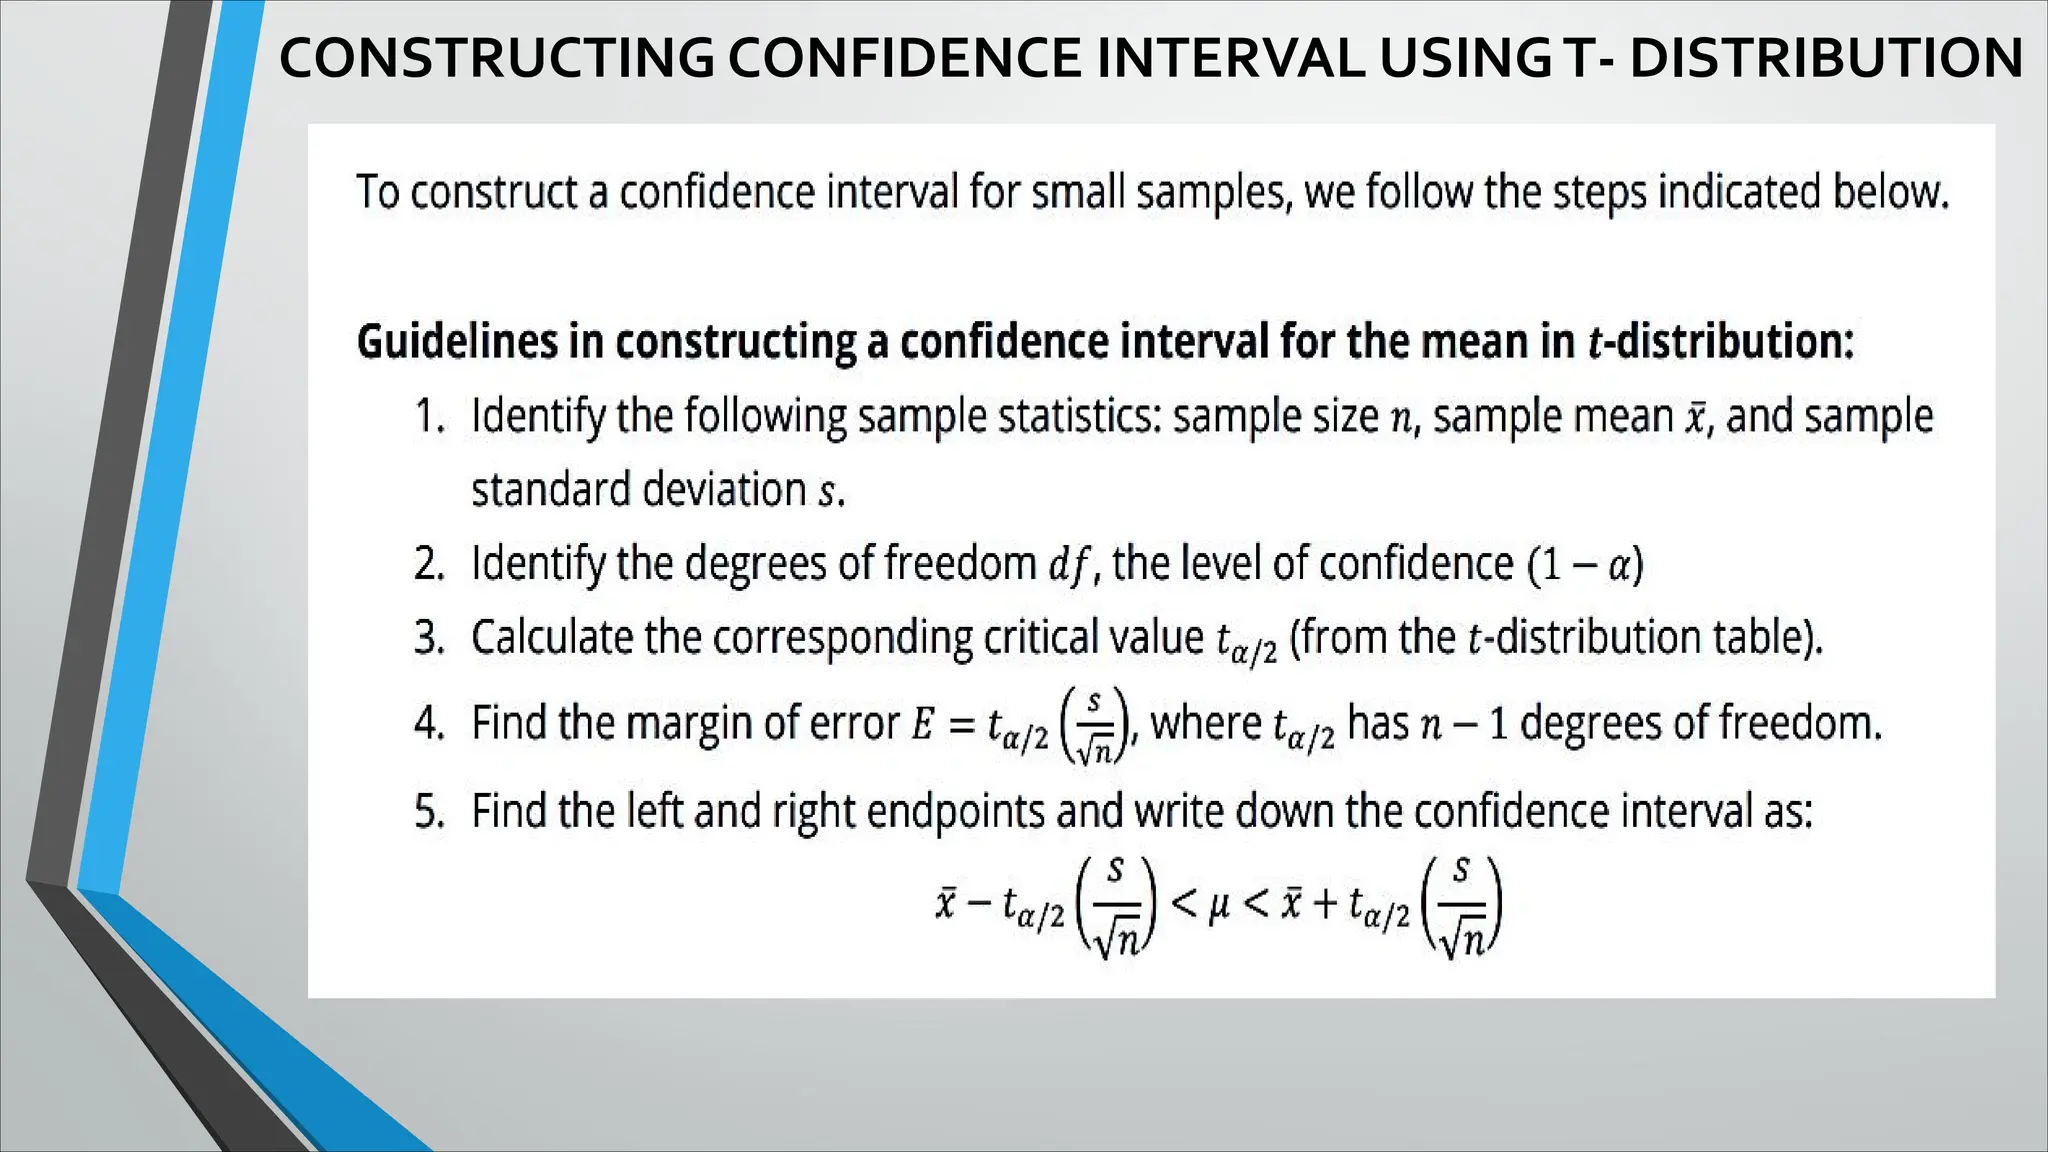
RECALL:
The formula forthe sampling distribution of a normal
population if n< 30 and if the sample variance is given by:
t =
� − �
�
�
where is the sample mean, μ is the population
mean, s is the standard deviation of the sample and
n is the sample size.
4.
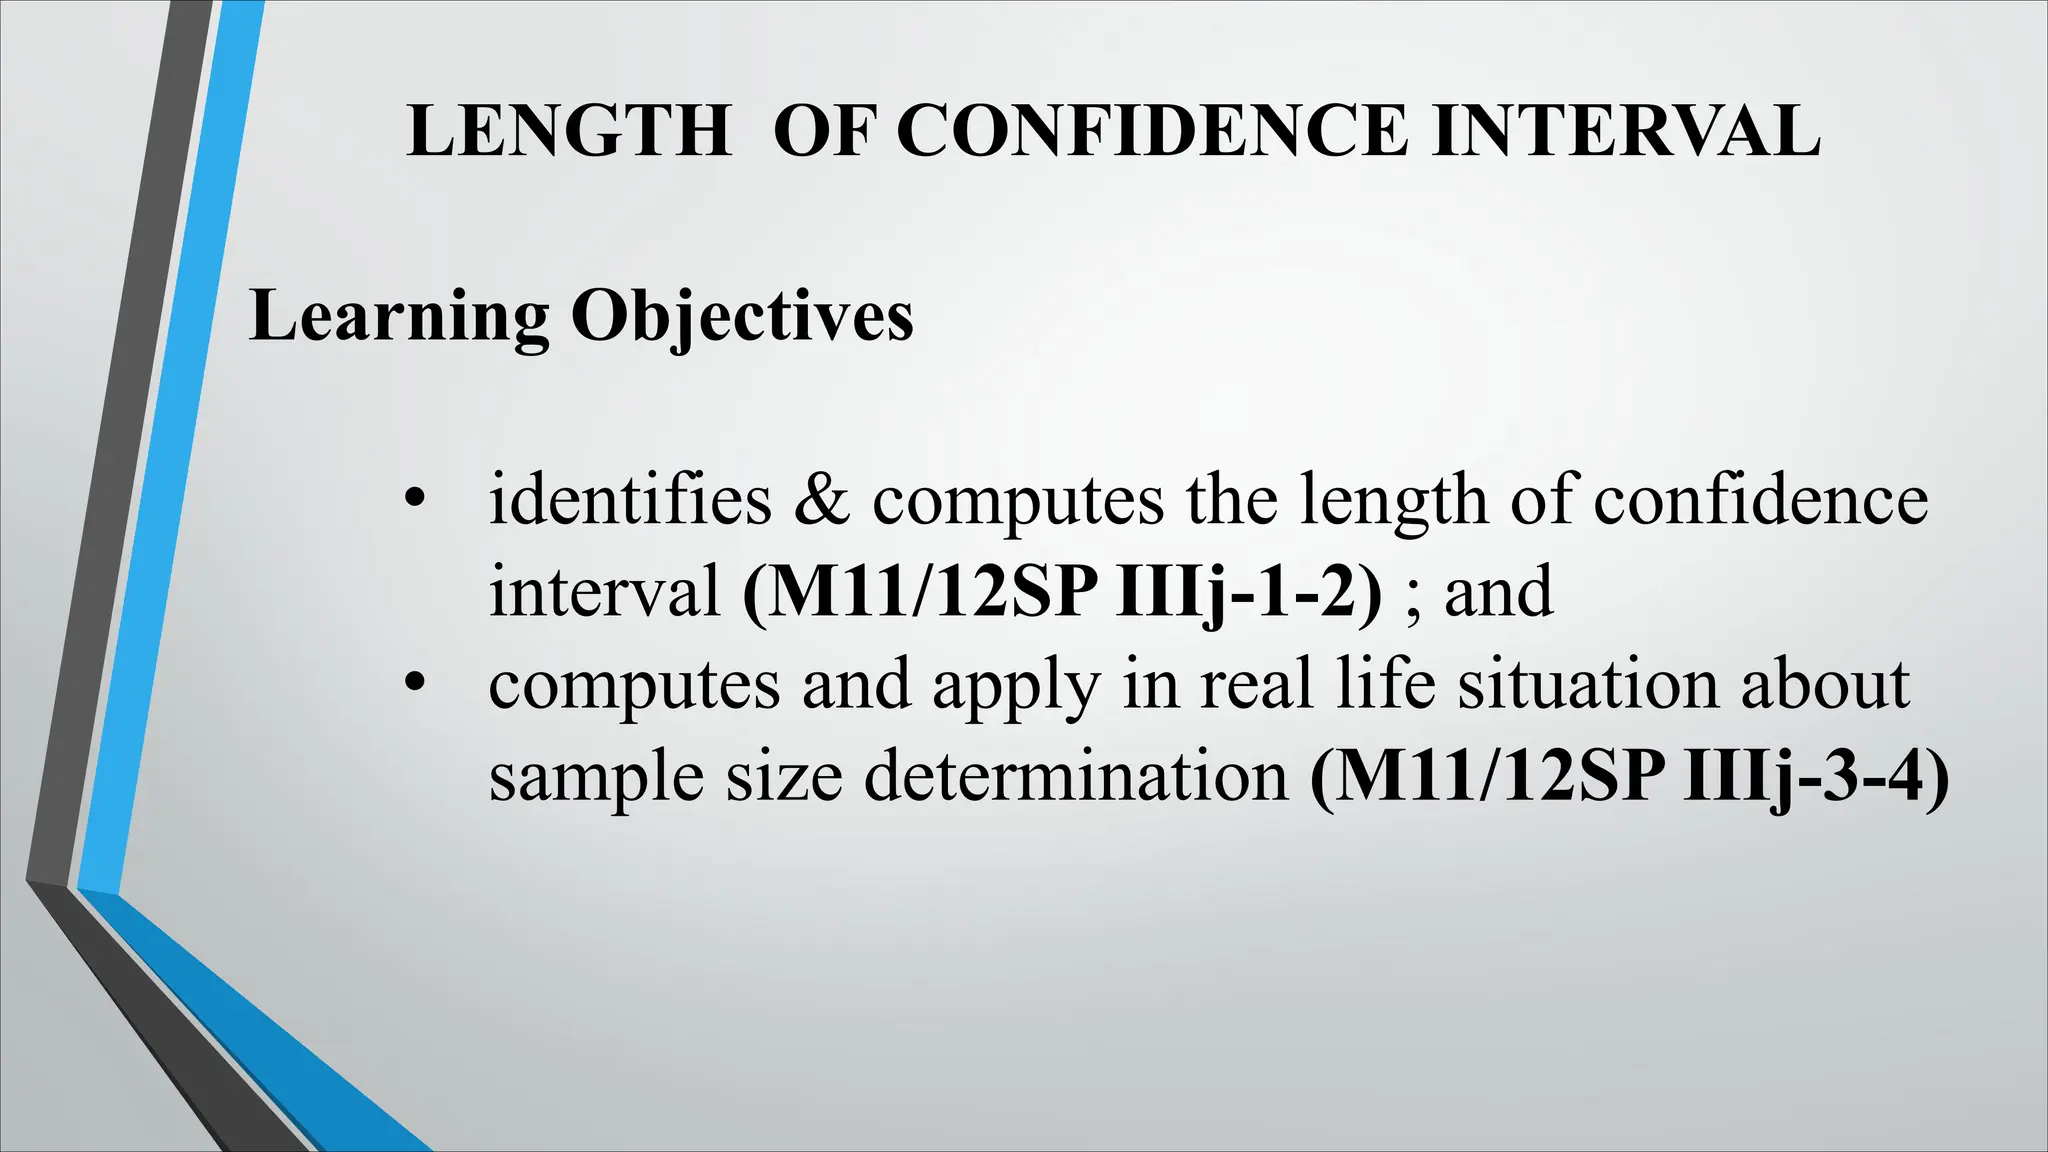
LENGTH OF CONFIDENCEINTERVAL
Learning Objectives
• identifies & computes the length of confidence
interval (M11/12SP IIIj-1-2) ; and
• computes and apply in real life situation about
sample size determination (M11/12SP IIIj-3-4)
5.
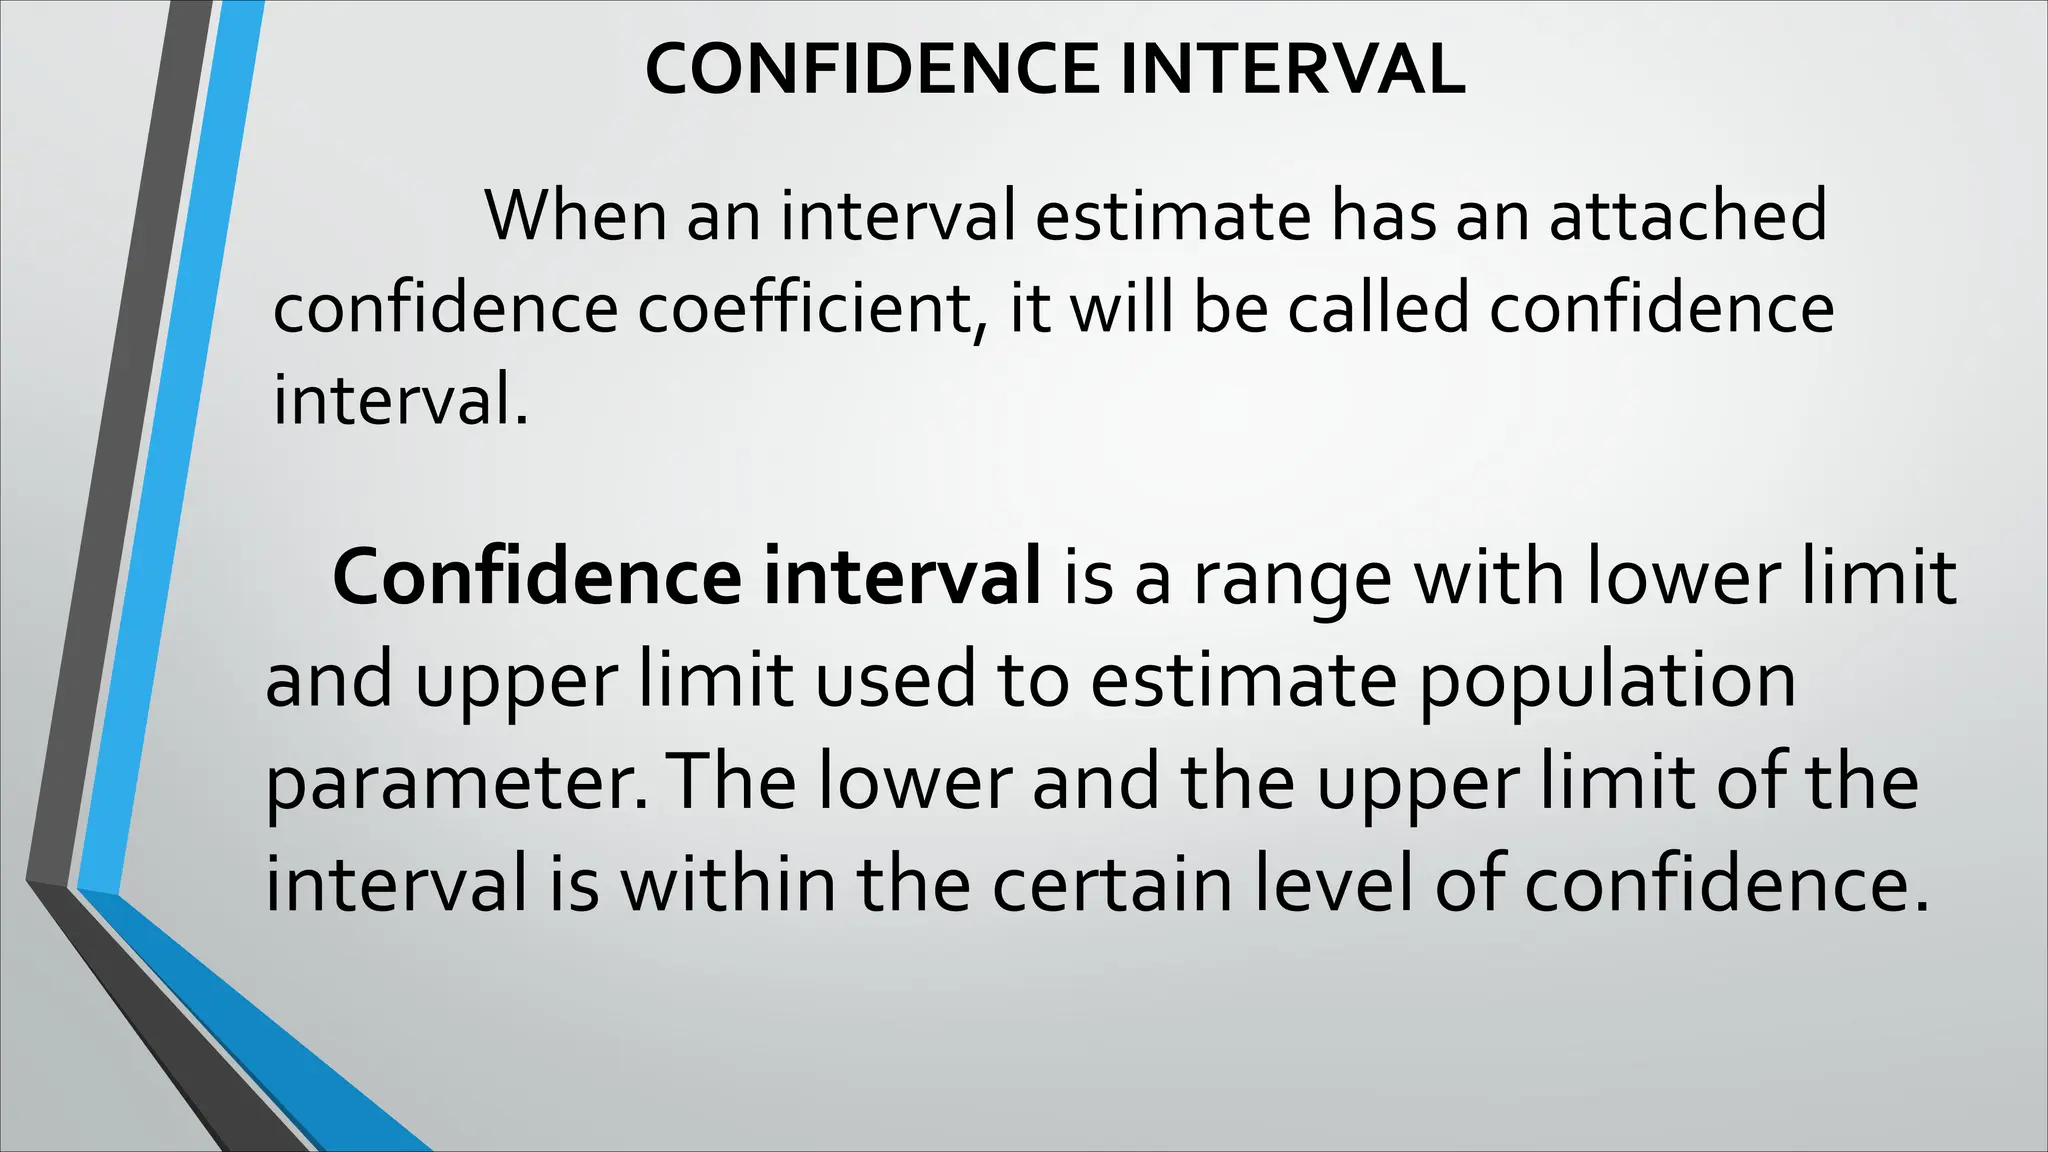
CONFIDENCE INTERVAL
When aninterval estimate has an attached
confidence coefficient, it will be called confidence
interval.
Confidence interval is a range with lower limit
and upper limit used to estimate population
parameter.The lower and the upper limit of the
interval is within the certain level of confidence.
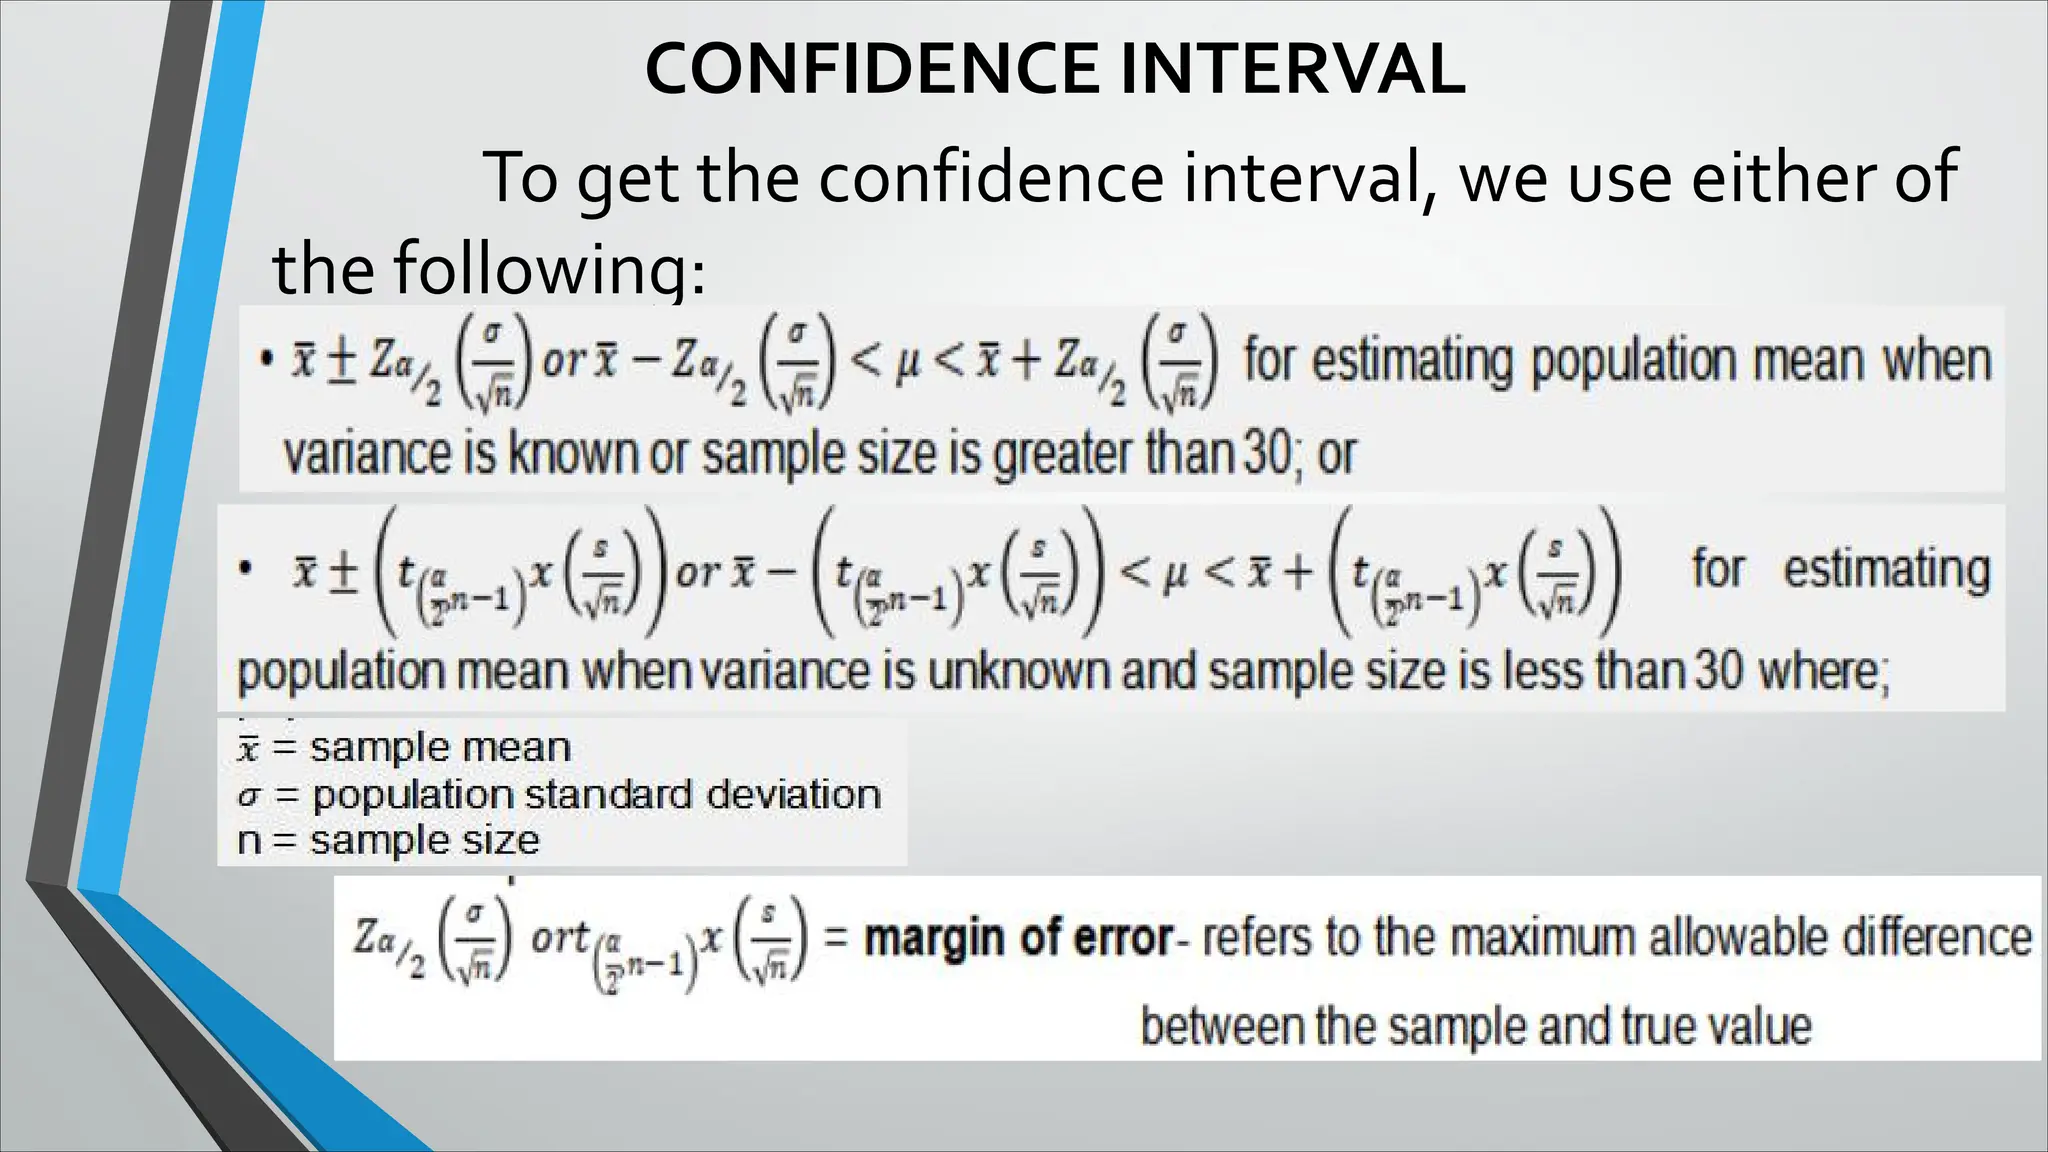
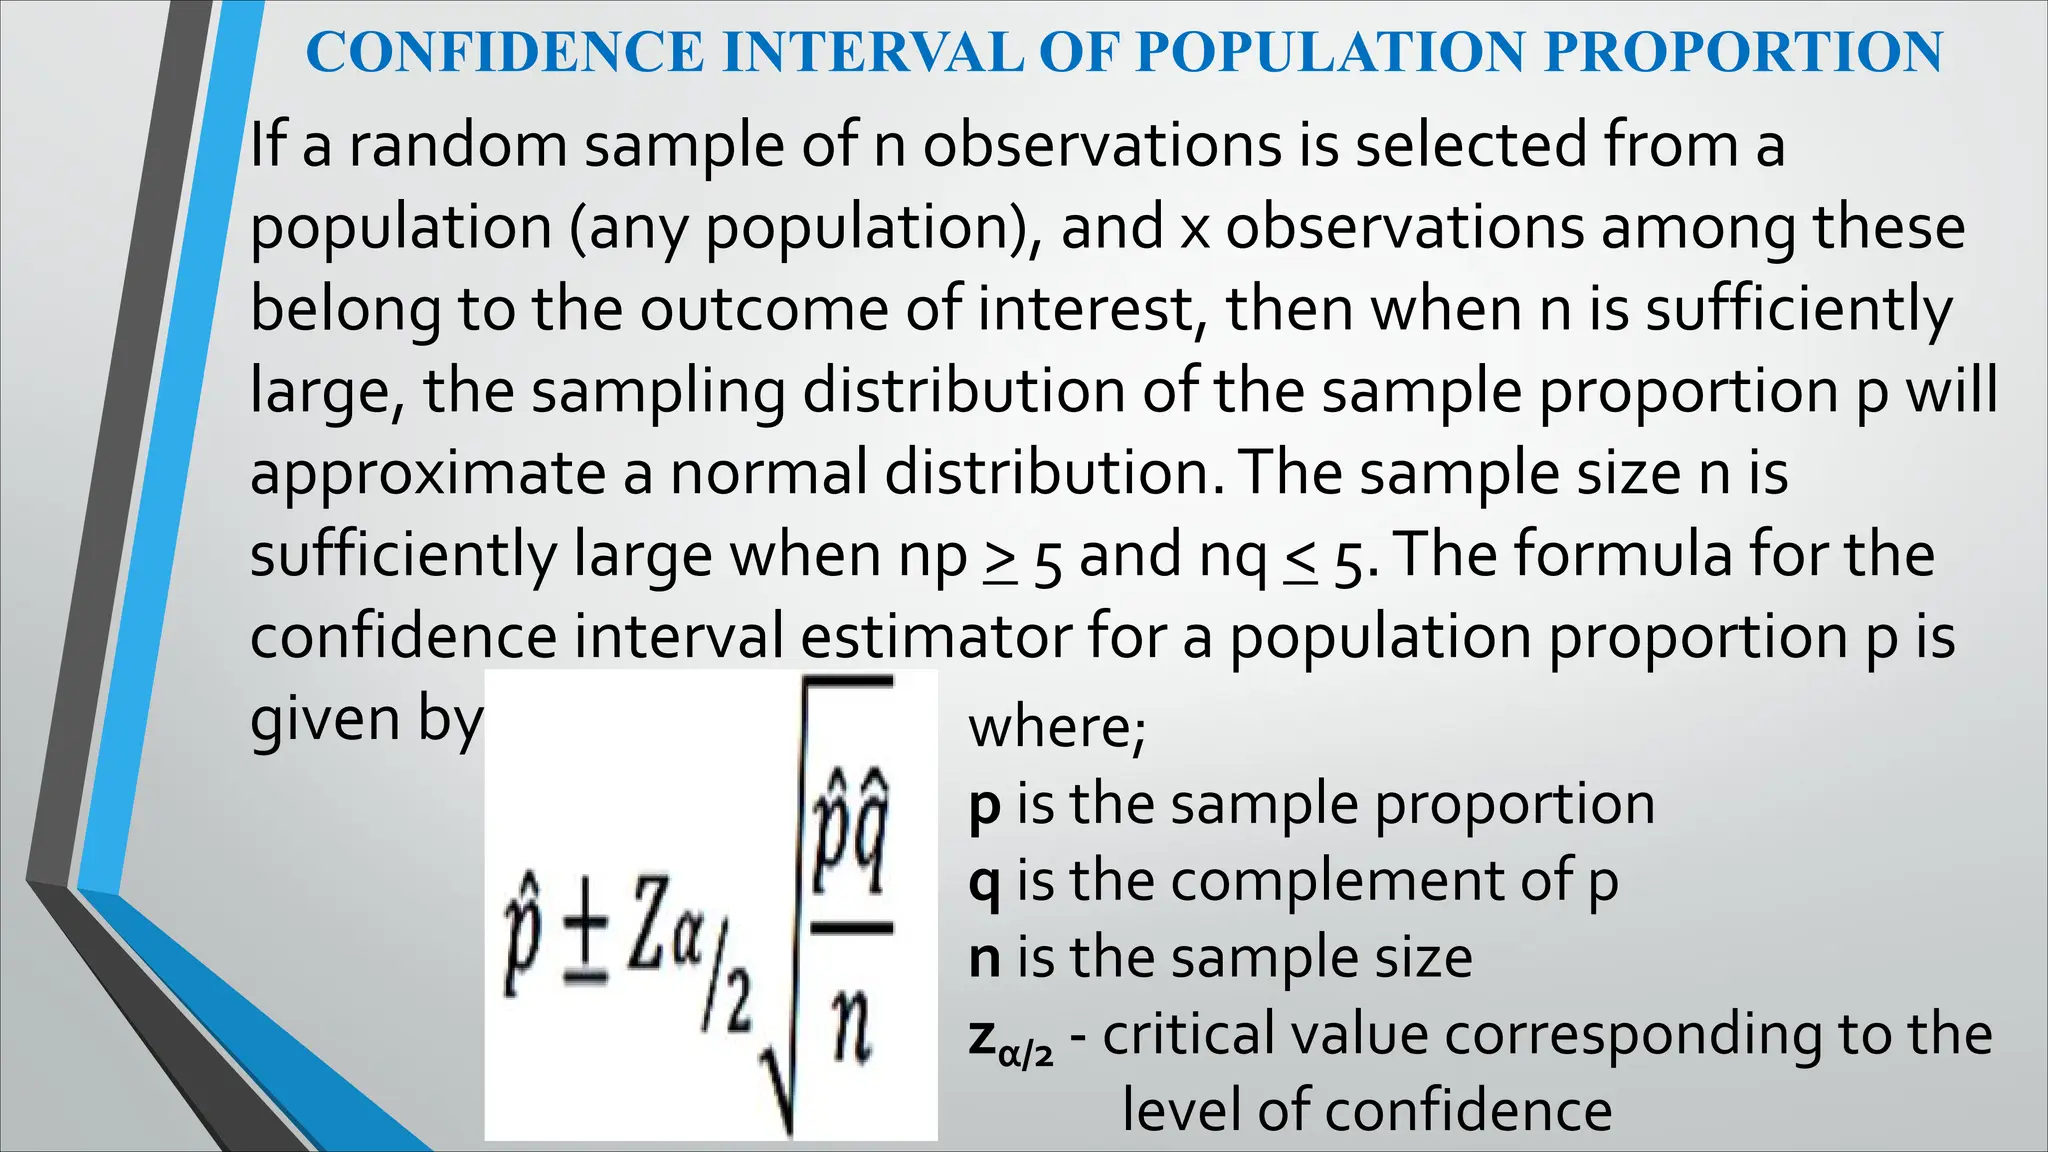
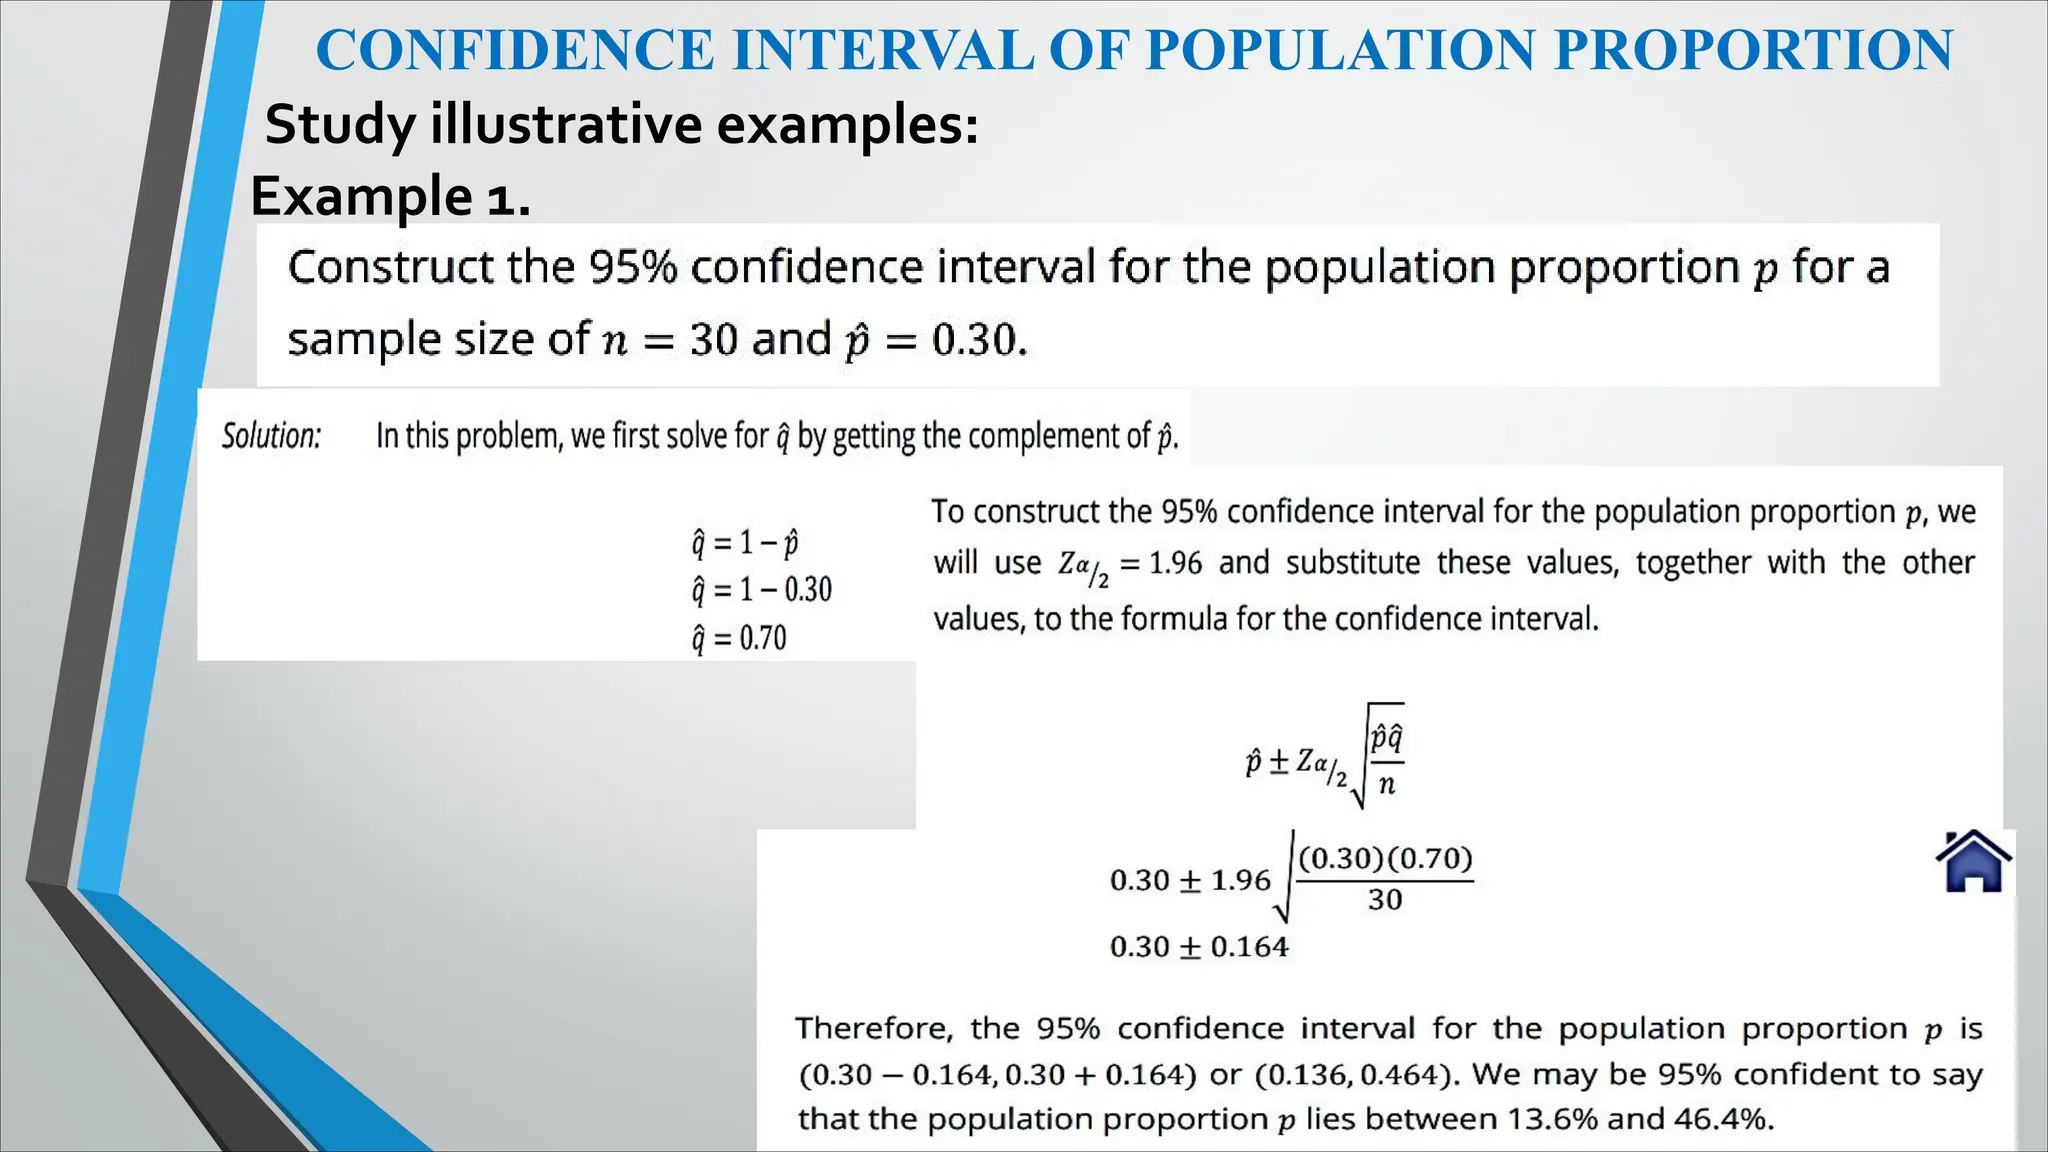
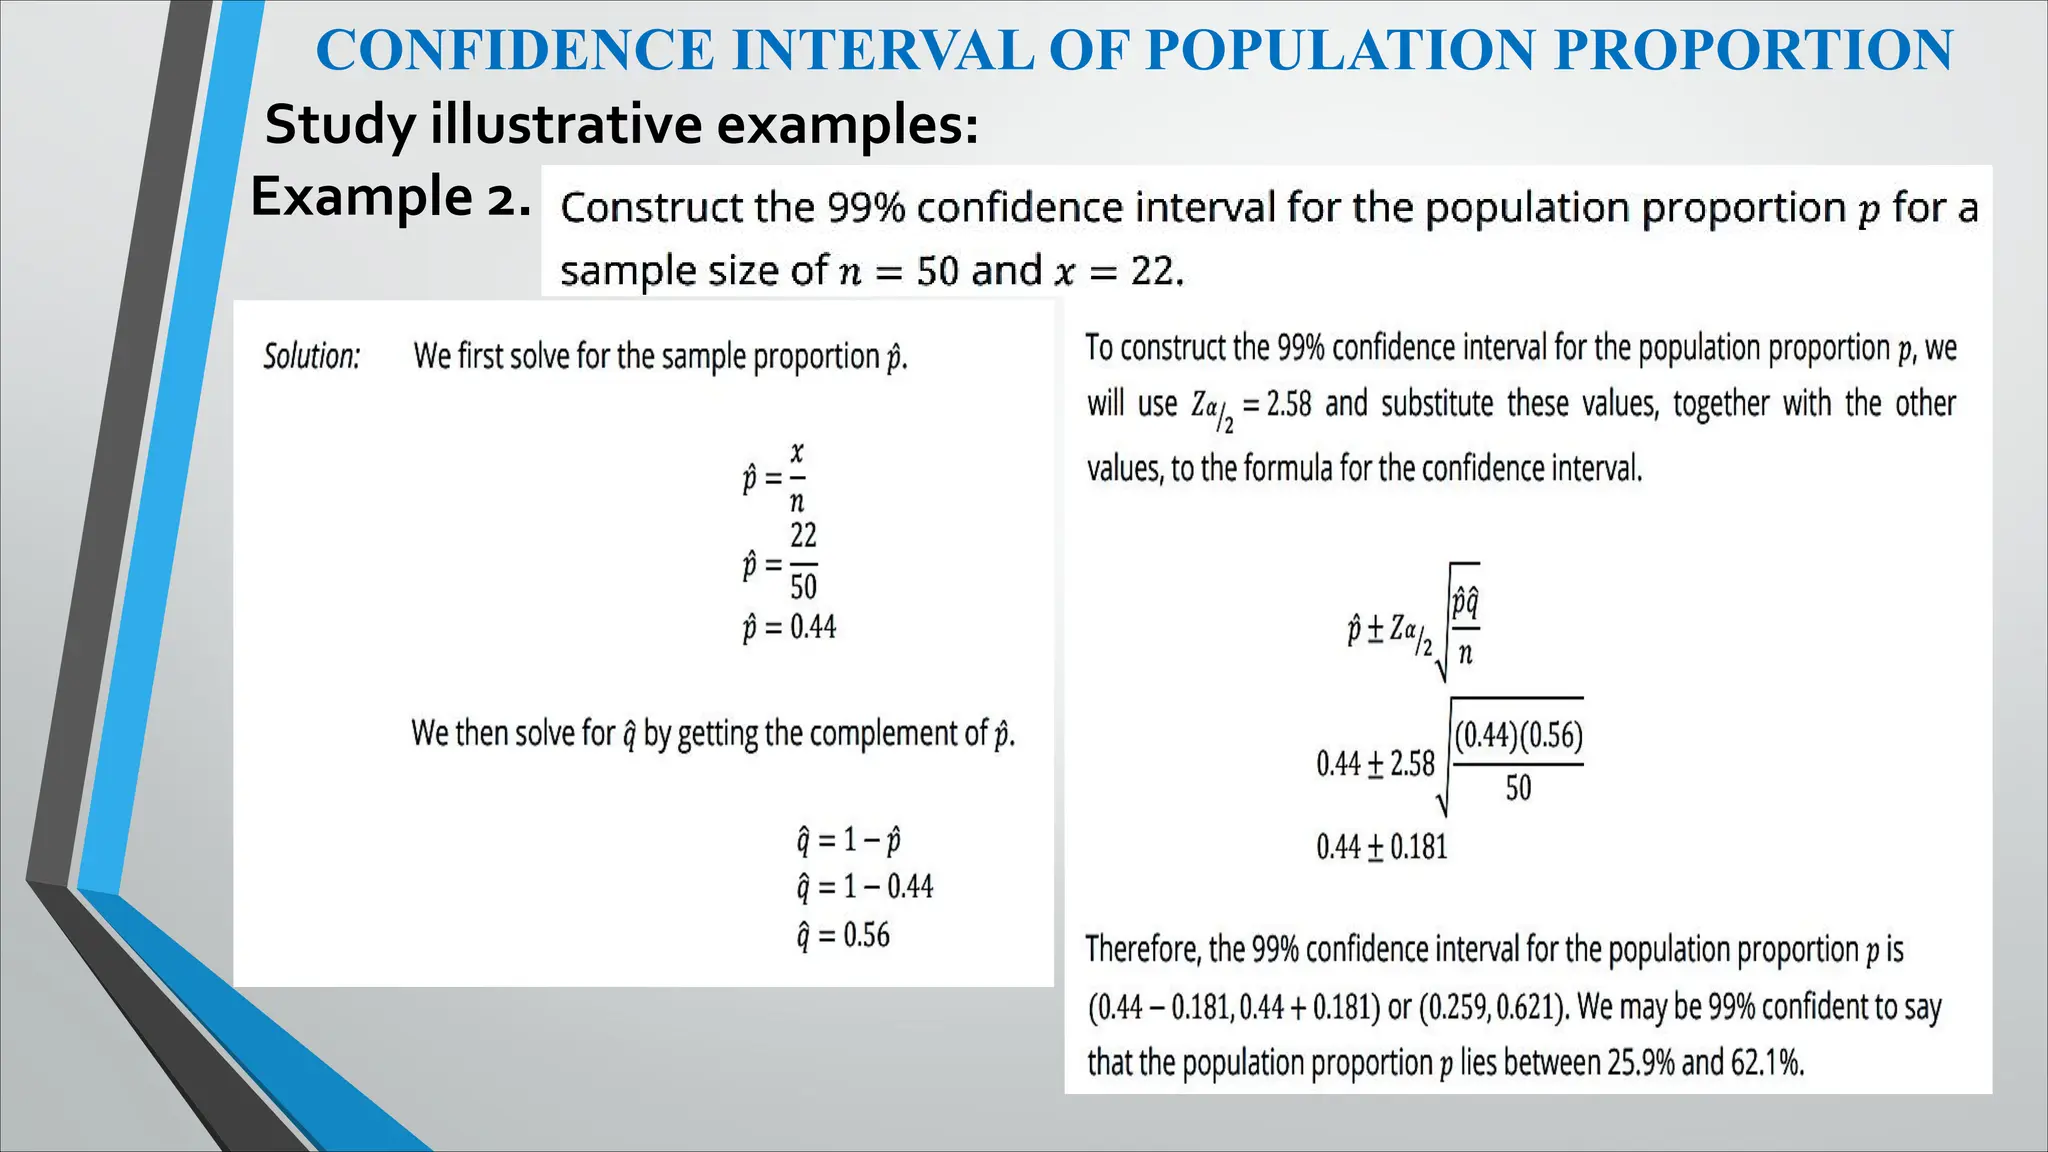
CONFIDENCE INTERVAL OFPOPULATION PROPORTION
If a random sample of n observations is selected from a
population (any population), and x observations among these
belong to the outcome of interest, then when n is sufficiently
large, the sampling distribution of the sample proportion p will
approximate a normal distribution.The sample size n is
sufficiently large when np > 5 and nq < 5.The formula for the
confidence interval estimator for a population proportion p is
given by where;
p is the sample proportion
q is the complement of p
n is the sample size
zα/2 - critical value corresponding to the
level of confidence
14.
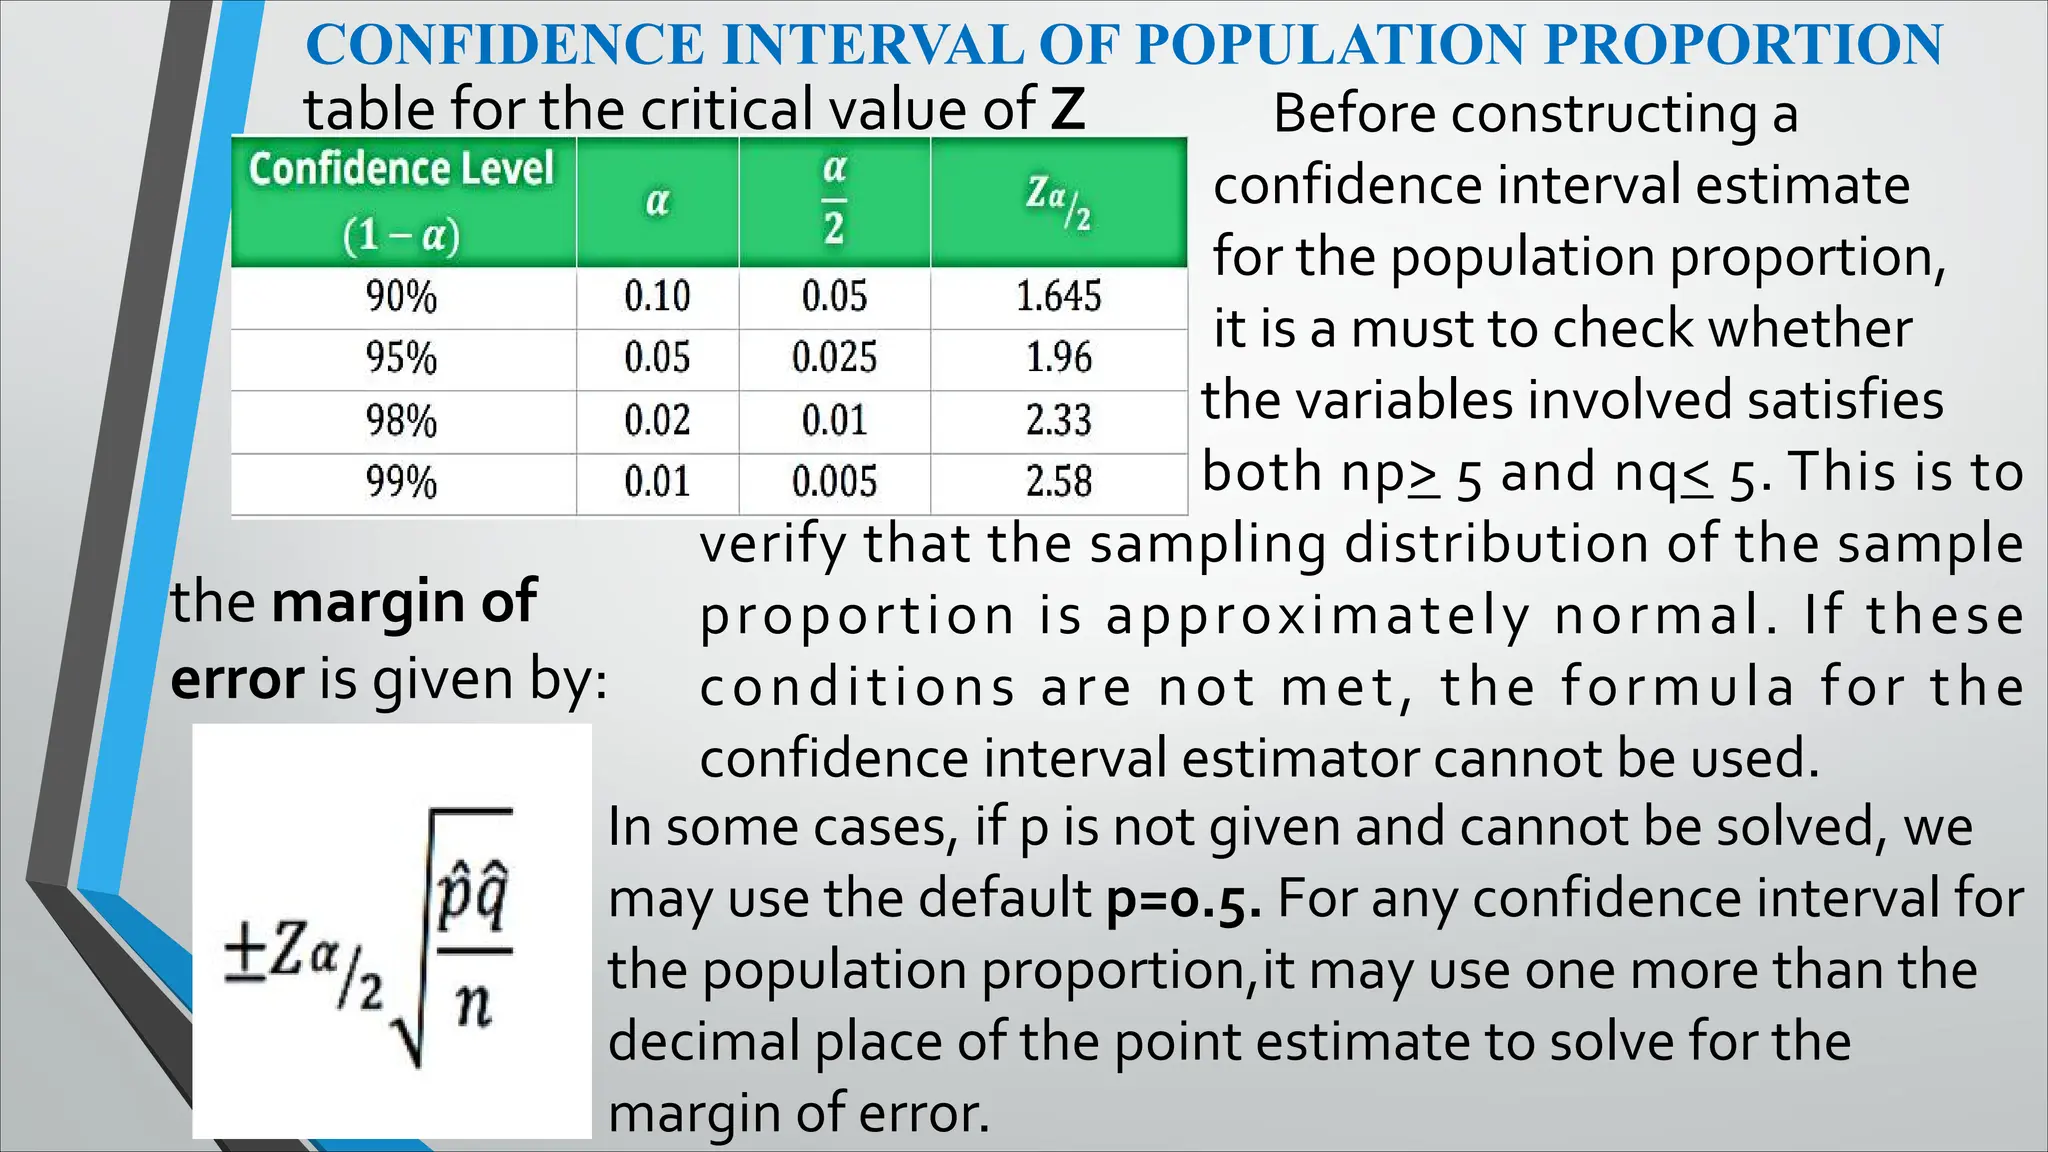
CONFIDENCE INTERVAL OFPOPULATION PROPORTION
table for the critical value of Z
the margin of
error is given by:
Before constructing a
confidence interval estimate
for the population proportion,
it is a must to check whether
the variables involved satisfies
both np> 5 and nq< 5. This is to
verify that the sampling distribution of the sample
proportion is approximately normal. If these
conditions are not met, the formula for the
confidence interval estimator cannot be used.
In some cases, if p is not given and cannot be solved, we
may use the default p=0.5. For any confidence interval for
the population proportion,it may use one more than the
decimal place of the point estimate to solve for the
margin of error.
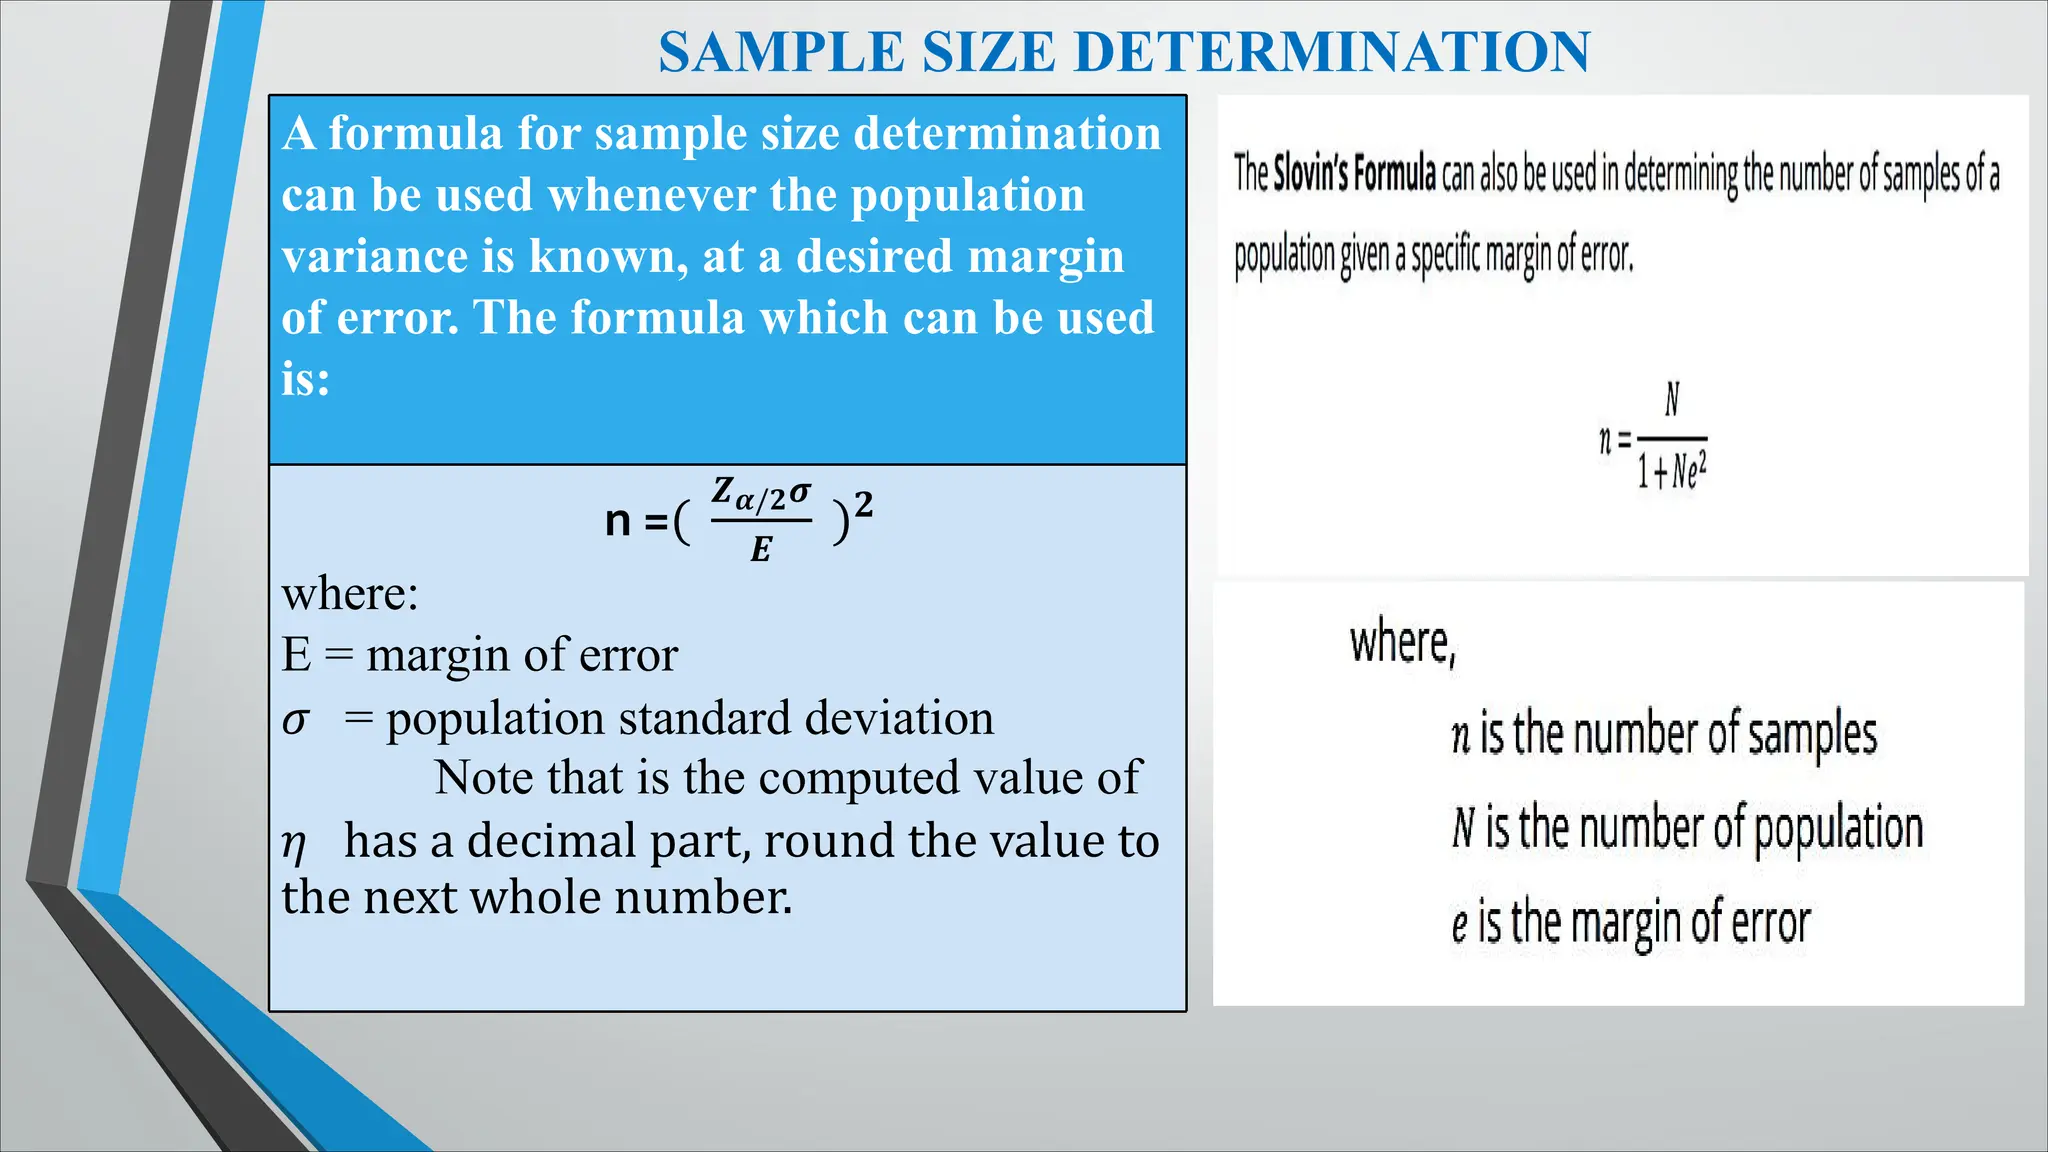
SAMPLE SIZE DETERMINATION
Aformula for sample size determination
can be used whenever the population
variance is known, at a desired margin
of error. The formula which can be used
is:
n =(
��/��
�
)�
where:
E = margin of error
� = population standard deviation
Note that is the computed value of
� has a decimal part, round the value to
the next whole number.
19.
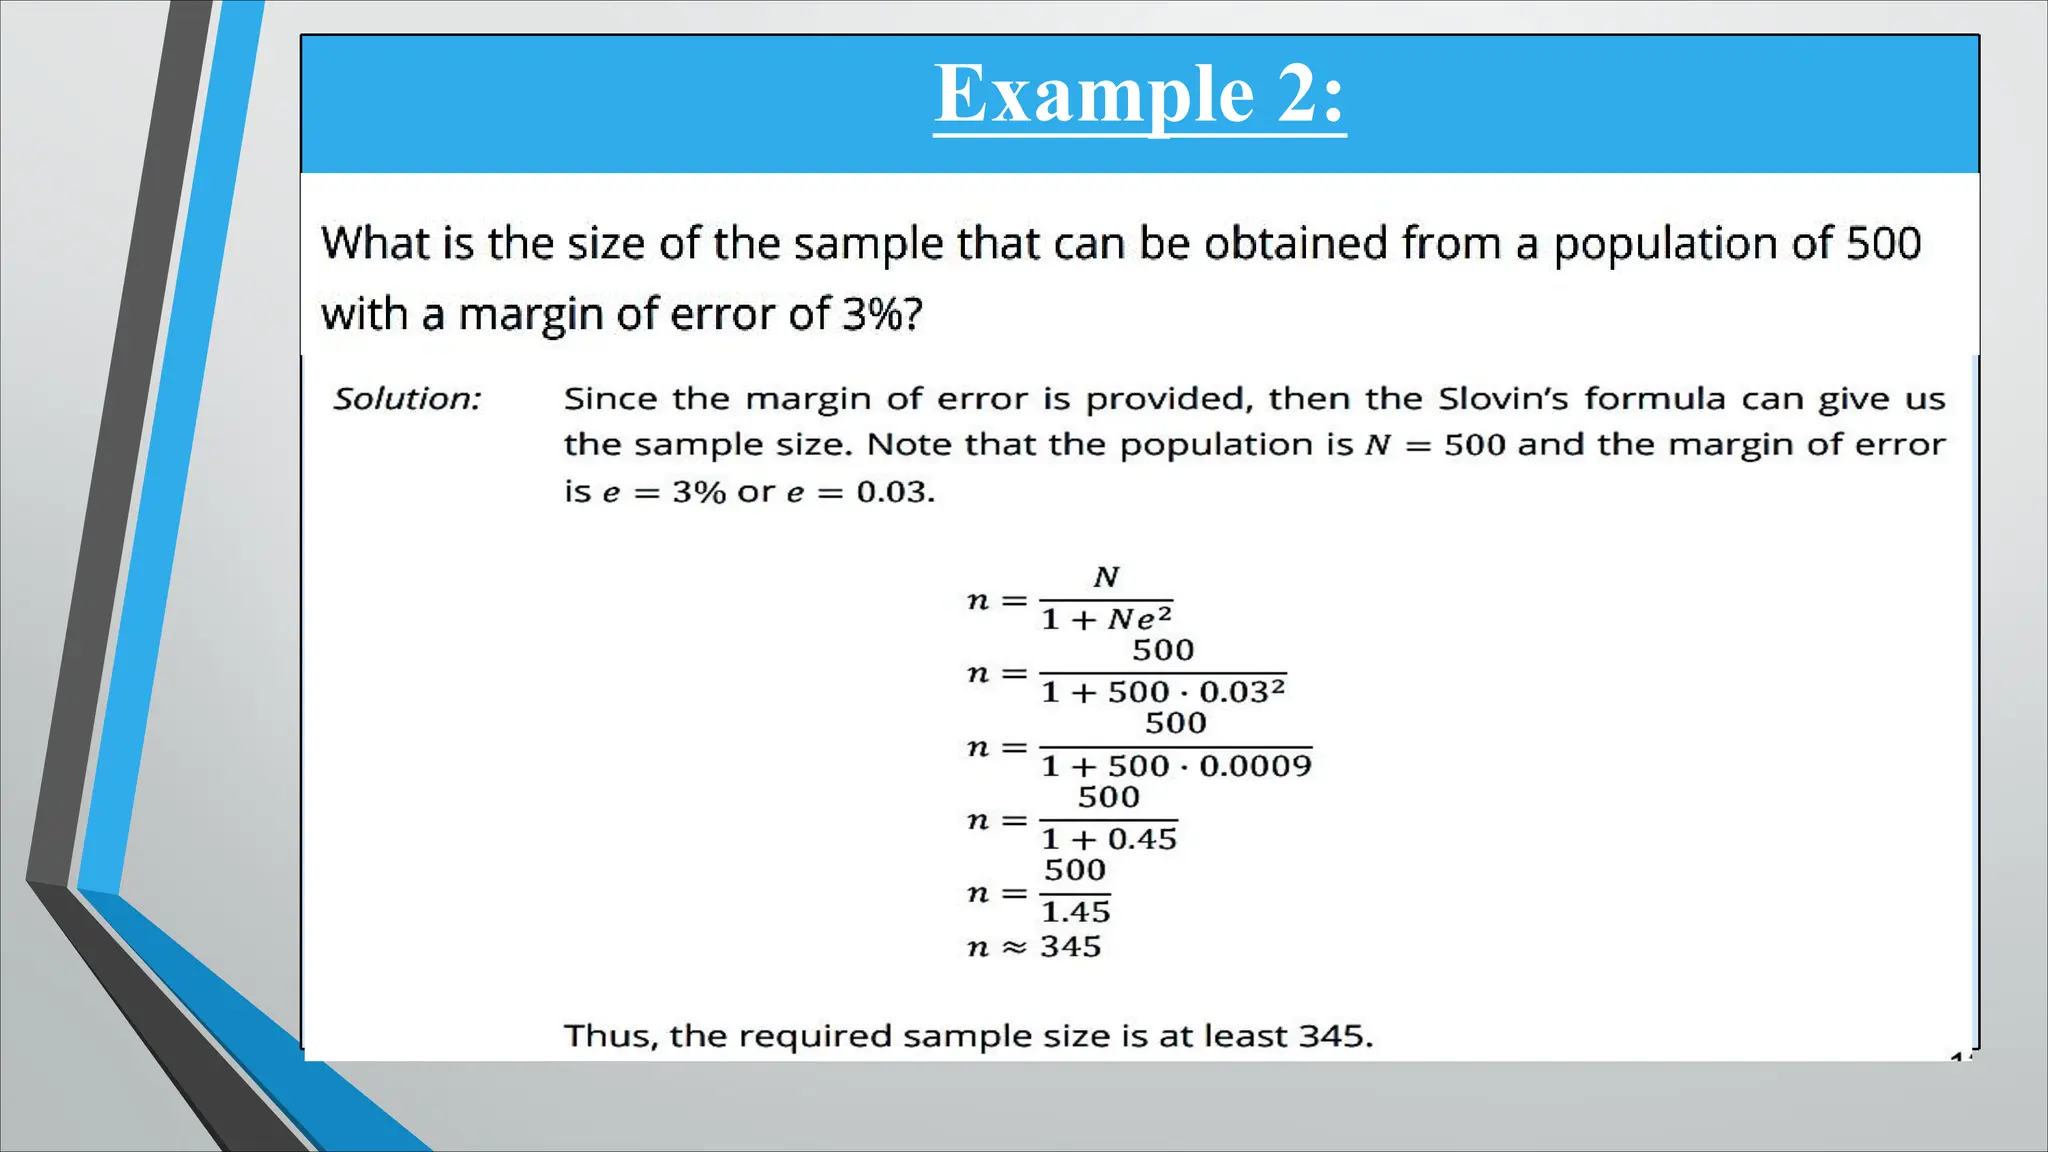
Example 1:
In estimatingthe mean selling price of all college textbooks
which was reported to have a standard deviation of Php80, how
many college textbooks must be selected as sample if you want to
be 95% confident that the sample mean (x) is within Php20 of
the true population mean (� )?
Solution & Answer:
Based from the given, the population variance, � = Php 80, the
confidence level if 95% thus, Za/2=1.96. Also, the estimate must be within
Php 20, thus E=Php 20. Using the formula,
n = (
��/2�
�
)2
n = [
1.96(80)
20
]2 =[
156.8
20
]2
n = [7.84]2
n = 61.47 ≈ 62 textbooks (value is rounded to the
next whole number )
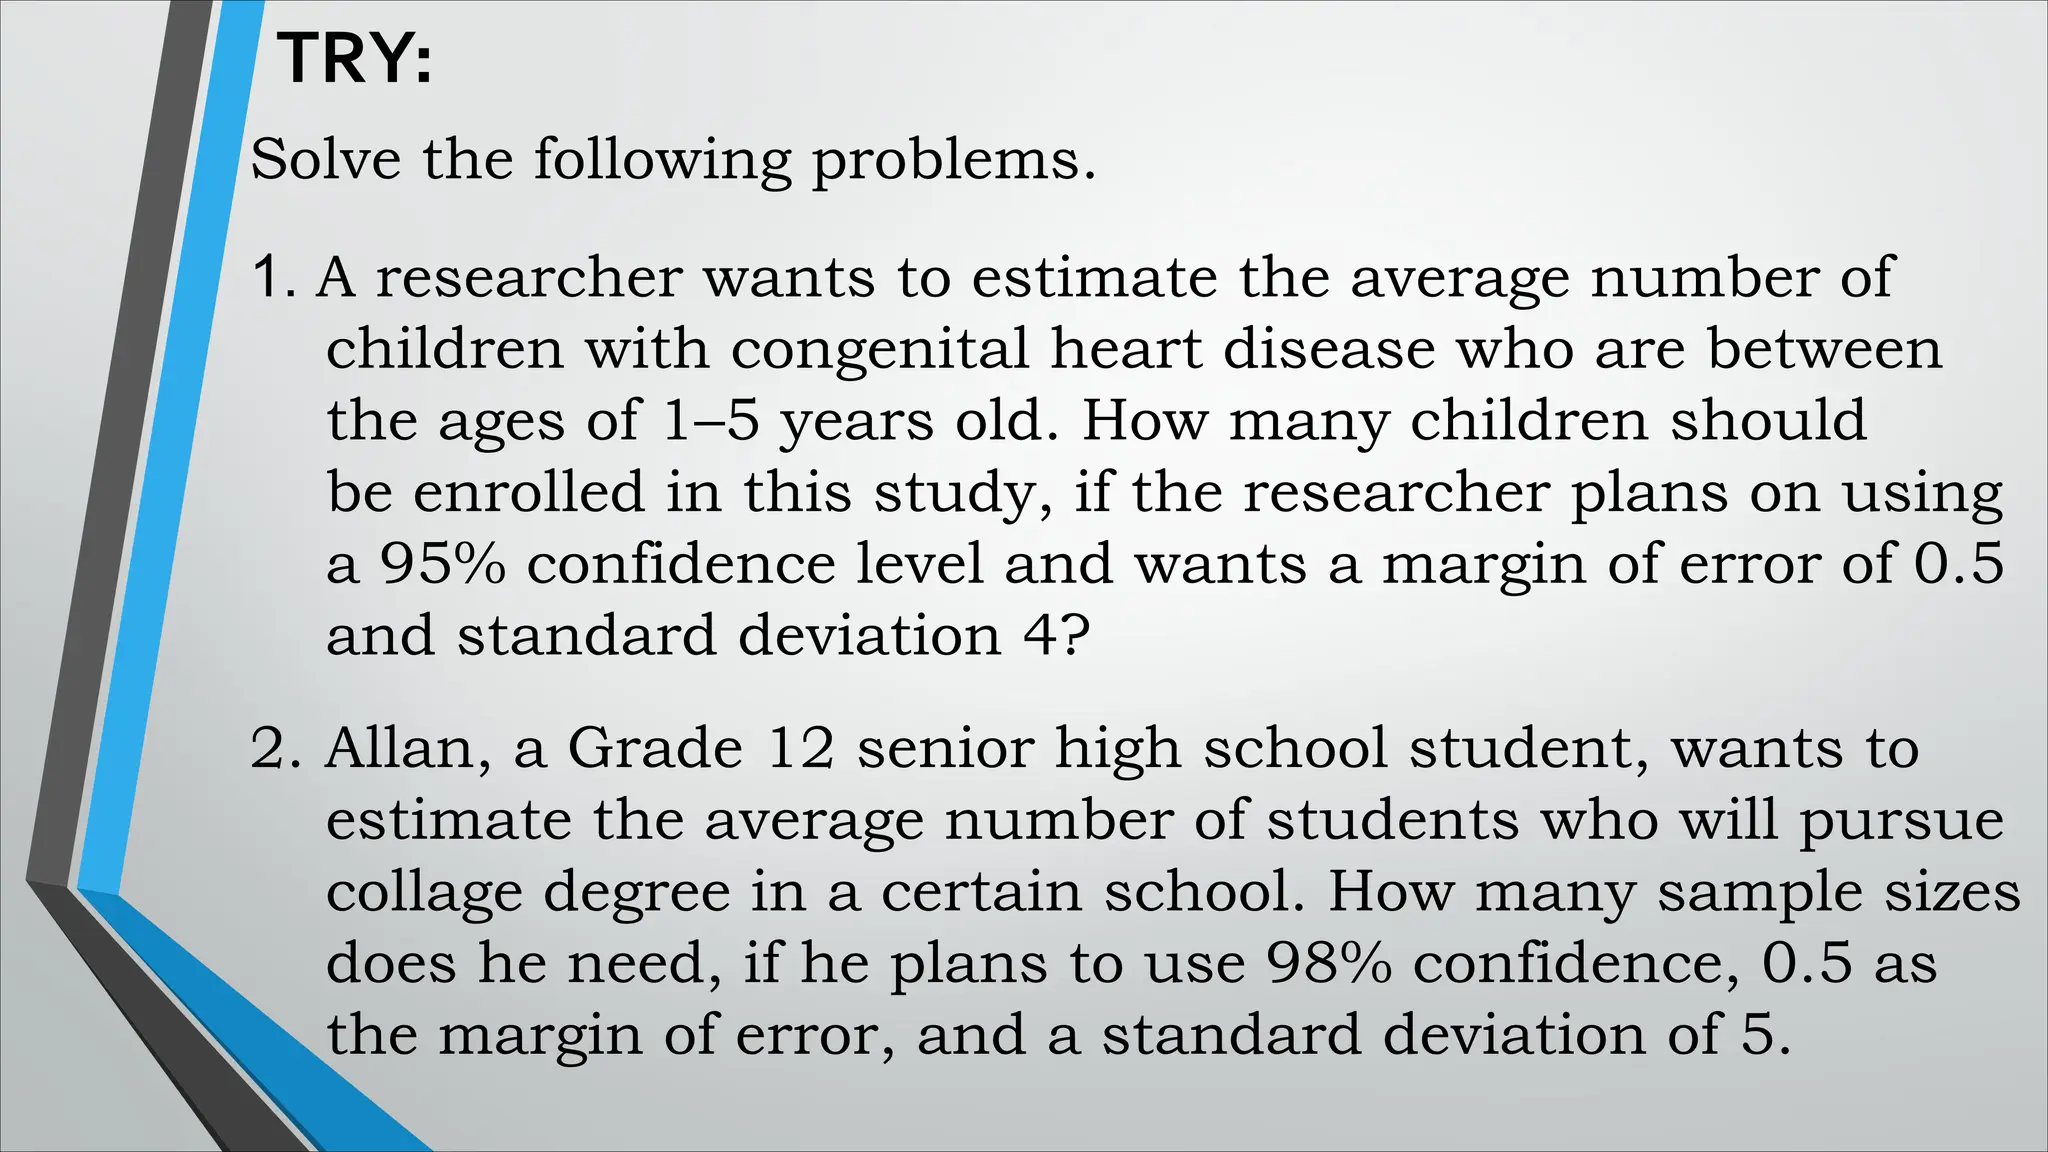
TRY:
Solve the followingproblems.
1. A researcher wants to estimate the average number of
children with congenital heart disease who are between
the ages of 1–5 years old. How many children should
be enrolled in this study, if the researcher plans on using
a 95% confidence level and wants a margin of error of 0.5
and standard deviation 4?
2. Allan, a Grade 12 senior high school student, wants to
estimate the average number of students who will pursue
collage degree in a certain school. How many sample sizes
does he need, if he plans to use 98% confidence, 0.5 as
the margin of error, and a standard deviation of 5.
23.
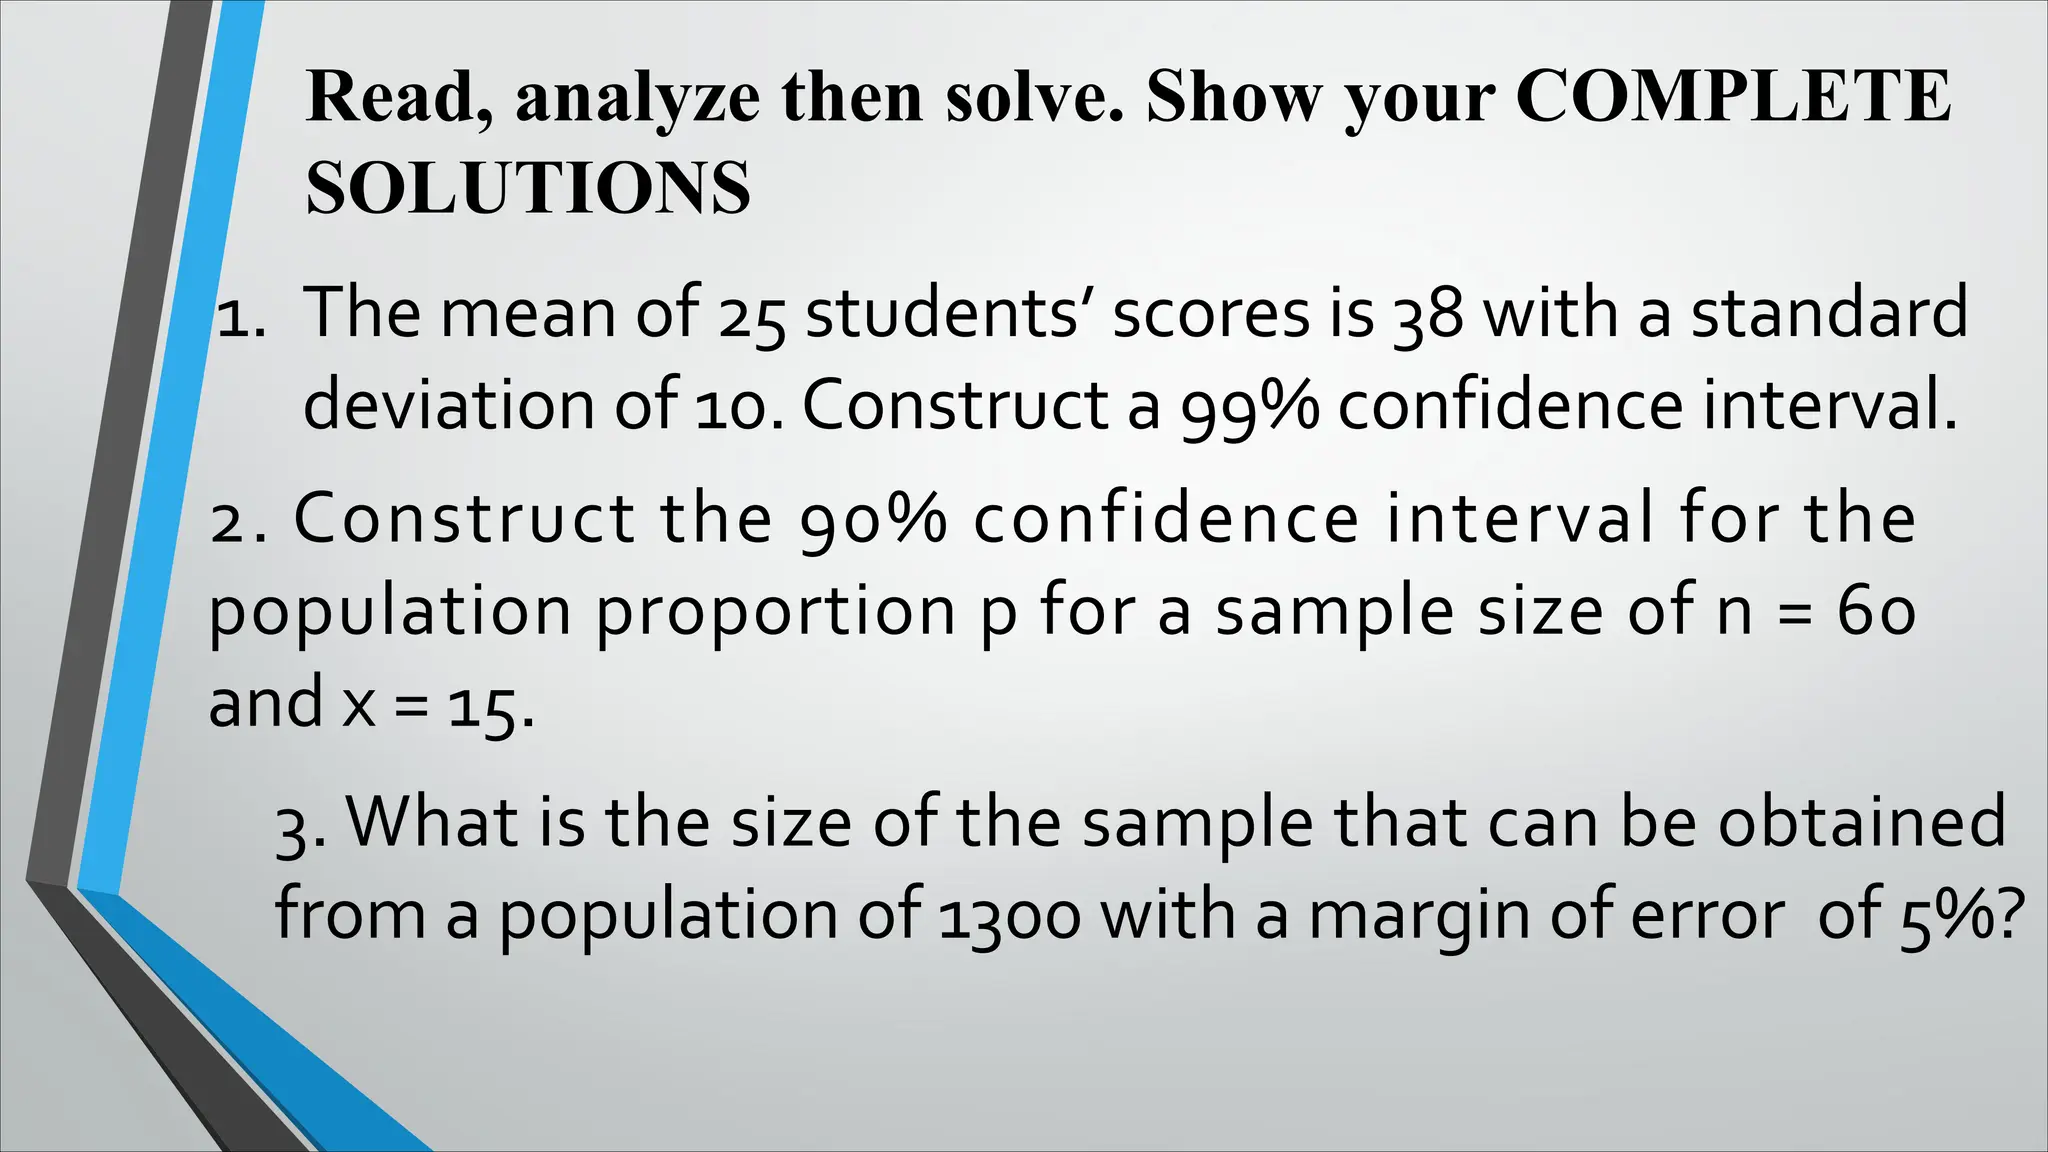
Read, analyze thensolve. Show your COMPLETE
SOLUTIONS
1. The mean of 25 students’ scores is 38 with a standard
deviation of 10. Construct a 99% confidence interval.
2. Construct the 90% confidence interval for the
population proportion p for a sample size of n = 60
and x = 15.
3. What is the size of the sample that can be obtained
from a population of 1300 with a margin of error of 5%?
24.
Criteria
Below
Expectation
(2)
Needs
Improvement
(3)
Successful
Performance
(4)
Exemplary
Performance
(5)
Mathematical
Accuracy
The computations
are erroneous
anddo not show
the use of related
mathematical
concepts
The computations
are erroneous and
show some use of
related
mathematical
concepts
The computations
are accurate and
show the use of
related
mathematical
concepts
The computations
are accurate and
show a wise use of
related
mathematical
concepts
Presentation The student did
not present the
output
The student
presented the
output but is not
confident with his
work
The student
presented the data
and confident with
his work
The student
presented the data
and very confident
with his work
Punctuality The task is
submitted more
than five days late
The task is
submitted four to
five days late
The task is
submitted two to
three days late
The task is
submitted on or
before the target
date
Performance Task Rubric : Total 15 points


![Example 1:
In estimating the mean selling price of all college textbooks
which was reported to have a standard deviation of Php80, how
many college textbooks must be selected as sample if you want to
be 95% confident that the sample mean (x) is within Php20 of
the true population mean (� )?
Solution & Answer:
Based from the given, the population variance, � = Php 80, the
confidence level if 95% thus, Za/2=1.96. Also, the estimate must be within
Php 20, thus E=Php 20. Using the formula,
n = (
��/2�
�
)2
n = [
1.96(80)
20
]2 =[
156.8
20
]2
n = [7.84]2
n = 61.47 ≈ 62 textbooks (value is rounded to the
next whole number )](https://image.slidesharecdn.com/week-1-b-250409150612-b303b648/75/Confidence-Interval-on-the-statistical-analogy-and-computation-19-2048.jpg)


![[DSC Europe 25] Dragan Vucic - Building the Learning Organization - How AI Tr...](https://cdn.slidesharecdn.com/ss_thumbnails/8brigo2sbu6qur6gxrra-7-251205085715-6ae07d24-thumbnail.jpg?width=640&height=640&fit=bounds)


![[DSC Europe 25] Petar Zivanov - AI meets documents From chatbots to AI-powere...](https://cdn.slidesharecdn.com/ss_thumbnails/xer2bb6nrdc8pdpev0pc-8-251204082258-7c2fa4a1-thumbnail.jpg?width=640&height=640&fit=bounds)
![[DSC Europe 25] Dragana Ilic - AI for Big Data in Astronomy.pptx](https://cdn.slidesharecdn.com/ss_thumbnails/8palya86qaatvjhva1ms-2-dragana-ilic-ai-ilic-251208151906-652b819c-thumbnail.jpg?width=640&height=640&fit=bounds)
![[DSC Europe 25] Marija Vlajkovic & Andrea Radonjanin - Integration of AI tool...](https://cdn.slidesharecdn.com/ss_thumbnails/qf1jrglttoc3bm8s3aop-final-integration-of-ai-tools-251208151905-394f3a6a-thumbnail.jpg?width=640&height=640&fit=bounds)


![[DSC Europe 25] Vid Stimac - Policy Parsimony: Between Oversimplifying and Ov...](https://cdn.slidesharecdn.com/ss_thumbnails/eqlepagzqp2rhg3gbluh-dsc-stimac-251120-251205090438-059e7f54-thumbnail.jpg?width=640&height=640&fit=bounds)
![[DSC Europe 25] Max Talanov - Non digital NNs.pptx](https://cdn.slidesharecdn.com/ss_thumbnails/wif8tr3gtua74qvtopke-non-digital-nns-251205090438-26b0eea6-thumbnail.jpg?width=640&height=640&fit=bounds)


![[DSC Europe 25] Dusan Jovicic - AI Story: From on-prem to cloud and back agai...](https://cdn.slidesharecdn.com/ss_thumbnails/8kp49m6uq22ifnbwhfnk-2-251205085715-964d11a6-thumbnail.jpg?width=640&height=640&fit=bounds)