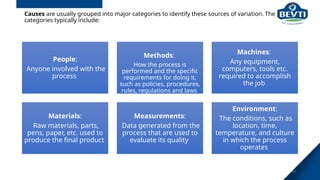
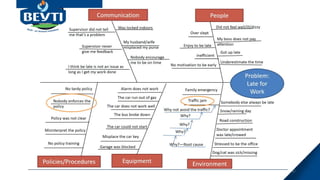
Systematic Troubleshooting
Engineering Division
2
Content:
1. Introduction
2. Mental Approach
3. Technical Approach
4. RCA, Methods &Tools
3
INTRODUCTION
• The primary objectives of
troubleshooting are to figure out
why something doesn't work as
intended and provide a solution
to resolve the issue.
• Troubleshooting is a skill that if
properly executed can be
effective in reducing downtime,
cost.
• In-reality, correcting a problem is
easy. But finding the “ problem” is
the problem. “troubleshooting
can be thought of as the art of
detecting”.
Mental
Approach
APPROACHES OF TROUBLESHOOTING
MENTAL APPROACH
Humility
Neutrality
Mental block
Time for a break
Anger
Fear
5
MENTAL APPROACH
Humility
is the freedom from arrogance, It is this absence of ego.
It opens the door to constant inquiry and learning.
6
MENTAL APPROACH
Neutrality
• Ensure that you don’t
commit yourself before
finding the trouble.
• Don’t make the common
mistake of believing that
your guess is always right
and try to prove it.
7
MENTAL APPROACH
Mental block
It is the inability to think in a logical and clear
manner
Symptoms of the metal block include:
 Being stuck on one idea without any factual
reason.
 An inability to make sense of your test.
 The machine looks different and more complicated
than it is.
 Performing the same test over and over.
 No new ideas are flowing.
8
MENTAL APPROACH
 Time for a break, the brain is like a muscle and may get tired after a
rough thinking of the problem, the solution is to take a break.
Ways of having an effective break
 Talk to someone, but don’t talk about the problem.
 Take a short nap.
 Take a walk.
 Have a refreshing drink.
 Take your mind off the problem and think of something else.
9
MENTAL
APPROACH
Anger
is something we need to check, remember
these are machines that don’t have
feelings, It will never respond to anger or
emotion, machines are the most patient
things, It will be waiting for you to make
the right moves to allow it to work again.
10
MENTAL APPROACH
 Fear is the most common reason of ineffective
troubleshooting, this common fear is the “fear of
failure”, to overcome this is to change your mental
approach.
 Be confident of your ability.
 Try to calm yourself and be systematic.
 Keep in mind that the problem already occurs.
 Ask other people about the problem.
 Know your equipment well.
11
Technical Approach
TECHNICAL APPROACH
Divide and conquer, most system is made up of
several section, reduction of the area of work
increase your chances of solving any problem
quickly.
When should I use this method?
When you have no idea where the cause of the
problem is located within the system.
13
TECHNICAL APPROACH
 Separate into sections is somehow similar to the divide
and conquer method the difference is that this method is
applied to system functionality.
System sections.
 Electrical
 Mechanical
 Electronics
14
TECHNICAL APPROACH
 Keep Track this method is the most difficult way due to the time
involve, the system is compost of different section which
correlates with one another configure into series. Logical
troubleshooting is required.
15
TECHNICAL APPROACH
Substitution Method is the simplest method
due to the way the procedure works, in this,
you need to have a spare unit on the
suspected parts, replacing each one until the
system is fix.
Drawback: needs spare parts readily available
and uncertain if the spare unit will be
damaged in the process.
16
Root Cause Analysis
RCA
Introduction
Problems happen everyday and it is up to
Industrial Engineers to understand why!
Problems are not solved properly unless you
understand why they are occurring.
The reason for a problem is called the problem’s
root cause.
What Is Root Cause Analysis?
•Root cause analysis (RCA) is
defined as a systematic
process for identifying the
root causes of problems or
events and an action plan
for responding to them.
19
What Is Root Cause Analysis?
•Another common occurrence
is for companies to treat the
symptoms rather than the
actual underlying problems
contributing to the issue,
leading to recurrence.
20
21
How to Conduct a Root
Cause Analysis (RCA)
22
Problem Statement
• Should be short and focused but provide enough details to clearly state the
problem
• The problem statement should
• Describe the problem
• Include criteria for measuring the problem
• Include any negative consequences resulting from the problem.
Phase 1 – Organize a well-defined team
•Organize a well-defined team (Department/ program)
•Keep the team small.
•Identify team leader and team member
•Each team member should have clearly defined roles and
responsibilities.
23
Phase 2 - Data Collection
•Start Collecting data is probably the most important step in the root
cause analysis.
•It’s best practice to collect data immediately after a failure happens or,
if possible, while the failure is occurring.
•Examples of data you should collect:
• Conditions before, during and after the occurrence.
• Employee involvement (actions taken).
• Any environmental factors.
• When machinery is involved, collect data and samples on things like
lubrication systems, filters and separators.
24
Phase 3 – Analyze data and start Assessment
•During the assessment phase, analyze all collected data to
identify possible causal factors until one (or more) root causes
are determined.
25
Phase 4 - Corrective Action
•First, identify the corrective action for each cause.
•Test the best solutions / actions and implement the plan.
26
Phase 5 - Inform
•Communication is key. Ensure all affected parties are
informed of the pending correction or
implementation.
27
28
Phase 6 - Follow-up
•The follow-up phase is where you establish if your corrective
action is effective in resolving the issues.
• Track corrective actions to confirm that they were
implemented properly and are working as intended.
• Periodically review the new corrective action tracking
system to verify that it is being implemented effectively.
• Analyze any recurrence of the same event and determine
why the corrective action(s) were not effective.
Steps of RCA
Define the
problem
Data Collection &
Analysis
RCA
Test The Best
Solution &
Implementati
on
Evaluate
Results
&
Process
Share the
result
Data & Facts
Pareto Chart
5 why
Fishbone
Analysis
PDSA
Meeting &
Discussion.
30
(RCA) Tools and Methods
31
Tools and Methods
•Selection of the tools depending on the complexity
and the available resources.
Pareto Chart
A graphical tool used to identify the most significant
contributing factors to problem.
This state that 80% of the effects come from 20% of the causes.
Useful when there are several contributing factors to a
problem
32
5 Why Analysis
33
34
What Is 5 Whys Analysis?
The 5 Why Root Cause
Analysis is a technique
used to analyze any
problem by repeatedly
asking the question
“Why”, which leads to
the root cause of a
problem.
The 5 Why Method
does not solve the
problem, rather it
identifies the root
cause of the problem!
The root cause will
allow us to understand
why the problem
happened and from
there we can develop
solutions to fix it.
When To Use The 5 Whys Analysis?
The 5 Why Root Cause Analysis is
used to understand the root cause
of a problem to prevent similar
occurrences in the future.
Easy to use and doesn’t require
any special skills or resources.
35
Five Why’s Preparation
• Any 5 Why’s must address two different problems at the same time.
The first part is related to the process that made the defective part.
(“Why made?”)
• The second one must address the detection system that was not
able to detect the defective part before it became a problem. The
lack of detection of a defective product is a problem of its own and
must be treated independently than the product problem itself.
(“Why not detected?”)
Five Why’s Preparation
•It is said that a well-defined problem is a half-resolved problem; hence it is important to
state the problem as clearly as possible.
•Whenever possible define the problem in terms of the requirements that are not being
met. This will add a reference to the condition that should be and is not.
I didn’t plan well for all I need to do or I underestimate
the time for each task.
Why 5
I had a lot of things to do before I went to sleep
Why 4
I went to sleep so late last night
Why 3
5 Whys Infographics – “Late for work”
I have trafic jam today
Why 1
I couldn’t get up early to avoid the trafic.
Why 2
ROOT CAUSE
39
UNDERESTIMATE THE TIME
FOR EACH TASK.
DIDN’T HAVE A GOOD PLAN
FOR TASKS.
DIDN’T KNOW WHICH TASK
IS NECESSARY OR
IMPORTANT.
40
Root Cause validation
• To validate root cause, ask the following:
• If you remove this root cause would this event have been prevented?
Fishbone
Diagram
ALSO CALLED ISHIKAWA
DIAGRAM
41
WHAT IS A FISHBONE DIAGRAM?
• ‘Cause & effect’ diagram
• A visual way of showing the
potential causes of a problem
• Looks bit like skeleton of a fish
42
WHEN TO USE A FISHBONE DIAGRAM?
When there is an issue which has various
causes
When you need different points of view to
look at a problem
Before you think about making changes
Causes are usually grouped into major categories to identify these sources of variation. The
categories typically include:
People:
Anyone involved with the
process
Methods:
How the process is
performed and the specific
requirements for doing it,
such as policies, procedures,
rules, regulations and laws
Machines:
Any equipment,
computers, tools etc.
required to accomplish
the job
Materials:
Raw materials, parts,
pens, paper, etc. used to
produce the final product
Measurements:
Data generated from the
process that are used to
evaluate its quality
Environment:
The conditions, such as
location, time,
temperature, and culture
in which the process
operates
44
45
FISHBONE DIAGRAM?
A template
Long clinic
waiting time
Process
Environm
ent
Equipment People
46
HOW DO YOU CREATE A FISHBONE DIAGRAM? - What do you do?
Long clinic
waiting time
Method
s
Environmen
t
Equipment People
Not enough
treatment
rooms
Small
building
Transport arrives
early
Poor
scheduling
Process
takes too
long
Too much
paperwork
Incorrect
referrals
Unexpected
patients
Missed
appointments
Staff
sickness
Lateness
Lifts
broken
Wheelchair
s not
enough
47
Neptune
Fishbone Diagram Template
03
Mercury
Venus
Callisto
Europa
02
Phoebe
Pluto
Moon
01
Mercury
Sun
04
Earth
Venus
05
Mars
Venus
Jupiter
06
Thebe
Metis
Saturn
Phoebe
Earth
Fishbone Diagram Template
Mercury
Saturn
Mercury is
small
Saturn is
ringed
Venus
Jupiter
Venus is a
hot place
Jupiter is a
gas giant
Neptune
Sun
Neptune is
far away
The Sun is
a star
Mars
Pluto
Mars is a
cold place
Pluto is icy
and small
Thank you
Manufacturing & Engineering Division

SYSTEMATIC TROUBLESHOOTING. - V3.pptx

  • 1.
  • 2.
    2 Content: 1. Introduction 2. MentalApproach 3. Technical Approach 4. RCA, Methods &Tools
  • 3.
    3 INTRODUCTION • The primaryobjectives of troubleshooting are to figure out why something doesn't work as intended and provide a solution to resolve the issue. • Troubleshooting is a skill that if properly executed can be effective in reducing downtime, cost. • In-reality, correcting a problem is easy. But finding the “ problem” is the problem. “troubleshooting can be thought of as the art of detecting”.
  • 4.
  • 5.
    APPROACHES OF TROUBLESHOOTING MENTALAPPROACH Humility Neutrality Mental block Time for a break Anger Fear 5
  • 6.
    MENTAL APPROACH Humility is thefreedom from arrogance, It is this absence of ego. It opens the door to constant inquiry and learning. 6
  • 7.
    MENTAL APPROACH Neutrality • Ensurethat you don’t commit yourself before finding the trouble. • Don’t make the common mistake of believing that your guess is always right and try to prove it. 7
  • 8.
    MENTAL APPROACH Mental block Itis the inability to think in a logical and clear manner Symptoms of the metal block include:  Being stuck on one idea without any factual reason.  An inability to make sense of your test.  The machine looks different and more complicated than it is.  Performing the same test over and over.  No new ideas are flowing. 8
  • 9.
    MENTAL APPROACH  Timefor a break, the brain is like a muscle and may get tired after a rough thinking of the problem, the solution is to take a break. Ways of having an effective break  Talk to someone, but don’t talk about the problem.  Take a short nap.  Take a walk.  Have a refreshing drink.  Take your mind off the problem and think of something else. 9
  • 10.
    MENTAL APPROACH Anger is something weneed to check, remember these are machines that don’t have feelings, It will never respond to anger or emotion, machines are the most patient things, It will be waiting for you to make the right moves to allow it to work again. 10
  • 11.
    MENTAL APPROACH  Fearis the most common reason of ineffective troubleshooting, this common fear is the “fear of failure”, to overcome this is to change your mental approach.  Be confident of your ability.  Try to calm yourself and be systematic.  Keep in mind that the problem already occurs.  Ask other people about the problem.  Know your equipment well. 11
  • 12.
  • 13.
    TECHNICAL APPROACH Divide andconquer, most system is made up of several section, reduction of the area of work increase your chances of solving any problem quickly. When should I use this method? When you have no idea where the cause of the problem is located within the system. 13
  • 14.
    TECHNICAL APPROACH  Separateinto sections is somehow similar to the divide and conquer method the difference is that this method is applied to system functionality. System sections.  Electrical  Mechanical  Electronics 14
  • 15.
    TECHNICAL APPROACH  KeepTrack this method is the most difficult way due to the time involve, the system is compost of different section which correlates with one another configure into series. Logical troubleshooting is required. 15
  • 16.
    TECHNICAL APPROACH Substitution Methodis the simplest method due to the way the procedure works, in this, you need to have a spare unit on the suspected parts, replacing each one until the system is fix. Drawback: needs spare parts readily available and uncertain if the spare unit will be damaged in the process. 16
  • 17.
  • 18.
    Introduction Problems happen everydayand it is up to Industrial Engineers to understand why! Problems are not solved properly unless you understand why they are occurring. The reason for a problem is called the problem’s root cause.
  • 19.
    What Is RootCause Analysis? •Root cause analysis (RCA) is defined as a systematic process for identifying the root causes of problems or events and an action plan for responding to them. 19
  • 20.
    What Is RootCause Analysis? •Another common occurrence is for companies to treat the symptoms rather than the actual underlying problems contributing to the issue, leading to recurrence. 20
  • 21.
    21 How to Conducta Root Cause Analysis (RCA)
  • 22.
    22 Problem Statement • Shouldbe short and focused but provide enough details to clearly state the problem • The problem statement should • Describe the problem • Include criteria for measuring the problem • Include any negative consequences resulting from the problem.
  • 23.
    Phase 1 –Organize a well-defined team •Organize a well-defined team (Department/ program) •Keep the team small. •Identify team leader and team member •Each team member should have clearly defined roles and responsibilities. 23
  • 24.
    Phase 2 -Data Collection •Start Collecting data is probably the most important step in the root cause analysis. •It’s best practice to collect data immediately after a failure happens or, if possible, while the failure is occurring. •Examples of data you should collect: • Conditions before, during and after the occurrence. • Employee involvement (actions taken). • Any environmental factors. • When machinery is involved, collect data and samples on things like lubrication systems, filters and separators. 24
  • 25.
    Phase 3 –Analyze data and start Assessment •During the assessment phase, analyze all collected data to identify possible causal factors until one (or more) root causes are determined. 25
  • 26.
    Phase 4 -Corrective Action •First, identify the corrective action for each cause. •Test the best solutions / actions and implement the plan. 26
  • 27.
    Phase 5 -Inform •Communication is key. Ensure all affected parties are informed of the pending correction or implementation. 27
  • 28.
    28 Phase 6 -Follow-up •The follow-up phase is where you establish if your corrective action is effective in resolving the issues. • Track corrective actions to confirm that they were implemented properly and are working as intended. • Periodically review the new corrective action tracking system to verify that it is being implemented effectively. • Analyze any recurrence of the same event and determine why the corrective action(s) were not effective.
  • 29.
    Steps of RCA Definethe problem Data Collection & Analysis RCA Test The Best Solution & Implementati on Evaluate Results & Process Share the result Data & Facts Pareto Chart 5 why Fishbone Analysis PDSA Meeting & Discussion.
  • 30.
  • 31.
    31 Tools and Methods •Selectionof the tools depending on the complexity and the available resources.
  • 32.
    Pareto Chart A graphicaltool used to identify the most significant contributing factors to problem. This state that 80% of the effects come from 20% of the causes. Useful when there are several contributing factors to a problem 32
  • 33.
  • 34.
    34 What Is 5Whys Analysis? The 5 Why Root Cause Analysis is a technique used to analyze any problem by repeatedly asking the question “Why”, which leads to the root cause of a problem. The 5 Why Method does not solve the problem, rather it identifies the root cause of the problem! The root cause will allow us to understand why the problem happened and from there we can develop solutions to fix it.
  • 35.
    When To UseThe 5 Whys Analysis? The 5 Why Root Cause Analysis is used to understand the root cause of a problem to prevent similar occurrences in the future. Easy to use and doesn’t require any special skills or resources. 35
  • 36.
    Five Why’s Preparation •Any 5 Why’s must address two different problems at the same time. The first part is related to the process that made the defective part. (“Why made?”) • The second one must address the detection system that was not able to detect the defective part before it became a problem. The lack of detection of a defective product is a problem of its own and must be treated independently than the product problem itself. (“Why not detected?”)
  • 37.
    Five Why’s Preparation •Itis said that a well-defined problem is a half-resolved problem; hence it is important to state the problem as clearly as possible. •Whenever possible define the problem in terms of the requirements that are not being met. This will add a reference to the condition that should be and is not.
  • 38.
    I didn’t planwell for all I need to do or I underestimate the time for each task. Why 5 I had a lot of things to do before I went to sleep Why 4 I went to sleep so late last night Why 3 5 Whys Infographics – “Late for work” I have trafic jam today Why 1 I couldn’t get up early to avoid the trafic. Why 2
  • 39.
    ROOT CAUSE 39 UNDERESTIMATE THETIME FOR EACH TASK. DIDN’T HAVE A GOOD PLAN FOR TASKS. DIDN’T KNOW WHICH TASK IS NECESSARY OR IMPORTANT.
  • 40.
    40 Root Cause validation •To validate root cause, ask the following: • If you remove this root cause would this event have been prevented?
  • 41.
  • 42.
    WHAT IS AFISHBONE DIAGRAM? • ‘Cause & effect’ diagram • A visual way of showing the potential causes of a problem • Looks bit like skeleton of a fish 42
  • 43.
    WHEN TO USEA FISHBONE DIAGRAM? When there is an issue which has various causes When you need different points of view to look at a problem Before you think about making changes
  • 44.
    Causes are usuallygrouped into major categories to identify these sources of variation. The categories typically include: People: Anyone involved with the process Methods: How the process is performed and the specific requirements for doing it, such as policies, procedures, rules, regulations and laws Machines: Any equipment, computers, tools etc. required to accomplish the job Materials: Raw materials, parts, pens, paper, etc. used to produce the final product Measurements: Data generated from the process that are used to evaluate its quality Environment: The conditions, such as location, time, temperature, and culture in which the process operates 44
  • 45.
    45 FISHBONE DIAGRAM? A template Longclinic waiting time Process Environm ent Equipment People
  • 46.
    46 HOW DO YOUCREATE A FISHBONE DIAGRAM? - What do you do? Long clinic waiting time Method s Environmen t Equipment People Not enough treatment rooms Small building Transport arrives early Poor scheduling Process takes too long Too much paperwork Incorrect referrals Unexpected patients Missed appointments Staff sickness Lateness Lifts broken Wheelchair s not enough
  • 47.
  • 48.
  • 49.
    Earth Fishbone Diagram Template Mercury Saturn Mercuryis small Saturn is ringed Venus Jupiter Venus is a hot place Jupiter is a gas giant Neptune Sun Neptune is far away The Sun is a star Mars Pluto Mars is a cold place Pluto is icy and small
  • 50.
    Thank you Manufacturing &Engineering Division

Editor's Notes

  • #29 PDSA Plan Do Study Act
  • #42 It’s cause and effect diagram that helps you to think through the causes of a problem (including possible root causes) which then structures and groups them appropriately to help you move forward. A visual way of showing the potential causes of a problem. It’s called a Fishbone simply because it looks a bit like the skeleton of a fish.
  • #43 You want to use a fishbone diagram when you’ve identified that there is an issue or problem that you think you need to work on finding a solution and or there are processes that don’t work as well as they could and when there a. When you want to find out different view points from all those who are effected by the problem. You should use it before you think about making changes to identify what the causes are before making the assumption you know what all the causes are and which ones you want to address. Important to have different members of the team from all different disciplines as each will bring their own ideas/experiences about what they feel is important and contributing to the problem.
  • #45 If you are working on the problem of long waiting times you will put this to the right; the head of the fish and then draw an arrow across the page; the backbone. If you have agreed some main categories add this to the diagram; the bones of the fish. Then brainstorm all the possible causes.
  • #46 After the brainstorming session you will need to add the possible causes under the right category slowly building it up until all the ideas of possible causes have been added to the diagram. If there are any which don’t fit into the main categories you may need to add a new category. This is what it will look like if you created the fish bone diagram.