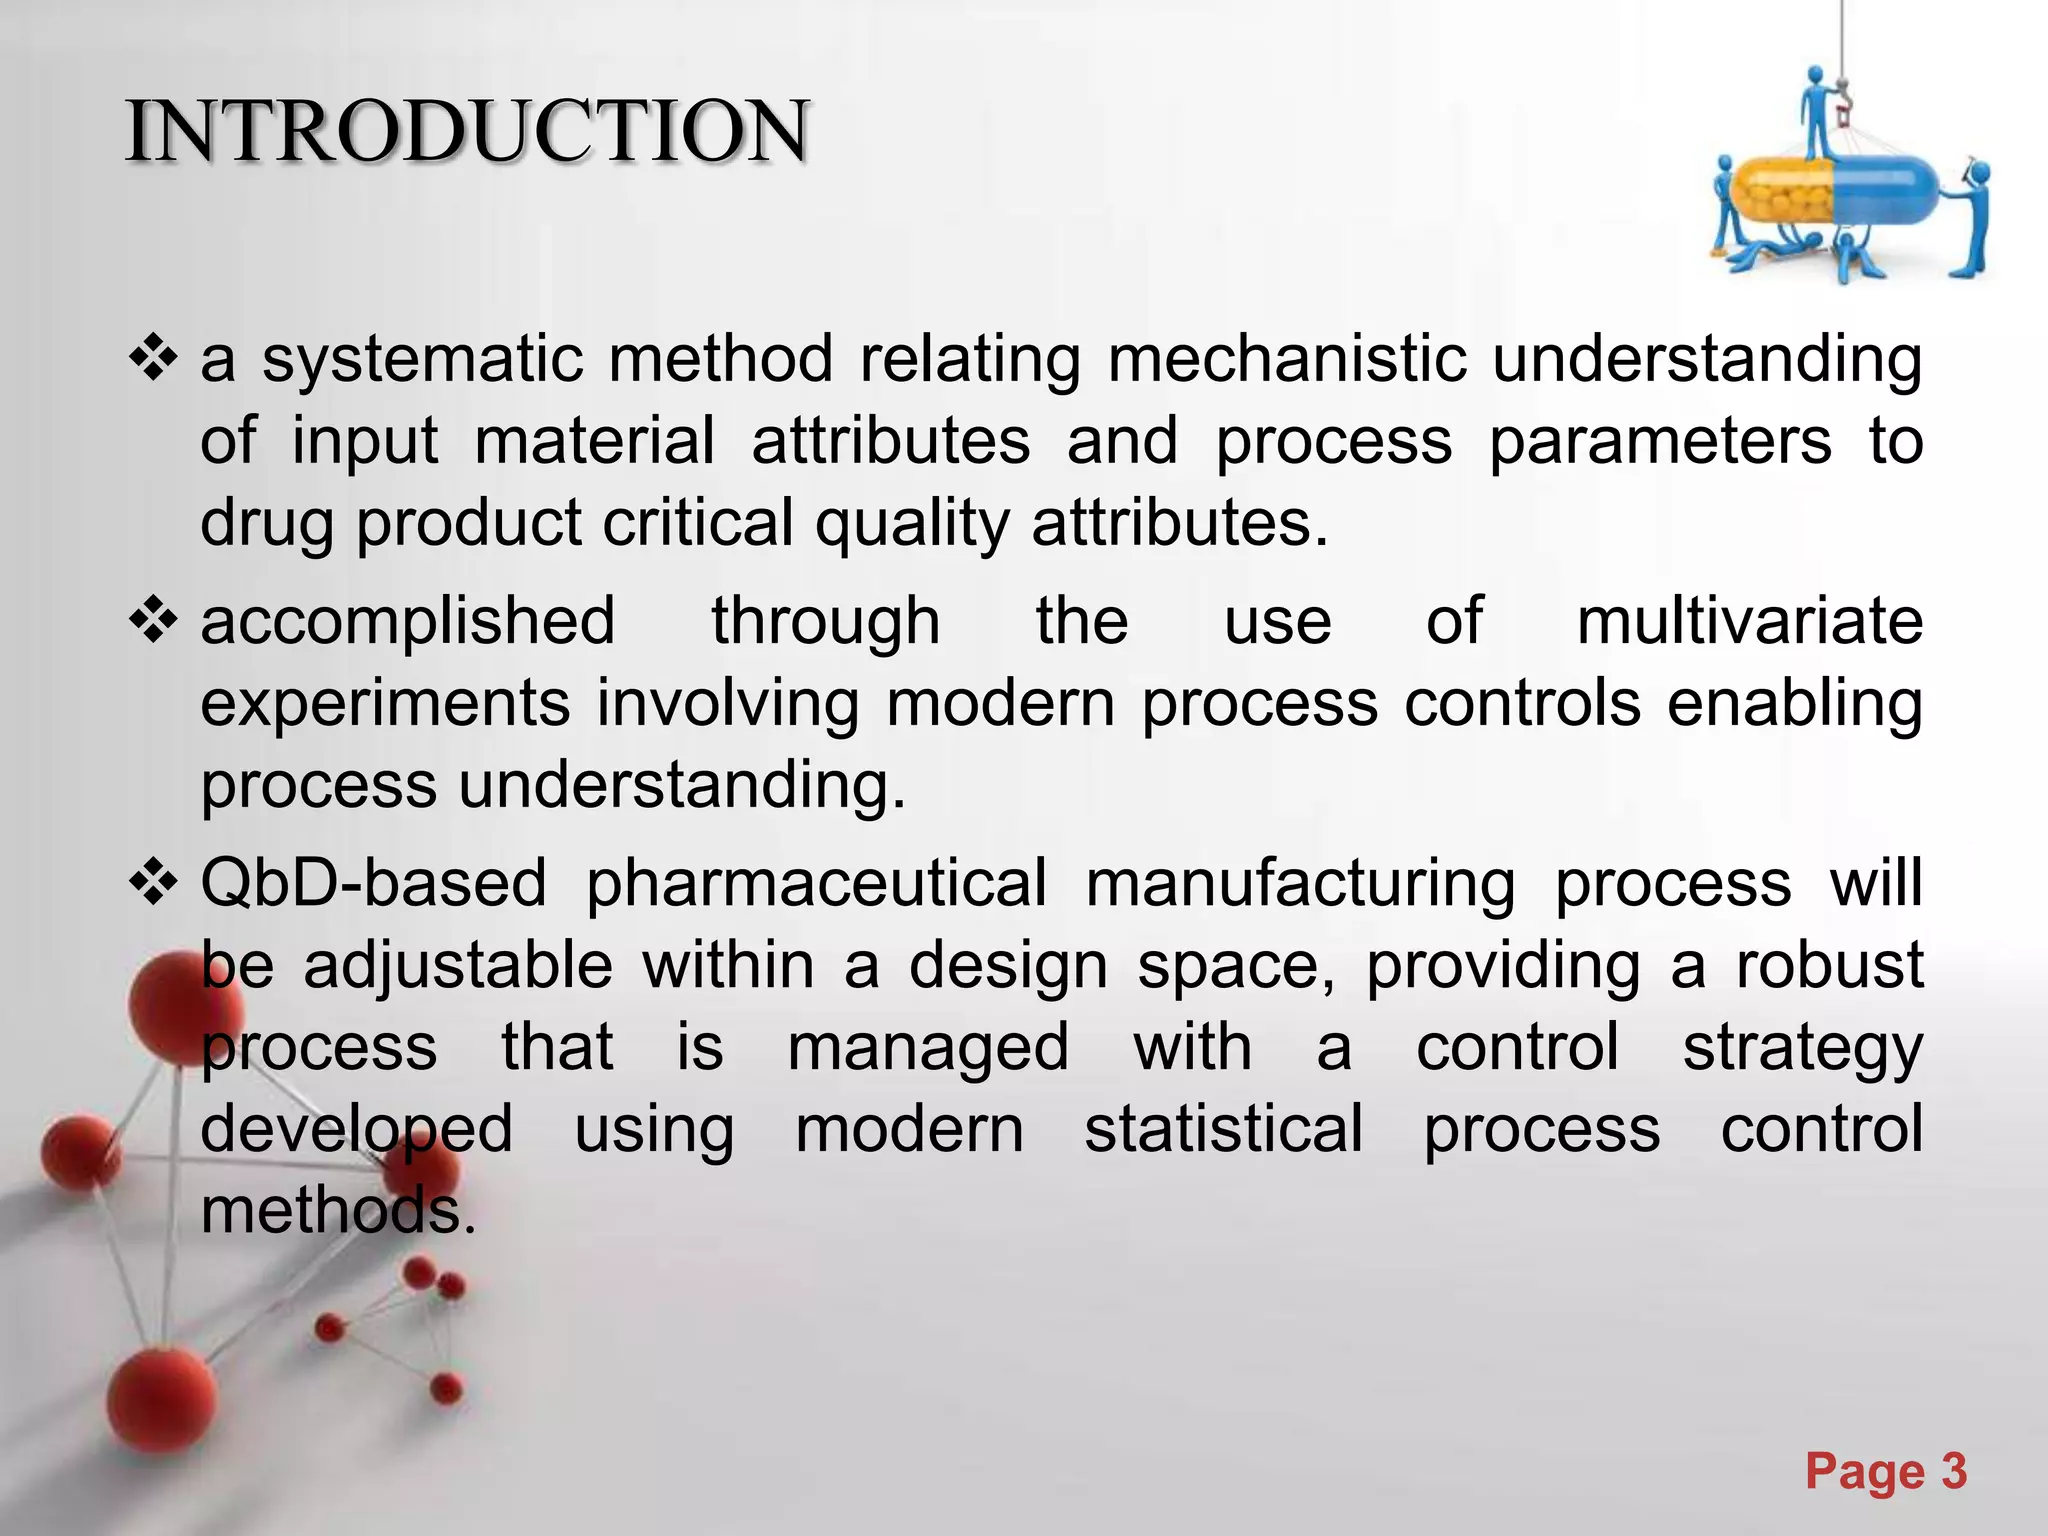
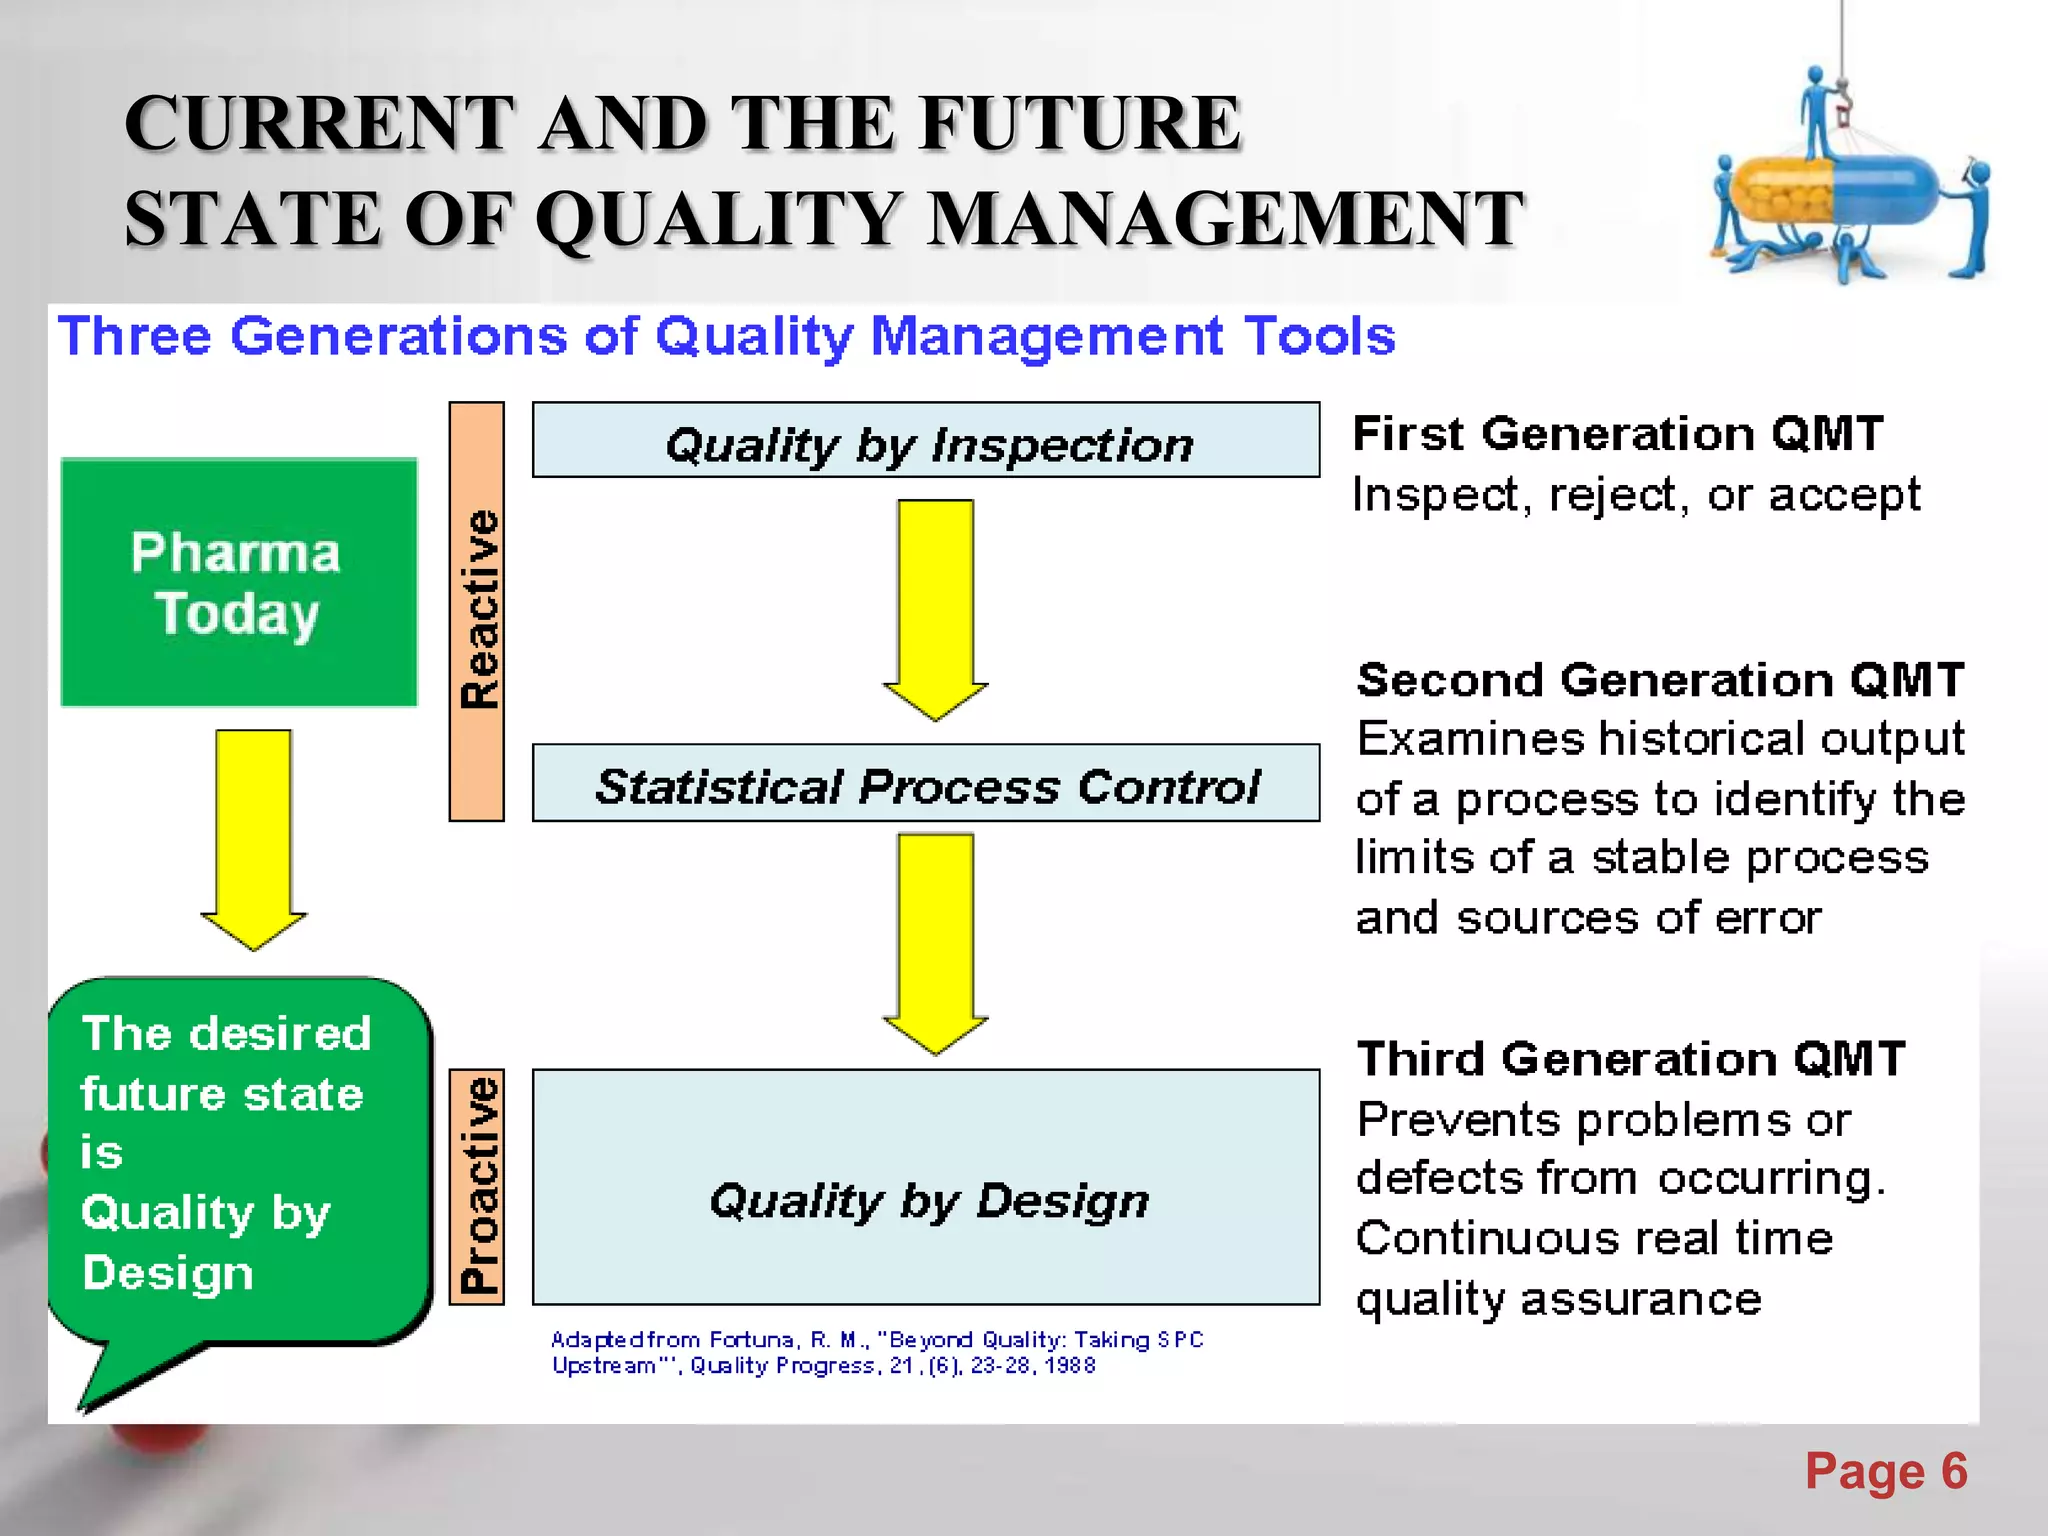
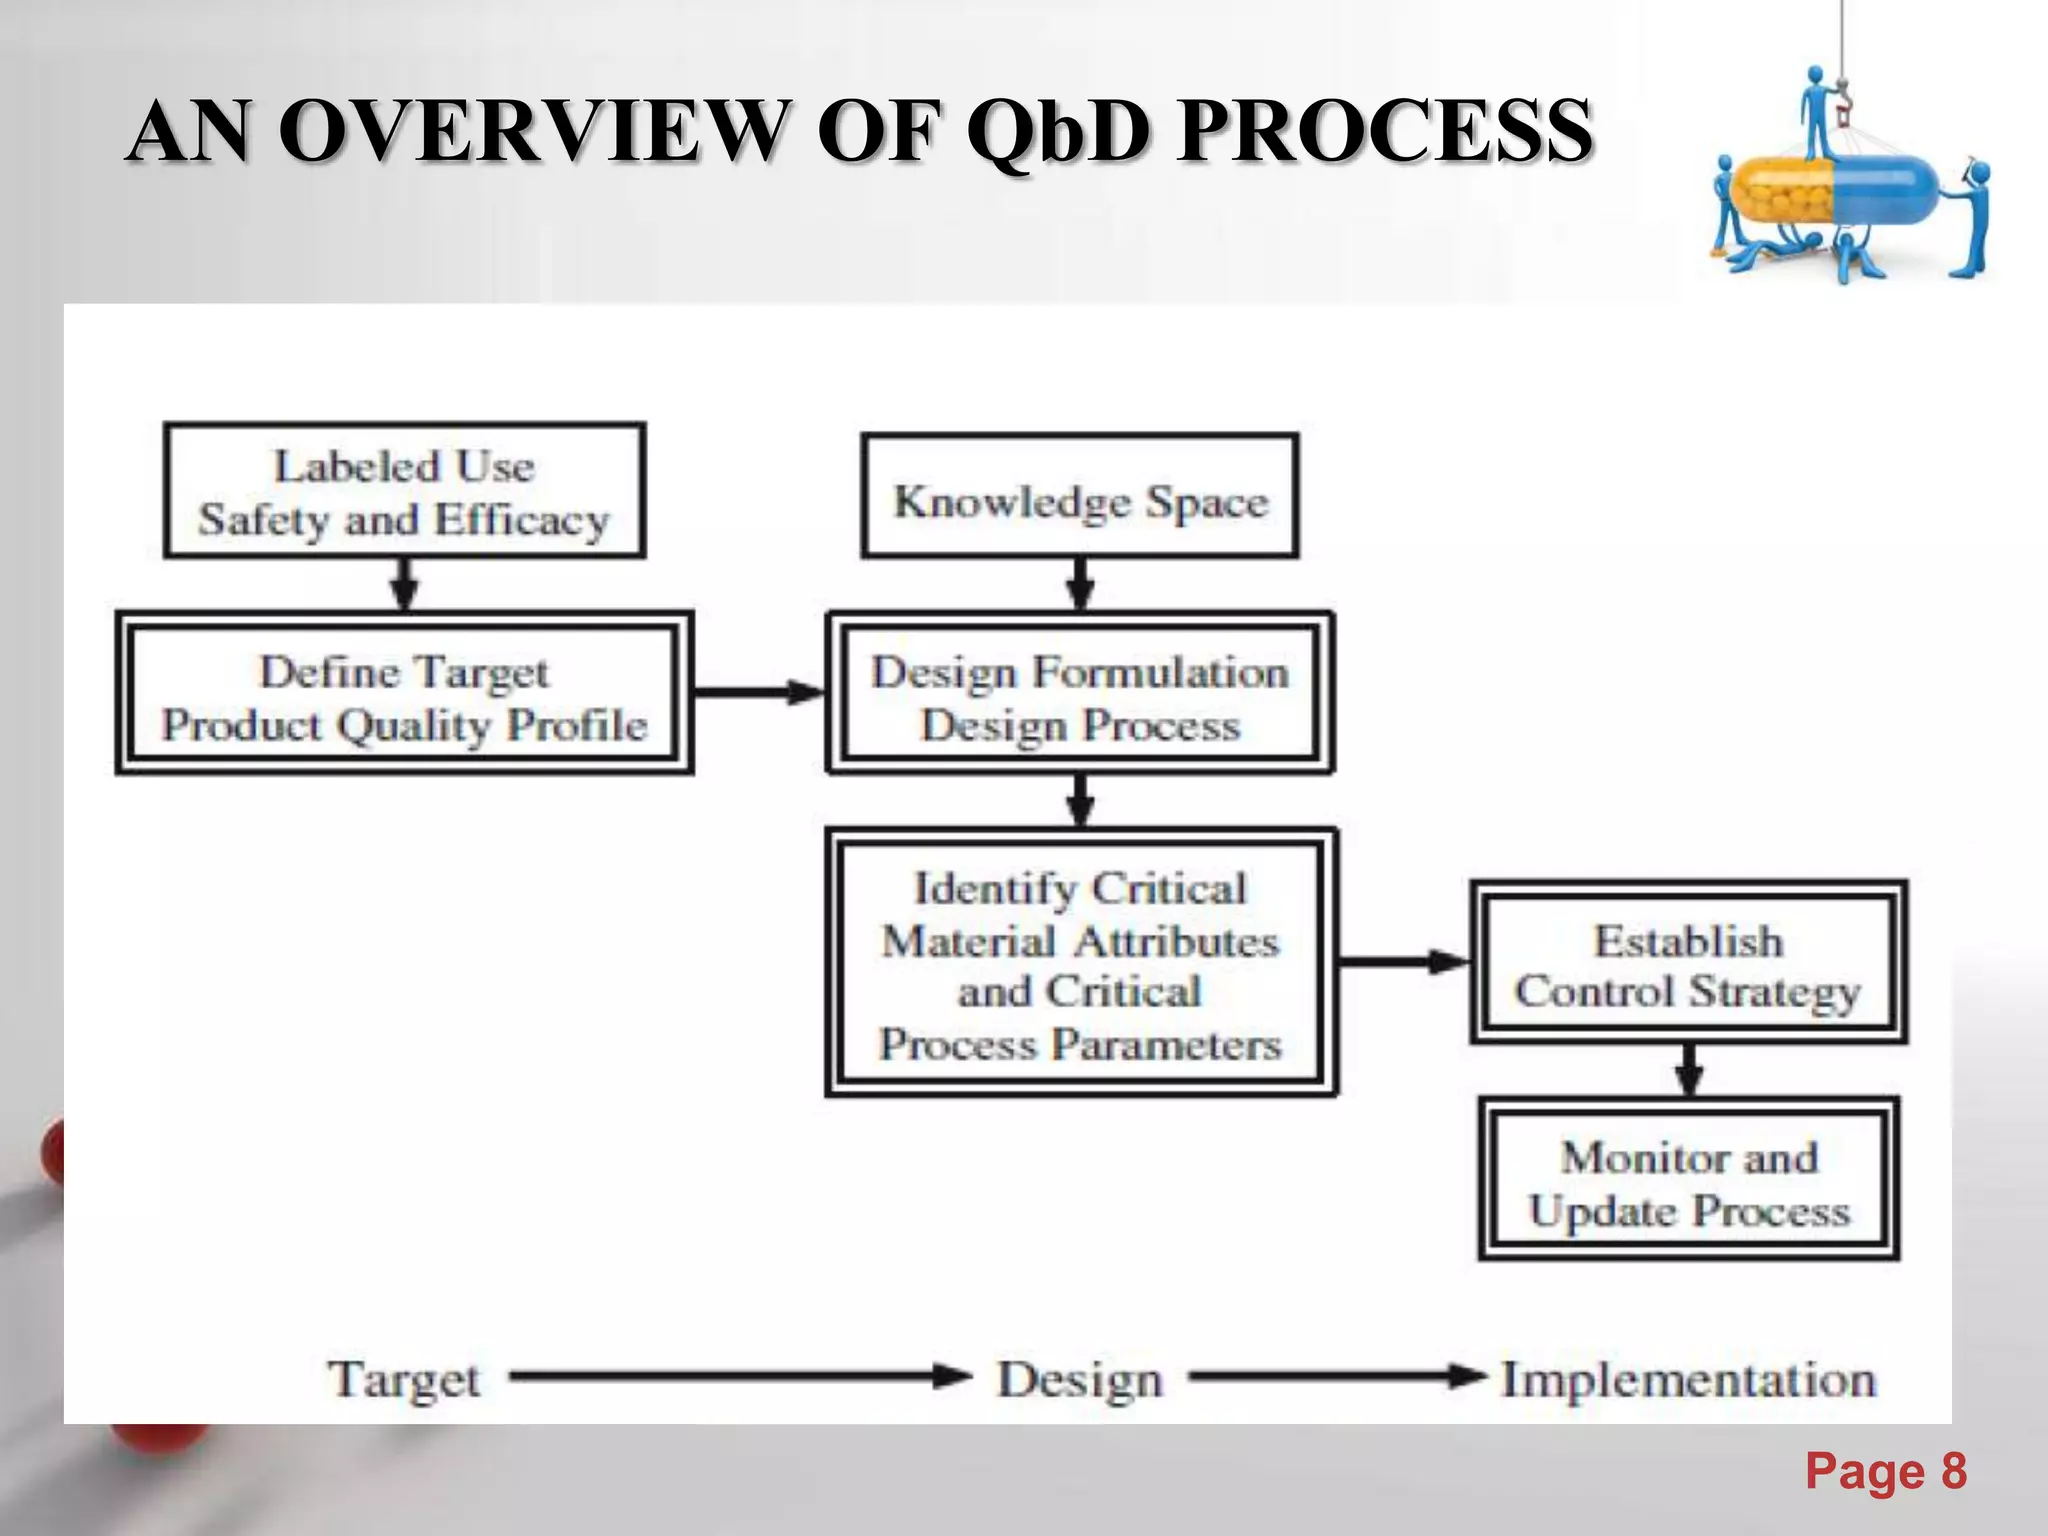
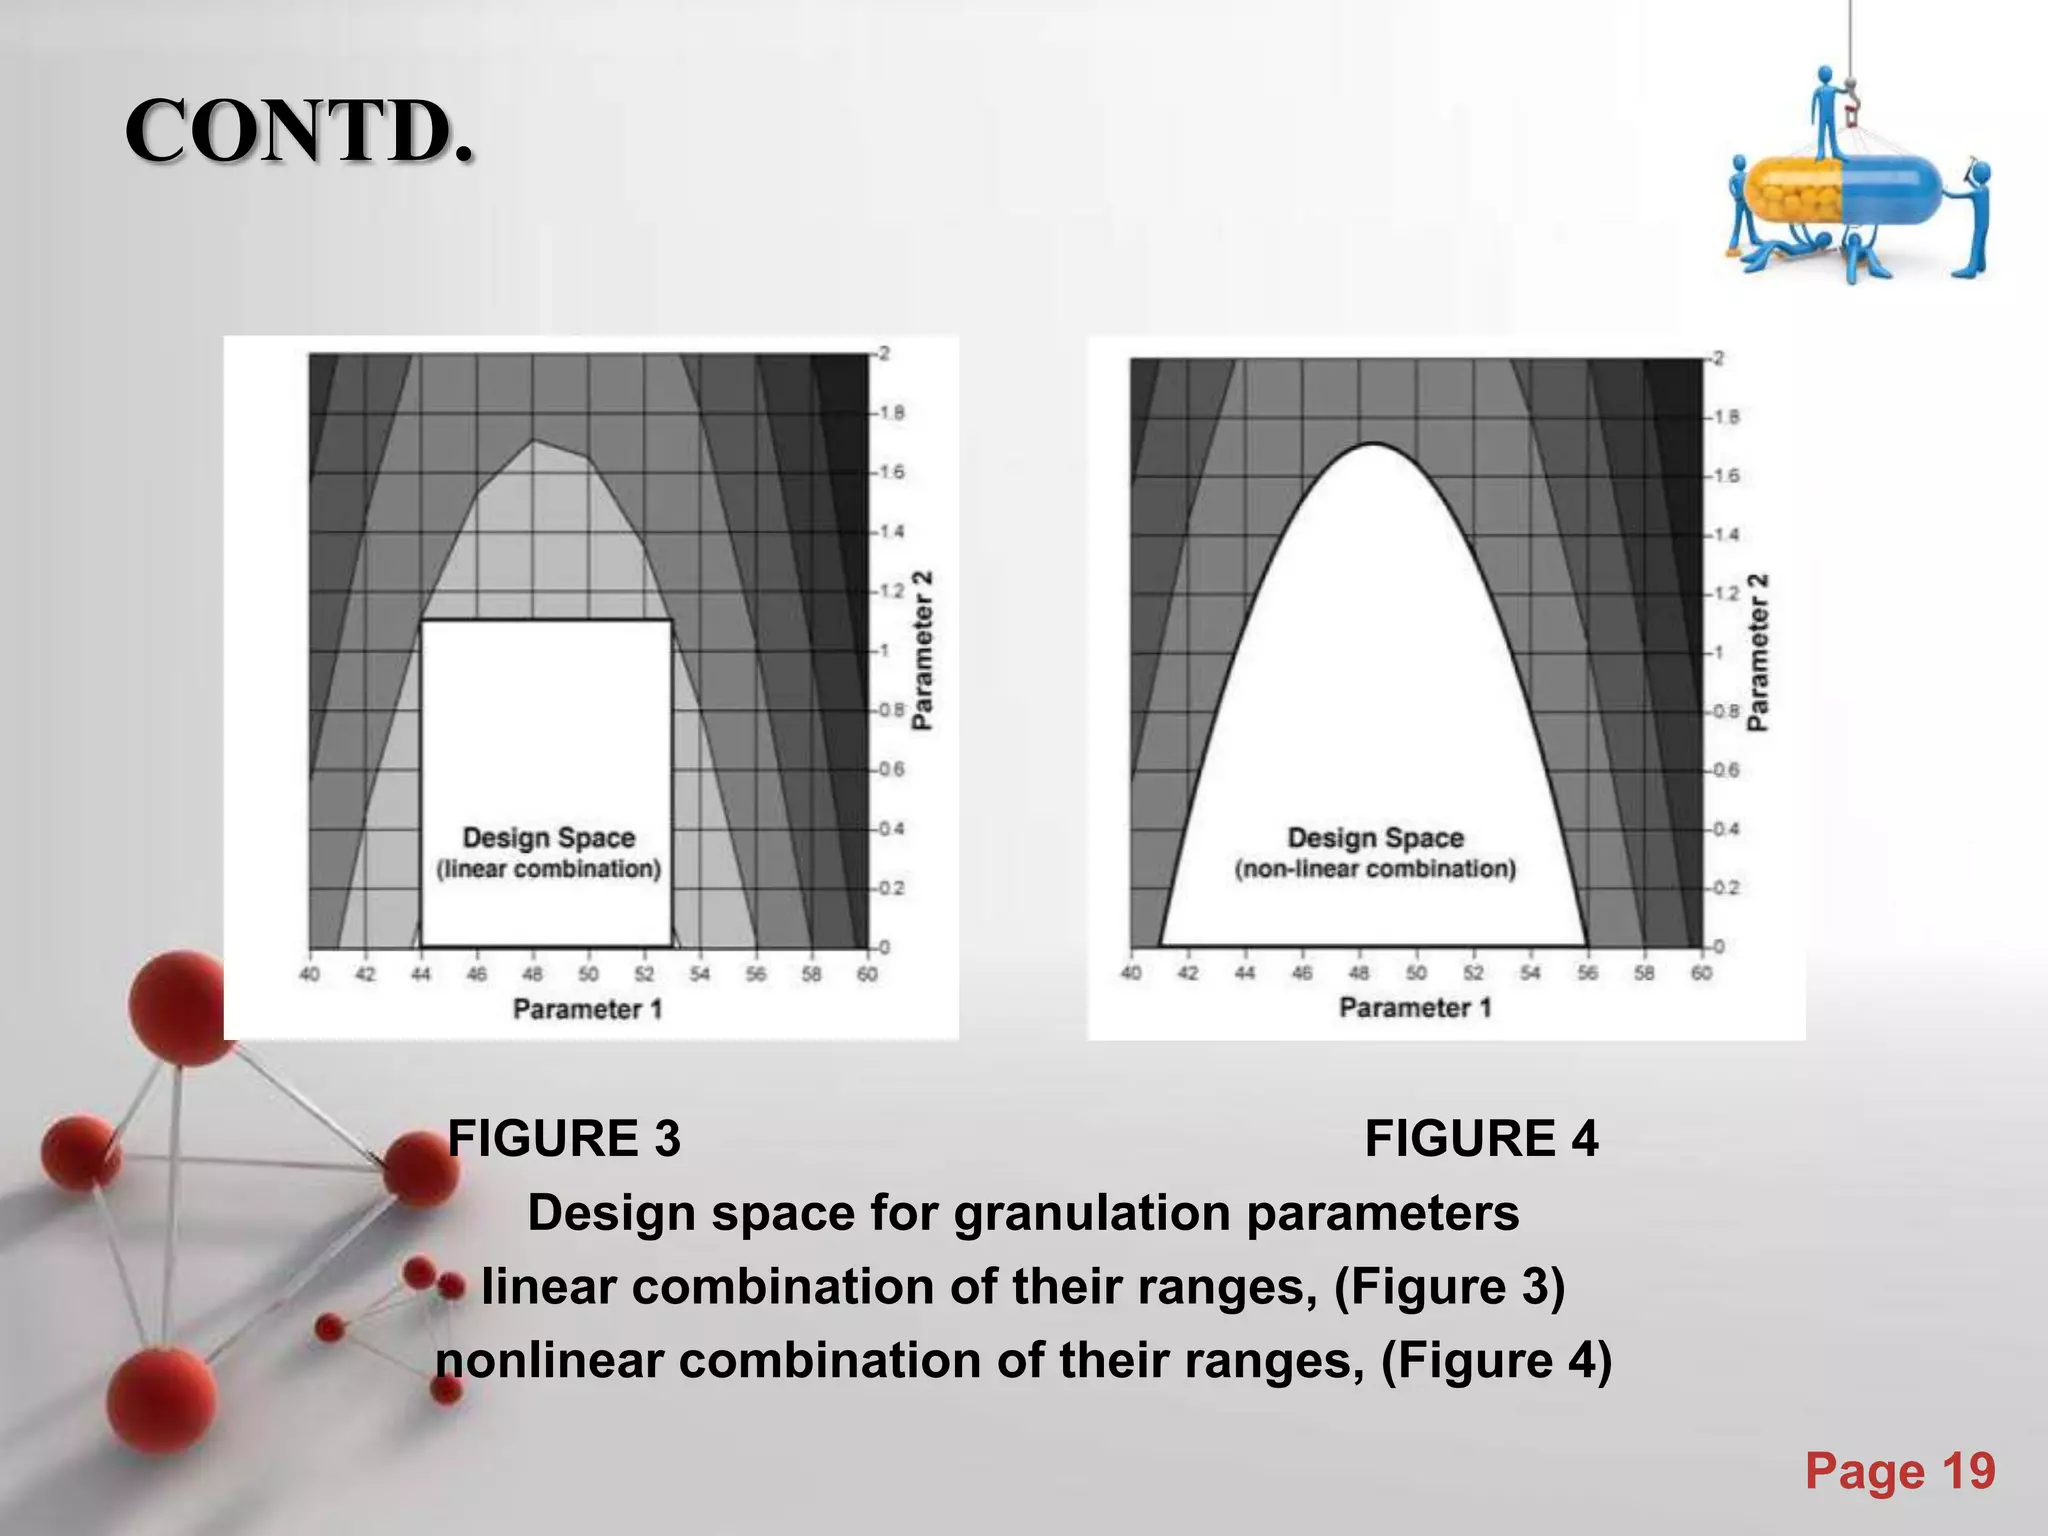
Powerpoint Templates
Page 1
Powerpoint Templates
ROLE OF QUALITY BY DESIGN (QbD)
IN QUALITY ASSURANCE OF
PHARMACEUTICAL PRODUCT
Presented by:
Dimple lodha
M. Pharm, sgsits
Powerpoint Templates
Page 2
CONTENTS
 Introduction
 Definition
 Traditional Pharmaceutical Quality Assessment System
 The Current And The Future State Of Quality Management
 Comparision Of QbD Program With Current Status In QA
 An Overview Of QbD Process
 Steps Of QbD Program In Assuring Quality Of P’ceutical Product
 Quality By Design (QbD) Tools
 Important Computer Software For Optimization
 Potential Benefits From QbD
 Ten Key Challenges For QbD Adoption
 Conclusion
Powerpoint Templates
Page 3
INTRODUCTION
 a systematic method relating mechanistic understanding
of input material attributes and process parameters to
drug product critical quality attributes.
 accomplished through the use of multivariate
experiments involving modern process controls enabling
process understanding.
 QbD-based pharmaceutical manufacturing process will
be adjustable within a design space, providing a robust
process that is managed with a control strategy
developed using modern statistical process control
methods.
Powerpoint Templates
Page 4
DEFINITION
 The International Conference on Harmonization (ICH)
has defined QbD in ICH Q8R as
 “a systematic approach to pharmaceutical development
that begins with predefined objectives and emphasizes
product and process understanding based on sound
science and quality risk management.”
Powerpoint Templates
Page 5
TRADITIONAL PHARMACEUTICAL
QUALITY ASSESSMENT SYSTEM
Conventional Simplified Quality Control Diagram using QbT
Powerpoint Templates
Page 6
CURRENT AND THE FUTURE
STATE OF QUALITY MANAGEMENT
Powerpoint Templates
Page 7
COMPARISION OF QbD PROGRAM
WITH CURRENT STATUS IN QA
Aspect Current state Desired QbD state
Pharmaceutical
development
Empirical; univariate Systematic;
multivariate
Manufacturing
process
validation on three
batches; focus on
reproducibility
Adjustable within
design space; focus
on control strategy
Process control In-process testing PAT utilization
Product specification based on batch data based on product
performance
Control strategy intermediate and end
product testing
Risk-based; real-time
release
Powerpoint Templates
Page 8
AN OVERVIEW OF QbD PROCESS
Powerpoint Templates
Page 9
STEPS OF QbD PROGRAM IN ASSURING
QUALITY OF PHARMACEUTICALS
Control manufacturing processes to produce consistent quality over time
Control strategy Process capability Maintain consistent
quality over time
Identify Critical Quality Attributes, Process Parameters and Sources of
Variability
Design space Source of variability
Design Product and Manufacturing Process
Product design and development Process design and development
Define Target Product Quality Profile
Powerpoint Templates
Page 10
Identifying Target Product Quality
Profile (TPQP)
The target product profile (TPP) has been
defined as a “prospective and dynamic summary
of the quality characteristics of a drug product
that ideally will be achieved to ensure that the
desired quality, and thus the safety and efficacy,
of a drug product is realized”.
Powerpoint Templates
Page 11
CONTD…
Quality target product profile for a lyo vial for sterile injectable
Requirement
Indication Chronic disease (treatment of nervous
breakdown)
Dosage form Lyophilisate for solution for injection
Dosage strength Nominal dose 20mg/vial
Administration route Subcutaneous (0.8ml)
Reconstitution time Not more than 2 min
Solution for reconstitution 1ml 0.9% saline (provided by the pharmacy)
Shelf life Two yr 2–8 ◦C
Drug product requirement Meets pharmacopoeial requirement for
parenteral dosage form as well as product specific requirements
Stability during administration Reconstituted solution is stable for 24 h at
Temperature ≤30 ◦C
Powerpoint Templates
Page 12
Product design and development
Physical properties
Chemical properties
Biopharmaceutical properties
Mechanical properties
Drug-excipient compatibility
Powerpoint Templates
Page 13
Process Design and Development
• Defined as outline of the commercial
manufacturing process. It includes:
Facility
Equipment
material transfer
manufacturing variables
computer-aided process design (CAPD)
process simulation
Powerpoint Templates
Page 14
Identifying CQA and CPP
• Critical Quality Attributes (CQA):
A CQA has been defined as “a physical, chemical,
biological, or microbiological property or characteristic
that should be within an appropriate limit, range, or
distribution to ensure the desired product quality”.
• Critical Process Parameters (CPP):
• Critical process parameters (CPP) are process inputs
that have a direct and significant influence on critical
quality attributes when they are varied within regular
operation range.
•
Powerpoint Templates
Page 15
CONTD.
Example of identification of Process Parameters and Material Attributes
Prior to Pharmaceutical Development
Powerpoint Templates
Page 16
Design Space
 Design Space defines the relationship between Critical
Quality Attributes (CQAs) and Critical Process
Parameters (CPPs), and identifies acceptable operating
ranges for CPPs. It is the region where acceptable
product can be produced.
 Design Space can be considered to be a snap-shot in
time representative of the current process knowledge.
 The Design Space also contains the proven acceptable
ranges (PAR) for CPPs and acceptable values for their
associated CQAs.
Powerpoint Templates
Page 17
CONTD.
• Methods for presenting design space includes:
Graphs (surface-response curves and contour
plots)
Linear combination of parameter ranges
Equations
Models.
Powerpoint Templates
Page 18
CONTD.
FIGURE 1 FIGURE 2
Response graphs for dissolution are depicted as a surface plot (Figure 1)
and a contour plot (Figure 2).
Powerpoint Templates
Page 19
CONTD.
FIGURE 3 FIGURE 4
Design space for granulation parameters
linear combination of their ranges, (Figure 3)
nonlinear combination of their ranges, (Figure 4)
Powerpoint Templates
Page 20
Control strategy
• ICH Q10 defines a control strategy as “a planned set of
controls derived from current product and process
understanding that assures process performance and
product quality. The controls can include parameters and
attributes related to drug substance and drug product
materials and components, facility and equipment
operating conditions, in process controls, finished
product specifications and the associated methods and
frequency of monitoring and control.”
Powerpoint Templates
Page 21
CONTD.
• Different levels of control strategies:
Level 1: Extensive end product testing + Fixed
Critical Process Parameters
Level 2: Reduced end product testing + Flexible
manufacturing process within fixed design space
Level 3: PAT, Real-time automatic“engineering
control” + Flexible manufacturing process
Powerpoint Templates
Page 22
QUALITY BY DESIGN (QbB) TOOLS
Design of Experiment:
Defining objectives of study and planning the
experiment
Screening of factors and factor influence study
Response surface methodology
Formulation and evaluation of DDS
Computer aided modelling and search for an optimum
Validation of DOE methodology
Scale up and implementation
Powerpoint Templates
Page 23
CONTD.
 The input variables, which are directly under the control
of the product development scientist, are known as
independent variables e.g., drug content, polymer
composition, compression force, percentage of
penetration enhancer, hydration volume, agitation speed.
Quantitative variables
Qualitative variables
 The characteristics of the finished drug product or the in-
process material are known as dependent variables
e.g., drug release profile, percent drug entrapment, pellet
size distribution, moisture uptake.
Powerpoint Templates
Page 24
Experimental designs for RSM,
screening, and factor influence studies
• Factorial designs
• Fractional factorial
designs
• Plackett–Burman designs
• Star designs
• Central composite
designs
• Box–Behnken designs
• Equiradial designs
• Mixture designs
• Taguchi designs
• Optimal designs
• Rechtschaffner designs
• Cotter designs
• Center of gravity designs
Powerpoint Templates
Page 25
Product Analytical Technology (PAT)
• A desired goal of the PAT framework is to design and
develop well understood processes that will consistently
ensure a predefined quality at the end of the
manufacturing process.
• Various tools of PAT are as follows:
Multivariate tools for design, data acquisition and
analysis
Process analyzers
Process control tools
Continuous improvement and knowledge
management tools
Powerpoint Templates
Page 26
Risk Assessment
 Risk is defined as the combination of the probability of
occurrence of harm and the severity of that harm.
 Risk Assessment is a “systematic process of organizing
information to support a risk decision to be made within a
riskmanagement process”.
 It consists of the identification of hazards and the
analysis and evaluation of risks associated with
exposure to those hazards.
Powerpoint Templates
Page 27
IMPORTANT COMPUTER
SOFTWARE FOR OPTIMIZATION
 Design Expert
 JMP
 FUSION PRO
 ECHIP
 STATISTICA
 NEMROD
 MODDE
 DOE WISDOM
 XSTAT
 Multisimplex AB
 COMPACT
 Omega
 iSIGHT
 SOLVER
 MATREX
 GRG2
 OPTIMA
Powerpoint Templates
Page 28
POTENTIAL BENEFITS FROM QbD
Quantifiable benefits
• Reduction of COGS and
capital expense.
• Technical development
productivity.
• Improved quality and
lower risk.
• Increased sales
Non Quantifiable Benefits
• Improved public image
• Standardized definitions
• Sharing best practices
• High quality of reviews
and delivery of regulatory
benefits
Powerpoint Templates
Page 29
TEN KEY CHALLENGES FOR QbD
ADOPTION
Challenges occur within
companies
• Internal misalignment
• Lack of belief in business case
• Lack of technology to execute
• Alignment with third parties
Challenges are directly
related to the FDA
• Inconsistency of QbD across
FDA
• Lack of tangible guidance
• Regulators not prepared to
handle
• Does not inspire confidence
• Misalignment of international
regulatory bodies
• Current interaction with
companies is not conducive to
QbD
Powerpoint Templates
Page 30
CONCLUSION
“Quality can not be tested
into
products; it has to be built
In by design”
Joseph M Juran
Powerpoint Templates
Page 31
REFERENCES
 Sandipan Roy in “Quality by design: A holistic concept of building
quality in pharmaceuticals”, June 2012, Int J Pharm Biomed Res,
100-108
 Bhupinder singh, Rahul Batova, Chandra Bhushan Tripathi, Rishi
Kapil in Developing micro/ nano particulate drug delivery system
using “Design of Experiments” Volume I, Issue 2, April 2011,
International Journal of Pharmaceutical Science, 75-87
 Bhat,S.“Quality by design approach to cGMP” 2010.
 Drakulich, A. “Critical challenges to implementing QbD: A Q&A with
FDA”, Pharm. Technol, 2009, 90–94.
 Q8(R1) Pharmaceutical Development Revision 1, 1 -14
 Q8(R2) Pharmaceutical ,August 2009
 Q9 Quality Risk Management, 4 version, November 2005
 Q10 Pharmaceutical Quality System, June 2008
Powerpoint Templates
Page 32

Role of quality by design (qb d) in quality assurance of pharmaceutical product

  • 1.
    Powerpoint Templates Page 1 PowerpointTemplates ROLE OF QUALITY BY DESIGN (QbD) IN QUALITY ASSURANCE OF PHARMACEUTICAL PRODUCT Presented by: Dimple lodha M. Pharm, sgsits
  • 2.
    Powerpoint Templates Page 2 CONTENTS Introduction  Definition  Traditional Pharmaceutical Quality Assessment System  The Current And The Future State Of Quality Management  Comparision Of QbD Program With Current Status In QA  An Overview Of QbD Process  Steps Of QbD Program In Assuring Quality Of P’ceutical Product  Quality By Design (QbD) Tools  Important Computer Software For Optimization  Potential Benefits From QbD  Ten Key Challenges For QbD Adoption  Conclusion
  • 3.
    Powerpoint Templates Page 3 INTRODUCTION a systematic method relating mechanistic understanding of input material attributes and process parameters to drug product critical quality attributes.  accomplished through the use of multivariate experiments involving modern process controls enabling process understanding.  QbD-based pharmaceutical manufacturing process will be adjustable within a design space, providing a robust process that is managed with a control strategy developed using modern statistical process control methods.
  • 4.
    Powerpoint Templates Page 4 DEFINITION The International Conference on Harmonization (ICH) has defined QbD in ICH Q8R as  “a systematic approach to pharmaceutical development that begins with predefined objectives and emphasizes product and process understanding based on sound science and quality risk management.”
  • 5.
    Powerpoint Templates Page 5 TRADITIONALPHARMACEUTICAL QUALITY ASSESSMENT SYSTEM Conventional Simplified Quality Control Diagram using QbT
  • 6.
    Powerpoint Templates Page 6 CURRENTAND THE FUTURE STATE OF QUALITY MANAGEMENT
  • 7.
    Powerpoint Templates Page 7 COMPARISIONOF QbD PROGRAM WITH CURRENT STATUS IN QA Aspect Current state Desired QbD state Pharmaceutical development Empirical; univariate Systematic; multivariate Manufacturing process validation on three batches; focus on reproducibility Adjustable within design space; focus on control strategy Process control In-process testing PAT utilization Product specification based on batch data based on product performance Control strategy intermediate and end product testing Risk-based; real-time release
  • 8.
    Powerpoint Templates Page 8 ANOVERVIEW OF QbD PROCESS
  • 9.
    Powerpoint Templates Page 9 STEPSOF QbD PROGRAM IN ASSURING QUALITY OF PHARMACEUTICALS Control manufacturing processes to produce consistent quality over time Control strategy Process capability Maintain consistent quality over time Identify Critical Quality Attributes, Process Parameters and Sources of Variability Design space Source of variability Design Product and Manufacturing Process Product design and development Process design and development Define Target Product Quality Profile
  • 10.
    Powerpoint Templates Page 10 IdentifyingTarget Product Quality Profile (TPQP) The target product profile (TPP) has been defined as a “prospective and dynamic summary of the quality characteristics of a drug product that ideally will be achieved to ensure that the desired quality, and thus the safety and efficacy, of a drug product is realized”.
  • 11.
    Powerpoint Templates Page 11 CONTD… Qualitytarget product profile for a lyo vial for sterile injectable Requirement Indication Chronic disease (treatment of nervous breakdown) Dosage form Lyophilisate for solution for injection Dosage strength Nominal dose 20mg/vial Administration route Subcutaneous (0.8ml) Reconstitution time Not more than 2 min Solution for reconstitution 1ml 0.9% saline (provided by the pharmacy) Shelf life Two yr 2–8 ◦C Drug product requirement Meets pharmacopoeial requirement for parenteral dosage form as well as product specific requirements Stability during administration Reconstituted solution is stable for 24 h at Temperature ≤30 ◦C
  • 12.
    Powerpoint Templates Page 12 Productdesign and development Physical properties Chemical properties Biopharmaceutical properties Mechanical properties Drug-excipient compatibility
  • 13.
    Powerpoint Templates Page 13 ProcessDesign and Development • Defined as outline of the commercial manufacturing process. It includes: Facility Equipment material transfer manufacturing variables computer-aided process design (CAPD) process simulation
  • 14.
    Powerpoint Templates Page 14 IdentifyingCQA and CPP • Critical Quality Attributes (CQA): A CQA has been defined as “a physical, chemical, biological, or microbiological property or characteristic that should be within an appropriate limit, range, or distribution to ensure the desired product quality”. • Critical Process Parameters (CPP): • Critical process parameters (CPP) are process inputs that have a direct and significant influence on critical quality attributes when they are varied within regular operation range. •
  • 15.
    Powerpoint Templates Page 15 CONTD. Exampleof identification of Process Parameters and Material Attributes Prior to Pharmaceutical Development
  • 16.
    Powerpoint Templates Page 16 DesignSpace  Design Space defines the relationship between Critical Quality Attributes (CQAs) and Critical Process Parameters (CPPs), and identifies acceptable operating ranges for CPPs. It is the region where acceptable product can be produced.  Design Space can be considered to be a snap-shot in time representative of the current process knowledge.  The Design Space also contains the proven acceptable ranges (PAR) for CPPs and acceptable values for their associated CQAs.
  • 17.
    Powerpoint Templates Page 17 CONTD. •Methods for presenting design space includes: Graphs (surface-response curves and contour plots) Linear combination of parameter ranges Equations Models.
  • 18.
    Powerpoint Templates Page 18 CONTD. FIGURE1 FIGURE 2 Response graphs for dissolution are depicted as a surface plot (Figure 1) and a contour plot (Figure 2).
  • 19.
    Powerpoint Templates Page 19 CONTD. FIGURE3 FIGURE 4 Design space for granulation parameters linear combination of their ranges, (Figure 3) nonlinear combination of their ranges, (Figure 4)
  • 20.
    Powerpoint Templates Page 20 Controlstrategy • ICH Q10 defines a control strategy as “a planned set of controls derived from current product and process understanding that assures process performance and product quality. The controls can include parameters and attributes related to drug substance and drug product materials and components, facility and equipment operating conditions, in process controls, finished product specifications and the associated methods and frequency of monitoring and control.”
  • 21.
    Powerpoint Templates Page 21 CONTD. •Different levels of control strategies: Level 1: Extensive end product testing + Fixed Critical Process Parameters Level 2: Reduced end product testing + Flexible manufacturing process within fixed design space Level 3: PAT, Real-time automatic“engineering control” + Flexible manufacturing process
  • 22.
    Powerpoint Templates Page 22 QUALITYBY DESIGN (QbB) TOOLS Design of Experiment: Defining objectives of study and planning the experiment Screening of factors and factor influence study Response surface methodology Formulation and evaluation of DDS Computer aided modelling and search for an optimum Validation of DOE methodology Scale up and implementation
  • 23.
    Powerpoint Templates Page 23 CONTD. The input variables, which are directly under the control of the product development scientist, are known as independent variables e.g., drug content, polymer composition, compression force, percentage of penetration enhancer, hydration volume, agitation speed. Quantitative variables Qualitative variables  The characteristics of the finished drug product or the in- process material are known as dependent variables e.g., drug release profile, percent drug entrapment, pellet size distribution, moisture uptake.
  • 24.
    Powerpoint Templates Page 24 Experimentaldesigns for RSM, screening, and factor influence studies • Factorial designs • Fractional factorial designs • Plackett–Burman designs • Star designs • Central composite designs • Box–Behnken designs • Equiradial designs • Mixture designs • Taguchi designs • Optimal designs • Rechtschaffner designs • Cotter designs • Center of gravity designs
  • 25.
    Powerpoint Templates Page 25 ProductAnalytical Technology (PAT) • A desired goal of the PAT framework is to design and develop well understood processes that will consistently ensure a predefined quality at the end of the manufacturing process. • Various tools of PAT are as follows: Multivariate tools for design, data acquisition and analysis Process analyzers Process control tools Continuous improvement and knowledge management tools
  • 26.
    Powerpoint Templates Page 26 RiskAssessment  Risk is defined as the combination of the probability of occurrence of harm and the severity of that harm.  Risk Assessment is a “systematic process of organizing information to support a risk decision to be made within a riskmanagement process”.  It consists of the identification of hazards and the analysis and evaluation of risks associated with exposure to those hazards.
  • 27.
    Powerpoint Templates Page 27 IMPORTANTCOMPUTER SOFTWARE FOR OPTIMIZATION  Design Expert  JMP  FUSION PRO  ECHIP  STATISTICA  NEMROD  MODDE  DOE WISDOM  XSTAT  Multisimplex AB  COMPACT  Omega  iSIGHT  SOLVER  MATREX  GRG2  OPTIMA
  • 28.
    Powerpoint Templates Page 28 POTENTIALBENEFITS FROM QbD Quantifiable benefits • Reduction of COGS and capital expense. • Technical development productivity. • Improved quality and lower risk. • Increased sales Non Quantifiable Benefits • Improved public image • Standardized definitions • Sharing best practices • High quality of reviews and delivery of regulatory benefits
  • 29.
    Powerpoint Templates Page 29 TENKEY CHALLENGES FOR QbD ADOPTION Challenges occur within companies • Internal misalignment • Lack of belief in business case • Lack of technology to execute • Alignment with third parties Challenges are directly related to the FDA • Inconsistency of QbD across FDA • Lack of tangible guidance • Regulators not prepared to handle • Does not inspire confidence • Misalignment of international regulatory bodies • Current interaction with companies is not conducive to QbD
  • 30.
    Powerpoint Templates Page 30 CONCLUSION “Qualitycan not be tested into products; it has to be built In by design” Joseph M Juran
  • 31.
    Powerpoint Templates Page 31 REFERENCES Sandipan Roy in “Quality by design: A holistic concept of building quality in pharmaceuticals”, June 2012, Int J Pharm Biomed Res, 100-108  Bhupinder singh, Rahul Batova, Chandra Bhushan Tripathi, Rishi Kapil in Developing micro/ nano particulate drug delivery system using “Design of Experiments” Volume I, Issue 2, April 2011, International Journal of Pharmaceutical Science, 75-87  Bhat,S.“Quality by design approach to cGMP” 2010.  Drakulich, A. “Critical challenges to implementing QbD: A Q&A with FDA”, Pharm. Technol, 2009, 90–94.  Q8(R1) Pharmaceutical Development Revision 1, 1 -14  Q8(R2) Pharmaceutical ,August 2009  Q9 Quality Risk Management, 4 version, November 2005  Q10 Pharmaceutical Quality System, June 2008
  • 32.