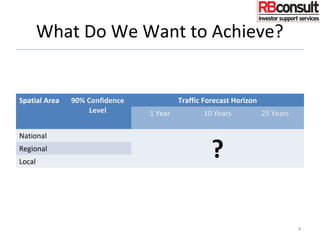
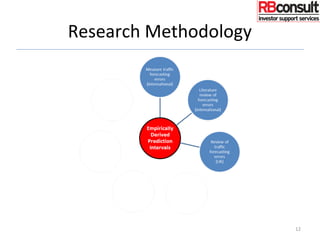
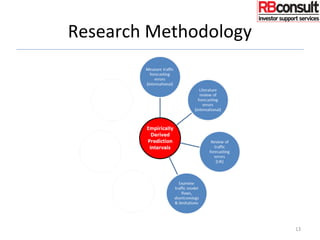
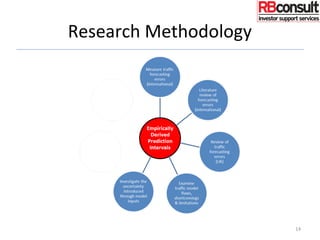
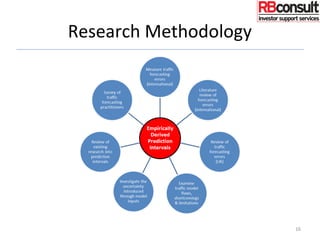
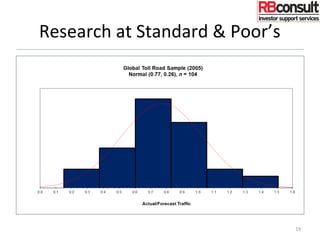
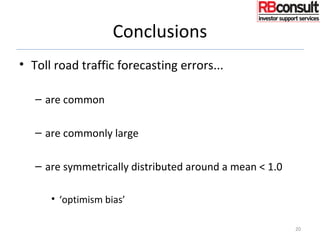
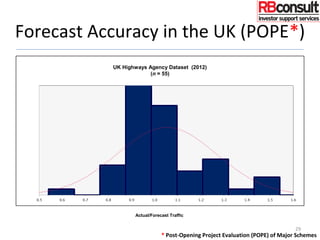
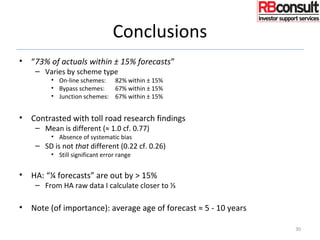
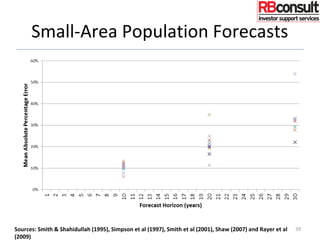
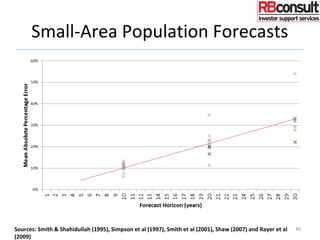
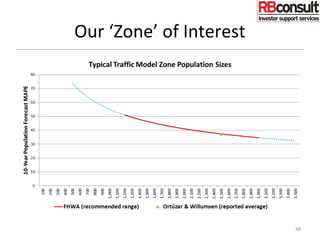
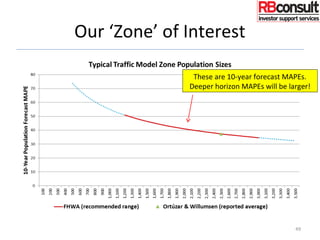
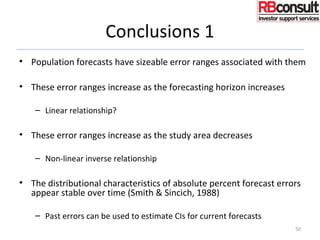
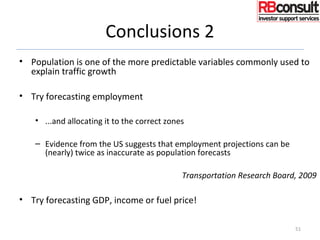
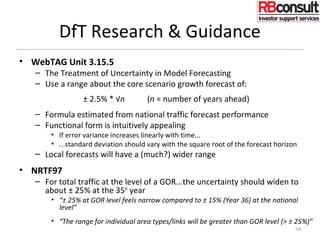
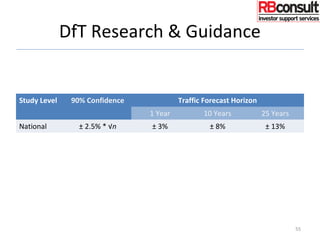
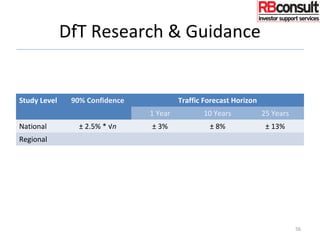
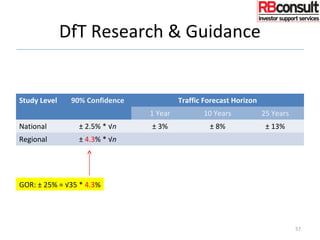
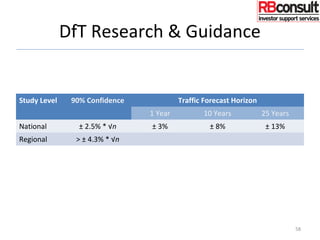
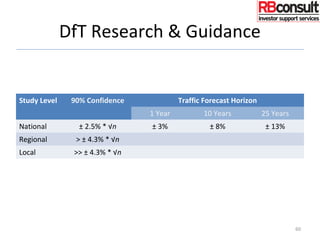
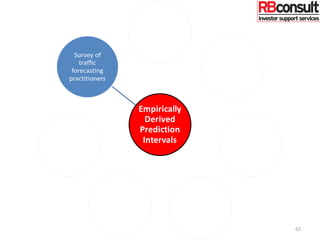
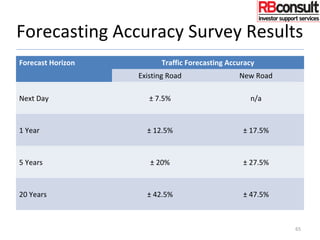
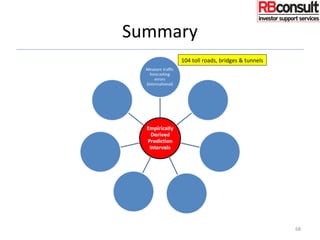
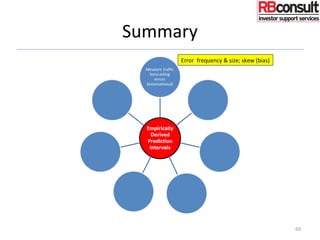
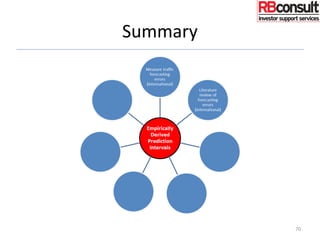
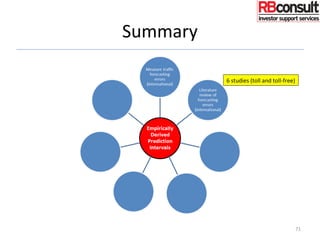
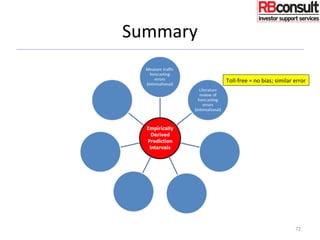
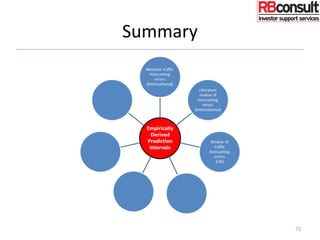
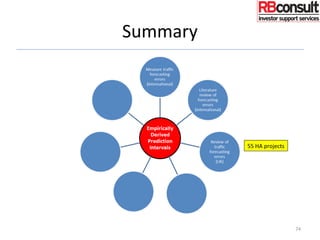
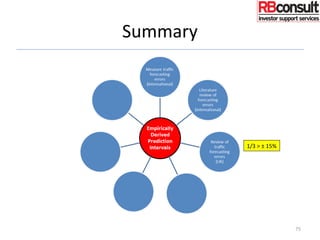
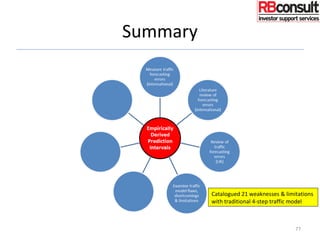
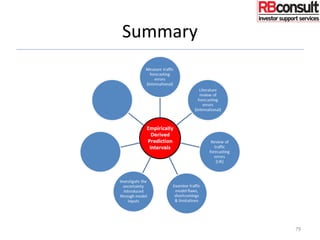
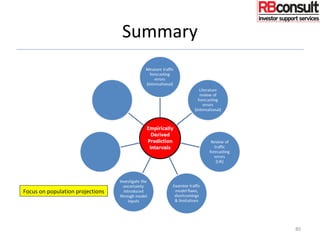
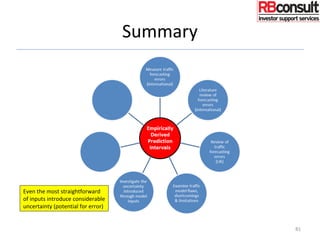
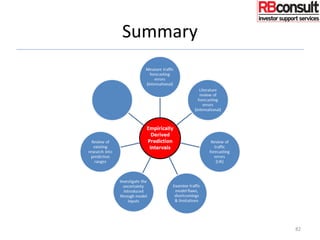
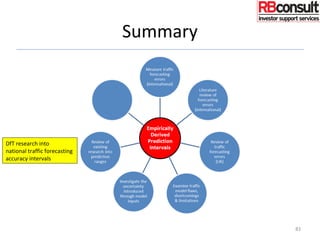
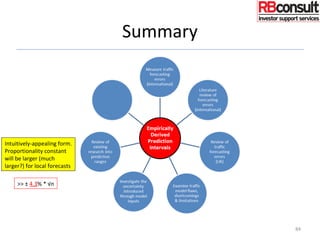
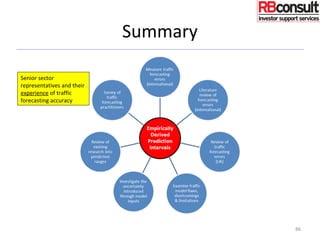
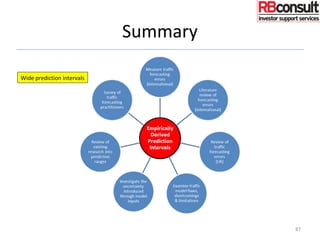
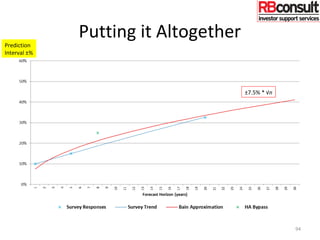
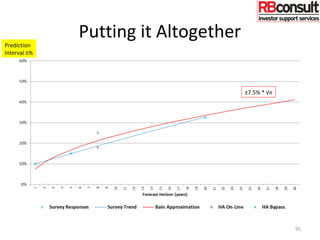
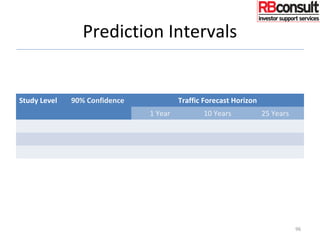
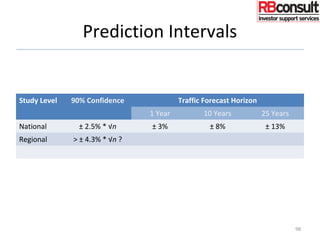
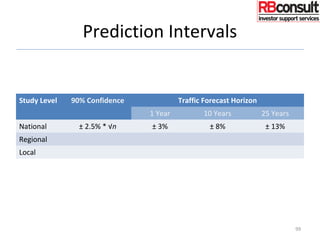
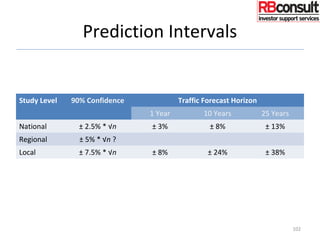
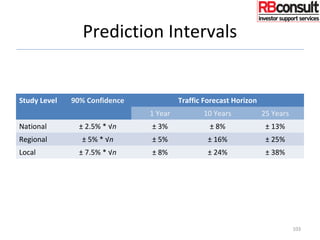
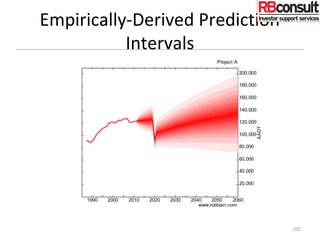
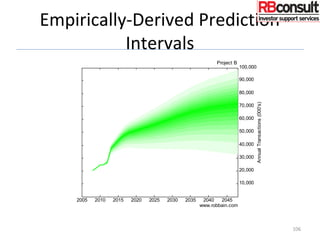
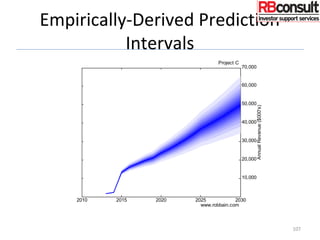
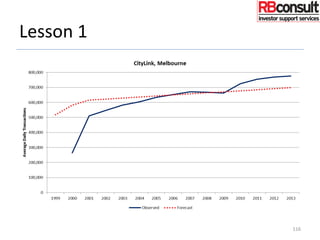
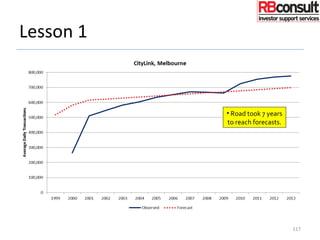
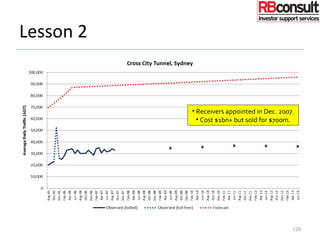
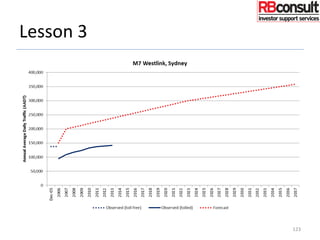
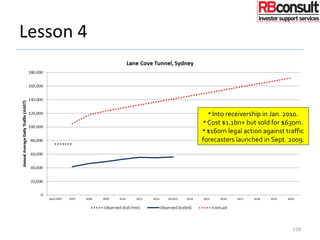
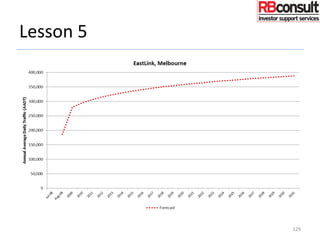
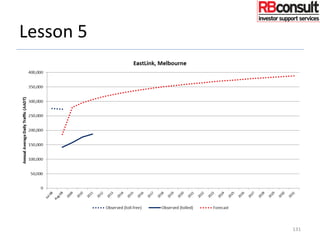
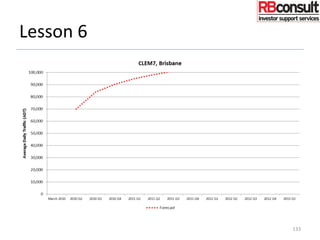
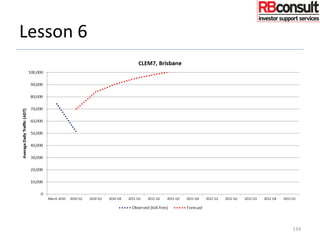
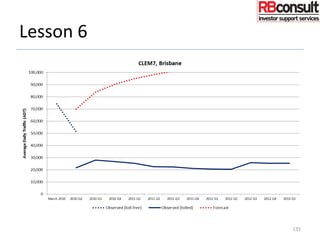
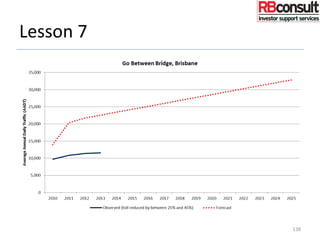
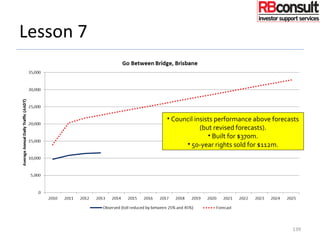
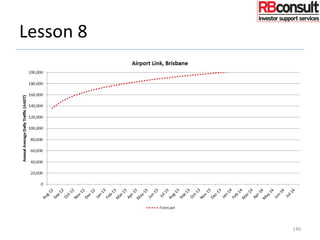
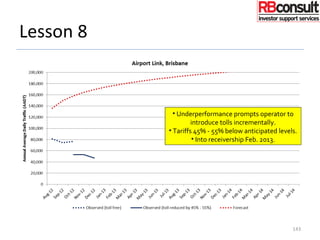
Error & Optimism Bias
in Toll Road Traffic Forecasts
Robert Bain
RBconsult | University of Leeds
PERTH Western Australia 11 August 2015
Alternatively…
The Challenge of Predictive Unreliability
2
What Do We Want to Achieve?
3
What Do We Want to Achieve?
Spatial Area 90% Confidence
Level
Traffic Forecast Horizon
1 Year 10 Years 25 Years
National
?Regional
Local
4
A Little Reminder
5
DMRB 1996
(none of this is new!)
A Little Reminder
6
DMRB 1996
None of this is new!
A Focus on Prediction Intervals
• Travel demand forecasts have prediction intervals
1. What do these prediction intervals look like?
2. What does empirical evidence tell us?
7
An estimate of an interval in which future observations will fall,
with a certain probability,
given what has already been observed.
A Focus on Prediction Intervals
• Travel demand forecasts have prediction intervals
1. What do these prediction intervals look like?
2. What does empirical evidence tell us?
8
An estimate of an interval in which future observations will fall,
with a certain probability,
given what has already been observed.
Research Methodology
9
Research Methodology
10
Research Methodology
11
Research Methodology
12
Research Methodology
13
Research Methodology
14
Research Methodology
15
Research Methodology
16
17
18
Research at Standard & Poor’s
19
Conclusions
• Toll road traffic forecasting errors...
– are common
– are commonly large
– are symmetrically distributed around a mean < 1.0
• ‘optimism bias’
20
21
22
Literature Review
• JP Morgan (1997)
– 14 new toll roads in the US
– Only 1 exceeded its revenue prediction
– 3 missed the mark by 25%
– For 4, revenue was less than 30% of forecast
• Flyvbjerg et al (2005)
– 183 tolled and non-tolled roads
– For ½, difference between actual and forecast was ± 20%
– For ¼, difference was over ± 40%
– No improvement in accuracy over 30 years
23
Literature Review
• US Transportation Research Board (2006)
– 26 toll highways in the US
– “Most of the results demonstrate an underperformance”
– “Even with the availability of updated forecasts, only a small number
of projections are within 10% of the actual revenues”
• Vassallo (2007)
– 14 toll roads in Spain
– “On average, actual traffic was substantially overestimated (by
approximately 35%)”
24
Literature Review
• Li & Hensher (2009)
– Toll roads, bridges and tunnels in Australia
– “On average, the actual traffic level of these five toll roads*
is 45 percent lower than predicted”
• Bain (2009)
– 27 toll roads for the European Investment Bank
– Sample included some ‘shadow’ toll roads
– Accuracy range: -67% to +32%
– Clear evidence of error and skew (bias)
25
* The M2, M7, Cross City Tunnel, Lane Cove Tunnel & EastLink
Conclusions
• Toll road traffic forecasting errors...
– are common
– are commonly large
– are symmetrically distributed, but around a mean < 1.0
• ‘optimism bias’
• From Bain, 2009 (weak) and Flyvbjerg et al, 2005 (strong)
– Toll and toll-free roads differ
• In terms of bias (tendency for over-forecasting)
– Toll and toll-free roads are similar
• In terms of error (size of standard deviation)
26
27
28
Forecast Accuracy in the UK (POPE*)
UK Highways Agency Dataset (2012)
(n = 55)
Actual/Forecast Traffic
* Post-Opening Project Evaluation (POPE) of Major Schemes
29
Conclusions
• “73% of actuals within ± 15% forecasts”
– Varies by scheme type
• On-line schemes: 82% within ± 15%
• Bypass schemes: 67% within ± 15%
• Junction schemes: 67% within ± 15%
• Contrasted with toll road research findings
– Mean is different (≈ 1.0 cf. 0.77)
• Absence of systematic bias
– SD is not that different (0.22 cf. 0.26)
• Still significant error range
• HA: “¼ forecasts” are out by > 15%
– From HA raw data I calculate closer to ⅓
• Note (of importance): average age of forecast ≈ 5 - 10 years
30
31
32
Summary
• Compiled inventory of traditional (4-step) model short-comings, flaws
and limitations
– Many technical, detailed and mode-specific:
– Simplified assumptions about human behaviour
– Simplified assumptions about transport supply
– Other assumptions adopted for computational convenience
33
Models - irrespective of mathematical sophistication - remain
crude and imperfect representations
of complex and dynamic interactions
between transport demand and supply
Let’s Pretend...
• Let’s pretend that transport demand models are perfect
– Complete and correct in terms of design, architecture,
specification (explanatory variables & inter-relationships) etc.
– 100% accurate in terms of data used to construct and
estimate the base-year model
• In forecasting mode we need other inputs
– Forecasts of the explanatory (growth) variables themselves
34
35
36
Forecasting Inputs
• Forecasts of population are a key input for many
(most?) transport demand models
• Population forecasting should be relatively easy
– We know the population today
– There is a limited set of influences
• Births
• Deaths
• Migration 37
Small-Area Population Forecasts
38
Small-Area Population Forecasts
Sources: Smith & Shahidullah (1995), Simpson et al (1997), Smith et al (2001), Shaw (2007) and Rayer et al
(2009)
39
Small-Area Population Forecasts
Sources: Smith & Shahidullah (1995), Simpson et al (1997), Smith et al (2001), Shaw (2007) and Rayer et al
(2009)
40
US Small Areas ≈ Counties
41
US Counties Are Actually Quite Large
• Average counties/state = 62
• Average population/county = 146,850
• But traffic modelling zones:
– Populations of around 1,000 - 3,000
– 70+
times smaller
42
US Counties Are Actually Quite Large
• Average counties/state = 62
• Average population/county = 146,850
• But traffic modelling zones:
– Populations of around 1,000 - 3,000
– 70+
times smaller
43
Predictive Error v Sample Size
44
Predictive Error v Sample Size
Tayman et al (1998)
45
Consistent Research Results
Authors 10-Year MAPEs for Different Population Sizes
2,500-4,999 5,000 5,000-7,500 35,000 25,000-100,000
Tayman et
al
30.6 27.9 26.1 11.5 10.5 - 12.4
Others 26.8 1
27.9 2
19.1 2
11.0 1
10.2 3
1.
2.
3.
Smith & Shahidullah (1995)
Murdock et al (1984)
Isserman (1977)
46
Our ‘Zone’ of Interest
47
Our ‘Zone’ of Interest
48
Our ‘Zone’ of Interest
These are 10-year forecast MAPEs.
Deeper horizon MAPEs will be larger!
49
Conclusions 1
• Population forecasts have sizeable error ranges associated with them
• These error ranges increase as the forecasting horizon increases
– Linear relationship?
• These error ranges increase as the study area decreases
– Non-linear inverse relationship
• The distributional characteristics of absolute percent forecast errors
appear stable over time (Smith & Sincich, 1988)
– Past errors can be used to estimate CIs for current forecasts
50
Conclusions 2
• Population is one of the more predictable variables commonly used to
explain traffic growth
• Try forecasting employment
• ...and allocating it to the correct zones
– Evidence from the US suggests that employment projections can be
(nearly) twice as inaccurate as population forecasts
Transportation Research Board, 2009
• Try forecasting GDP, income or fuel price!
51
52
53
DfT Research & Guidance
• WebTAG Unit 3.15.5
– The Treatment of Uncertainty in Model Forecasting
– Use a range about the core scenario growth forecast of:
± 2.5% * √n (n = number of years ahead)
– Formula estimated from national traffic forecast performance
– Functional form is intuitively appealing
• If error variance increases linearly with time...
• ...standard deviation should vary with the square root of the forecast horizon
– Local forecasts will have a (much?) wider range
• NRTF97
– For total traffic at the level of a GOR...the uncertainty should widen to
about ± 25% at the 35th
year
• “± 25% at GOR level feels narrow compared to ± 15% (Year 36) at the national
level”
• “The range for individual area types/links will be greater than GOR level (> ± 25%)”
54
DfT Research & Guidance
Study Level 90% Confidence Traffic Forecast Horizon
1 Year 10 Years 25 Years
National ± 2.5% * √n ± 3% ± 8% ± 13%
55
DfT Research & Guidance
Study Level 90% Confidence Traffic Forecast Horizon
1 Year 10 Years 25 Years
National ± 2.5% * √n ± 3% ± 8% ± 13%
Regional
56
DfT Research & Guidance
Study Level 90% Confidence Traffic Forecast Horizon
1 Year 10 Years 25 Years
National ± 2.5% * √n ± 3% ± 8% ± 13%
Regional ± 4.3% * √n
57
GOR: ± 25% = √35 * 4.3%
DfT Research & Guidance
Study Level 90% Confidence Traffic Forecast Horizon
1 Year 10 Years 25 Years
National ± 2.5% * √n ± 3% ± 8% ± 13%
Regional > ± 4.3% * √n
58
DfT Research & Guidance
Study Level 90% Confidence Traffic Forecast Horizon
1 Year 10 Years 25 Years
National ± 2.5% * √n ± 3% ± 8% ± 13%
Regional > ± 4.3% * √n
Local ?
59
DfT Research & Guidance
Study Level 90% Confidence Traffic Forecast Horizon
1 Year 10 Years 25 Years
National ± 2.5% * √n ± 3% ± 8% ± 13%
Regional > ± 4.3% * √n
Local >> ± 4.3% * √n
60
61
62
Traffic Forecasting Accuracy Survey
Survey Respondents:
• International responses (11 countries)
• Consultants/modelling practitioners
– President
– Managing director
– Director of transport planning
• Government officials
– Transport modelling manager
– Senior transport & economics advisor
– Traffic & toll modelling manager
• Academics/researchers
– 4 professors
• Including one of the authors of ‘Modelling Transport’
– Senior lecturers
– Deputy director, centre for transport studies
63
Forecasting Accuracy Survey Results
Forecast Horizon Traffic Forecasting Accuracy
Existing Road New Road
Next Day
1 Year
5 Years
20 Years
64
Forecasting Accuracy Survey Results
Forecast Horizon Traffic Forecasting Accuracy
Existing Road New Road
Next Day ± 7.5% n/a
1 Year ± 12.5% ± 17.5%
5 Years ± 20% ± 27.5%
20 Years ± 42.5% ± 47.5%
65
Summary
66
Summary
67
Summary
68
104 toll roads, bridges & tunnels
Summary
69
Error frequency & size; skew (bias)
Summary
70
Summary
71
6 studies (toll and toll-free)
Summary
72
Toll-free = no bias; similar error
Summary
73
Summary
74
55 HA projects
Summary
75
1/3 > ± 15%
Summary
76
Summary
77
Catalogued 21 weaknesses & limitations
with traditional 4-step traffic model
Summary
78
Models: crude, imperfect simplifications.
Forget it. Let’s pretend they’re perfect!
Summary
79
Summary
80
Focus on population projections
Summary
81
Even the most straightforward
of inputs introduce considerable
uncertainty (potential for error)
Summary
82
Summary
83
DfT research into
national traffic forecasting
accuracy intervals
Summary
84
Intuitively-appealing form.
Proportionality constant
will be larger (much
larger?) for local forecasts
>> ± 4.3% * √n
Summary
85
Summary
86
Senior sector
representatives and their
experience of traffic
forecasting accuracy
Summary
87
Wide prediction intervals
Putting it Altogether
88
Putting it Altogether
89
Prediction
Interval ±%
Putting it Altogether
90
Prediction
Interval ±%
Putting it Altogether
91
Prediction
Interval ±%
Putting it Altogether
92
Prediction
Interval ±%
Putting it Altogether
93
Prediction
Interval ±%
±7.5% * √n
Putting it Altogether
94
Prediction
Interval ±%
±7.5% * √n
Putting it Altogether
95
Prediction
Interval ±%
±7.5% * √n
Prediction Intervals
Study Level 90% Confidence Traffic Forecast Horizon
1 Year 10 Years 25 Years
96
Prediction Intervals
Study Level 90% Confidence Traffic Forecast Horizon
1 Year 10 Years 25 Years
National ± 2.5% * √n ± 3% ± 8% ± 13%
97
Prediction Intervals
Study Level 90% Confidence Traffic Forecast Horizon
1 Year 10 Years 25 Years
National ± 2.5% * √n ± 3% ± 8% ± 13%
Regional > ± 4.3% * √n ?
98
Prediction Intervals
Study Level 90% Confidence Traffic Forecast Horizon
1 Year 10 Years 25 Years
National ± 2.5% * √n ± 3% ± 8% ± 13%
Regional
Local
99
Prediction Intervals
Study Level 90% Confidence Traffic Forecast Horizon
1 Year 10 Years 25 Years
National ± 2.5% * √n ± 3% ± 8% ± 13%
Regional
Local ± 7.5% * √n
100
Prediction Intervals
Study Level 90% Confidence Traffic Forecast Horizon
1 Year 10 Years 25 Years
National ± 2.5% * √n ± 3% ± 8% ± 13%
Regional
Local ± 7.5% * √n ± 8% ± 24% ± 38%
101
Prediction Intervals
Study Level 90% Confidence Traffic Forecast Horizon
1 Year 10 Years 25 Years
National ± 2.5% * √n ± 3% ± 8% ± 13%
Regional ± 5% * √n ?
Local ± 7.5% * √n ± 8% ± 24% ± 38%
102
Prediction Intervals
Study Level 90% Confidence Traffic Forecast Horizon
1 Year 10 Years 25 Years
National ± 2.5% * √n ± 3% ± 8% ± 13%
Regional ± 5% * √n ± 5% ± 16% ± 25%
Local ± 7.5% * √n ± 8% ± 24% ± 38%
103
So This is What Local Traffic
Forecasts Should Look Like...
Empirically-Derived Prediction
Intervals
105
1990 2000 2010 2020 2030 2040 2050 2060
20,000
40,000
60,000
80,000
100,000
120,000
140,000
160,000
180,000
200,000
AADT
Project A
www.robbain.com
Empirically-Derived Prediction
Intervals
106
2005 2010 2015 2020 2025 2030 2035 2040 2045
10,000
20,000
30,000
40,000
50,000
60,000
70,000
80,000
90,000
100,000
AnnualTransactions(000's)
Project B
www.robbain.com
Empirically-Derived Prediction
Intervals
107
2010 2015 2020 2025 2030
10,000
20,000
30,000
40,000
50,000
60,000
70,000
AnnualRevenue($000's)
Project C
www.robbain.com
2015 Research Update
108
2015 Research Update
• The slide deck presented here dates from late 2013
• Since then Bain has been…
– Adding to the existing research steams:
• Forecasting errors - new studies measuring toll road forecasting errors (eg. EU
Court of Auditors)
– Consistent findings
• Population forecasts - turning from past errors to published forecast ranges
– Wide!
• Practitioner expectations - A US equivalent of my ‘ask the practitioners’ survey
has been conducted
– Broadly consistent findings
– Adding 3 new research streams (more petals!)…
109
New Research (WIP)
8. Same project, different consultants
• Huge variance!
9. Same project, different models
• Different models → different forecasts
10. Compare & contrast with Monte Carlo simulation
• Output ranges not dissimilar to my predictive intervals
110
All that remains is to publish the paper
Always the difficult part!!
New Research (WIP)
8. Same project, different consultants
• Huge variance!
9. Same project, different models
• Different models → different forecasts
10. Compare & contrast with Monte Carlo simulation
• Output ranges not dissimilar to my predictive intervals
111
All that remains is to publish the paper
Always the difficult part!!
112
Further Information…
www.robbain.com 113
All Research Papers & Reports Available for Free
Download From:
www.robbain.com
114
Lesson 1
115
Lesson 1
116
Lesson 1
• Road took 7 years
to reach forecasts.
117
118
Lesson 2
119
Lesson 2
• Receivers appointed in Dec. 2007.
• Cost $1bn+ but sold for $700m.
120
Lesson 2
121
Lesson 3
122
Lesson 3
123
Lesson 3
• Road underperformed in terms of trips
...but compensated in terms of trip distance
restoring vehicle kms travelled.
124
Lesson 3
125
Lesson 4
126
Lesson 4
127
Lesson 4
• Into receivership in Jan. 2010.
• Cost $1.1bn+ but sold for $630m.
• $160m legal action against traffic
forecasters launched in Sept. 2009.
128
Lesson 4
129
Lesson 5
130
Lesson 5
131
Lesson 5
• Share price slumped from $1 to 45c.
• Delisted and sold for $2.2bn (cost $2.5bn).
132
Lesson 5
Lesson 6
133
Lesson 6
134
Lesson 6
135
Lesson 6
• Shares initially fell to 20% of value. Now worth $0.
• Into receivership in Feb. 2011 owing $1.3bn to banks.
• $150m class action lawsuit against traffic forecasters.
• $2bn legal action by receivers against traffic forecasters.
136
137
Lesson 7
138
Lesson 7
139
Lesson 7
• Council insists performance above forecasts
(but revised forecasts).
• Built for $370m.
• 50-year rights sold for $112m.
Lesson 8
140
Lesson 8
141
Lesson 8
142
Lesson 8
• Underperformance prompts operator to
introduce tolls incrementally.
• Tariffs 45% - 55% below anticipated levels.
• Into receivership Feb. 2013.
143
Why?
144
Why? 17 Contributory Factors...
• Public sector focus = maximum upfront value extraction from concession sale
• Big ticket, greenfield projects that could not be developed incrementally (tunnels)
• Lots of money chasing few assets
• Contractor and investment bank-led bidding consortia
• Small construction industry: limited competition (and higher prices)
• Aggressive financial structures: high leverage, massive debt
• Equity packaged and sold-down to third party investors
• Traffic consultants on big success fees (and extensive use of disclaimers)
• Traffic consultants promised further work
• High toll tariffs (reflecting high initial capex)
• Modest time savings (especially off-peak)
• Traffic calming on surface streets not delivered
• Traffic demand models with all the dials turned up to 11
• Limited period modelling and reliance on (massive) expansion/annualisation factors
• Key links (including target) over-capacity from Day 1. Busiest facilities in the world!
• Traffic & revenue auditor dispensed with (or remit considerably reduced)
• Winning bidders way out front (runners-up bunched around half of the winning forecast)
145
Why? 17 Contributory Factors...
• Public sector focus = maximum upfront value extraction from concession sale
• Big ticket, greenfield projects that could not be developed incrementally (tunnels)
• Lots of money chasing few assets
• Contractor and investment bank-led bidding consortia
• Small construction industry: limited competition (and higher prices)
• Aggressive financial structures: high leverage, massive debt
• Equity packaged and sold-down to third party investors
• Traffic consultants on big success fees (and extensive use of disclaimers)
• Traffic consultants promised further work
• High toll tariffs (reflecting high initial capex)
• Modest time savings (especially off-peak)
• Traffic calming on surface streets not delivered
• Traffic demand models with all the dials turned up to 11
• Limited period modelling and reliance on (massive) expansion/annualisation factors
• Key links (including target) over-capacity from Day 1. Busiest facilities in the world!
• Traffic & revenue auditor dispensed with (or remit considerably reduced)
• Winning bidders way out front (runners-up bunched around half of the winning forecast)
146
Why? 17 Contributory Factors...
• Public sector focus = maximum upfront value extraction from concession sale
• Big ticket, greenfield projects that could not be developed incrementally (tunnels)
• Lots of money chasing few assets
• Contractor and investment bank-led bidding consortia
• Small construction industry: limited competition (and higher prices)
• Aggressive financial structures: high leverage, massive debt
• Equity packaged and sold-down to third party investors
• Traffic consultants on big success fees (and extensive use of disclaimers)
• Traffic consultants promised further work
• High toll tariffs (reflecting high initial capex)
• Modest time savings (especially off-peak)
• Traffic calming on surface streets not delivered
• Traffic demand models with all the dials turned up to 11
• Limited period modelling and reliance on (massive) expansion/annualisation factors
• Key links (including target) over-capacity from Day 1. Busiest facilities in the world!
• Traffic & revenue auditor dispensed with (or remit considerably reduced)
• Winning bidders way out front (runners-up bunched around half of the winning forecast)
147
Why? 17 Contributory Factors...
• Public sector focus = maximum upfront value extraction from concession sale
• Big ticket, greenfield projects that could not be developed incrementally (tunnels)
• Lots of money chasing few assets
• Contractor and investment bank-led bidding consortia
• Small construction industry: limited competition (and higher prices)
• Aggressive financial structures: high leverage, massive debt
• Equity packaged and sold-down to third party investors
• Traffic consultants on big success fees (and extensive use of disclaimers)
• Traffic consultants promised further work
• High toll tariffs (reflecting high initial capex)
• Modest time savings (especially off-peak)
• Traffic calming on surface streets not delivered
• Traffic demand models with all the dials turned up to 11
• Limited period modelling and reliance on (massive) expansion/annualisation factors
• Key links (including target) over-capacity from Day 1. Busiest facilities in the world!
• Traffic & revenue auditor dispensed with (or remit considerably reduced)
• Winning bidders way out front (runners-up bunched around half of the winning forecast)
148
Why? 17 Contributory Factors...
• Public sector focus = maximum upfront value extraction from concession sale
• Big ticket, greenfield projects that could not be developed incrementally (tunnels)
• Lots of money chasing few assets
• Contractor and investment bank-led bidding consortia
• Small construction industry: limited competition (and higher prices)
• Aggressive financial structures: high leverage, massive debt
• Equity packaged and sold-down to third party investors
• Traffic consultants on big success fees (and extensive use of disclaimers)
• Traffic consultants promised further work
• High toll tariffs (reflecting high initial capex)
• Modest time savings (especially off-peak)
• Traffic calming on surface streets not delivered
• Traffic demand models with all the dials turned up to 11
• Limited period modelling and reliance on (massive) expansion/annualisation factors
• Key links (including target) over-capacity from Day 1. Busiest facilities in the world!
• Traffic & revenue auditor dispensed with (or remit considerably reduced)
• Winning bidders way out front (runners-up bunched around half of the winning forecast)
149
Why? 17 Contributory Factors...
• Public sector focus = maximum upfront value extraction from concession sale
• Big ticket, greenfield projects that could not be developed incrementally (tunnels)
• Lots of money chasing few assets
• Contractor and investment bank-led bidding consortia
• Small construction industry: limited competition (and higher prices)
• Aggressive financial structures: high leverage, massive debt
• Equity packaged and sold-down to third party investors
• Traffic consultants on big success fees (and extensive use of disclaimers)
• Traffic consultants promised further work
• High toll tariffs (reflecting high initial capex)
• Modest time savings (especially off-peak)
• Traffic calming on surface streets not delivered
• Traffic demand models with all the dials turned up to 11
• Limited period modelling and reliance on (massive) expansion/annualisation factors
• Key links (including target) over-capacity from Day 1. Busiest facilities in the world!
• Traffic & revenue auditor dispensed with (or remit considerably reduced)
• Winning bidders way out front (runners-up bunched around half of the winning forecast)
150
Why? 17 Contributory Factors...
• Public sector focus = maximum upfront value extraction from concession sale
• Big ticket, greenfield projects that could not be developed incrementally (tunnels)
• Lots of money chasing few assets
• Contractor and investment bank-led bidding consortia
• Small construction industry: limited competition (and higher prices)
• Aggressive financial structures: high leverage, massive debt
• Equity packaged and sold-down to third party investors
• Traffic consultants on big success fees (and extensive use of disclaimers)
• Traffic consultants promised further work
• High toll tariffs (reflecting high initial capex)
• Modest time savings (especially off-peak)
• Traffic calming on surface streets not delivered
• Traffic demand models with all the dials turned up to 11
• Limited period modelling and reliance on (massive) expansion/annualisation factors
• Key links (including target) over-capacity from Day 1. Busiest facilities in the world!
• Traffic & revenue auditor dispensed with (or remit considerably reduced)
• Winning bidders way out front (runners-up bunched around half of the winning forecast)
151
Why? 17 Contributory Factors...
• Public sector focus = maximum upfront value extraction from concession sale
• Big ticket, greenfield projects that could not be developed incrementally (tunnels)
• Lots of money chasing few assets
• Contractor and investment bank-led bidding consortia
• Small construction industry: limited competition (and higher prices)
• Aggressive financial structures: high leverage, massive debt
• Equity packaged and sold-down to third party investors
• Traffic consultants on big success fees (and extensive use of disclaimers)
• Traffic consultants promised further work
• High toll tariffs (reflecting high initial capex)
• Modest time savings (especially off-peak)
• Traffic calming on surface streets not delivered
• Traffic demand models with all the dials turned up to 11
• Limited period modelling and reliance on (massive) expansion/annualisation factors
• Key links (including target) over-capacity from Day 1. Busiest facilities in the world!
• Traffic & revenue auditor dispensed with (or remit considerably reduced)
• Winning bidders way out front (runners-up bunched around half of the winning forecast)
152
Why? 17 Contributory Factors...
• Public sector focus = maximum upfront value extraction from concession sale
• Big ticket, greenfield projects that could not be developed incrementally (tunnels)
• Lots of money chasing few assets
• Contractor and investment bank-led bidding consortia
• Small construction industry: limited competition (and higher prices)
• Aggressive financial structures: high leverage, massive debt
• Equity packaged and sold-down to third party investors
• Traffic consultants on big success fees (and extensive use of disclaimers)
• Traffic consultants promised further work
• High toll tariffs (reflecting high initial capex)
• Modest time savings (especially off-peak)
• Traffic calming on surface streets not delivered
• Traffic demand models with all the dials turned up to 11
• Limited period modelling and reliance on (massive) expansion/annualisation factors
• Key links (including target) over-capacity from Day 1. Busiest facilities in the world!
• Traffic & revenue auditor dispensed with (or remit considerably reduced)
• Winning bidders way out front (runners-up bunched around half of the winning forecast)
153
Why? 17 Contributory Factors...
• Public sector focus = maximum upfront value extraction from concession sale
• Big ticket, greenfield projects that could not be developed incrementally (tunnels)
• Lots of money chasing few assets
• Contractor and investment bank-led bidding consortia
• Small construction industry: limited competition (and higher prices)
• Aggressive financial structures: high leverage, massive debt
• Equity packaged and sold-down to third party investors
• Traffic consultants on big success fees (and extensive use of disclaimers)
• Traffic consultants promised further work
• High toll tariffs (reflecting high initial capex)
• Modest time savings (especially off-peak)
• Traffic calming on surface streets not delivered
• Traffic demand models with all the dials turned up to 11
• Limited period modelling and reliance on (massive) expansion/annualisation factors
• Key links (including target) over-capacity from Day 1. Busiest facilities in the world!
• Traffic & revenue auditor dispensed with (or remit considerably reduced)
• Winning bidders way out front (runners-up bunched around half of the winning forecast)
154
Why? 17 Contributory Factors...
• Public sector focus = maximum upfront value extraction from concession sale
• Big ticket, greenfield projects that could not be developed incrementally (tunnels)
• Lots of money chasing few assets
• Contractor and investment bank-led bidding consortia
• Small construction industry: limited competition (and higher prices)
• Aggressive financial structures: high leverage, massive debt
• Equity packaged and sold-down to third party investors
• Traffic consultants on big success fees (and extensive use of disclaimers)
• Traffic consultants promised further work
• High toll tariffs (reflecting high initial capex)
• Modest time savings (especially off-peak)
• Traffic calming on surface streets not delivered
• Traffic demand models with all the dials turned up to 11
• Limited period modelling and reliance on (massive) expansion/annualisation factors
• Key links (including target) over-capacity from Day 1. Busiest facilities in the world!
• Traffic & revenue auditor dispensed with (or remit considerably reduced)
• Winning bidders way out front (runners-up bunched around half of the winning forecast)
155
Why? 17 Contributory Factors...
• Public sector focus = maximum upfront value extraction from concession sale
• Big ticket, greenfield projects that could not be developed incrementally (tunnels)
• Lots of money chasing few assets
• Contractor and investment bank-led bidding consortia
• Small construction industry: limited competition (and higher prices)
• Aggressive financial structures: high leverage, massive debt
• Equity packaged and sold-down to third party investors
• Traffic consultants on big success fees (and extensive use of disclaimers)
• Traffic consultants promised further work
• High toll tariffs (reflecting high initial capex)
• Modest time savings (especially off-peak)
• Traffic calming on surface streets not delivered
• Traffic demand models with all the dials turned up to 11
• Limited period modelling and reliance on (massive) expansion/annualisation factors
• Key links (including target) over-capacity from Day 1. Busiest facilities in the world!
• Traffic & revenue auditor dispensed with (or remit considerably reduced)
• Winning bidders way out front (runners-up bunched around half of the winning forecast)
156
Why? 17 Contributory Factors...
• Public sector focus = maximum upfront value extraction from concession sale
• Big ticket, greenfield projects that could not be developed incrementally (tunnels)
• Lots of money chasing few assets
• Contractor and investment bank-led bidding consortia
• Small construction industry: limited competition (and higher prices)
• Aggressive financial structures: high leverage, massive debt
• Equity packaged and sold-down to third party investors
• Traffic consultants on big success fees (and extensive use of disclaimers)
• Traffic consultants promised further work
• High toll tariffs (reflecting high initial capex)
• Modest time savings (especially off-peak)
• Traffic calming on surface streets not delivered
• Traffic demand models with all the dials turned up to 11
• Limited period modelling and reliance on (massive) expansion/annualisation factors
• Key links (including target) over-capacity from Day 1. Busiest facilities in the world!
• Traffic & revenue auditor dispensed with (or remit considerably reduced)
• Winning bidders way out front (runners-up bunched around half of the winning forecast)
157
Why? 17 Contributory Factors...
• Public sector focus = maximum upfront value extraction from concession sale
• Big ticket, greenfield projects that could not be developed incrementally (tunnels)
• Lots of money chasing few assets
• Contractor and investment bank-led bidding consortia
• Small construction industry: limited competition (and higher prices)
• Aggressive financial structures: high leverage, massive debt
• Equity packaged and sold-down to third party investors
• Traffic consultants on big success fees (and extensive use of disclaimers)
• Traffic consultants promised further work
• High toll tariffs (reflecting high initial capex)
• Modest time savings (especially off-peak)
• Traffic calming on surface streets not delivered
• Traffic demand models with all the dials turned up to 11
• Limited period modelling and reliance on (massive) expansion/annualisation factors
• Key links (including target) over-capacity from Day 1. Busiest facilities in the world!
• Traffic & revenue auditor dispensed with (or remit considerably reduced)
• Winning bidders way out front (runners-up bunched around half of the winning forecast)
158
Why? 17 Contributory Factors...
• Public sector focus = maximum upfront value extraction from concession sale
• Big ticket, greenfield projects that could not be developed incrementally (tunnels)
• Lots of money chasing few assets
• Contractor and investment bank-led bidding consortia
• Small construction industry: limited competition (and higher prices)
• Aggressive financial structures: high leverage, massive debt
• Equity packaged and sold-down to third party investors
• Traffic consultants on big success fees (and extensive use of disclaimers)
• Traffic consultants promised further work
• High toll tariffs (reflecting high initial capex)
• Modest time savings (especially off-peak)
• Traffic calming on surface streets not delivered
• Traffic demand models with all the dials turned up to 11
• Limited period modelling and reliance on (massive) expansion/annualisation factors
• Key links (including target) over-capacity from Day 1. Busiest facilities in the world!
• Traffic & revenue auditor dispensed with (or remit considerably reduced)
• Winning bidders way out front (runners-up bunched around half of the winning forecast)
159
Why? 17 Contributory Factors...
• Public sector focus = maximum upfront value extraction from concession sale
• Big ticket, greenfield projects that could not be developed incrementally (tunnels)
• Lots of money chasing few assets
• Contractor and investment bank-led bidding consortia
• Small construction industry: limited competition (and higher prices)
• Aggressive financial structures: high leverage, massive debt
• Equity packaged and sold-down to third party investors
• Traffic consultants on big success fees (and extensive use of disclaimers)
• Traffic consultants promised further work
• High toll tariffs (reflecting high initial capex)
• Modest time savings (especially off-peak)
• Traffic calming on surface streets not delivered
• Traffic demand models with all the dials turned up to 11
• Limited period modelling and reliance on (massive) expansion/annualisation factors
• Key links (including target) over-capacity from Day 1. Busiest facilities in the world!
• Traffic & revenue auditor dispensed with (or remit considerably reduced)
• Winning bidders way out front (runners-up bunched around half of the winning forecast)
160
Why? 17 Contributory Factors...
• Public sector focus = maximum upfront value extraction from concession sale
• Big ticket, greenfield projects that could not be developed incrementally (tunnels)
• Lots of money chasing few assets
• Contractor and investment bank-led bidding consortia
• Small construction industry: limited competition (and higher prices)
• Aggressive financial structures: high leverage, massive debt
• Equity packaged and sold-down to third party investors
• Traffic consultants on big success fees (and extensive use of disclaimers)
• Traffic consultants promised further work
• High toll tariffs (reflecting high initial capex)
• Modest time savings (especially off-peak)
• Traffic calming on surface streets not delivered
• Traffic demand models with all the dials turned up to 11
• Limited period modelling and reliance on (massive) expansion/annualisation factors
• Key links (including target) over-capacity from Day 1. Busiest facilities in the world!
• Traffic & revenue auditor dispensed with (or remit considerably reduced)
• Winning bidders way out front (runners-up bunched around half of the winning forecast)
161
Why? 17 Contributory Factors...
• Public sector focus = maximum upfront value extraction from concession sale
• Big ticket, greenfield projects that could not be developed incrementally (tunnels)
• Lots of money chasing few assets
• Contractor and investment bank-led bidding consortia
• Small construction industry: limited competition (and higher prices)
• Aggressive financial structures: high leverage, massive debt
• Equity packaged and sold-down to third party investors
• Traffic consultants on big success fees (and extensive use of disclaimers)
• Traffic consultants promised further work
• High toll tariffs (reflecting high initial capex)
• Modest time savings (especially off-peak)
• Traffic calming on surface streets not delivered
• Traffic demand models with all the dials turned up to 11
• Limited period modelling and reliance on (massive) expansion/annualisation factors
• Key links (including target) over-capacity from Day 1. Busiest facilities in the world!
• Traffic & revenue auditor dispensed with (or remit considerably reduced)
• Winning bidders way out front (runners-up bunched around half of the winning forecast)
162
Analysis of Contributory Factors
• 4 main categories:
– Model-related
– Project-related
– Skewed incentives
– Gaming the forecasts
• Gaming the forecasts
– For strategic, commercial or political gain
– Forecasts are inherently contestable, so easy/obvious target!
163
Analysis of Contributory Factors
• 4 main categories:
– Model-related
– Project-related
– Skewed incentives
– Gaming the forecasts
• Gaming the forecasts
– For strategic, commercial or political gain
– Forecasts are inherently contestable, so easy/obvious target!
164
Analysis of Contributory Factors
• 4 main categories:
– Model-related
– Project-related
– Skewed incentives
– Gaming the forecasts
• Gaming the forecasts
– For strategic, commercial, institutional or political gain
– Forecasts are inherently contestable, so obvious/easy target!
165
Who’s the Bad Guy?
• The private sector is often painted as the bad guy
– ...but the public sector has its moments!
• Recent commission (review public sector forecasts)
– Initial feedback - forecasts = too high - not well received
– Suspicions that BCR was being propped-up by the (high) forecasts
– My suggested numbers removed from final report
– Final report not made public
– Business case not made public
– Forecasts
• Public sector consultants: 65-70,000 vehicles/day
• Independent review team: 35-55,000 vehicles/day
• Politician: 80-100,000 vehicles/day!!
– Project opponents vilified in the press
• Despite focus on process, not project
• Accusations of “analysis paralysis”
• Public sector forecasts regularly regarded as ‘floor’
– ...or hurdle for private sector to beat
– Often = the root cause of the problem
166
Who’s the Bad Guy?
• The private sector is often painted as the bad guy
– ...but the public sector has its moments!
• Recent commission (review public sector forecasts)
– Initial feedback - forecasts = too high - not well received
– Suspicions that BCR was being propped-up by the (high) forecasts
– My suggested numbers removed from final report
– Final report not made public
– Business case not made public
– Forecasts
• Public sector consultants: 65-70,000 vehicles/day
• Independent review team: 35-55,000 vehicles/day
• Politician: 80-100,000 vehicles/day!!
– Project opponents vilified in the press
• Despite focus on process, not project
• Accusations of “analysis paralysis”
• Public sector forecasts regularly regarded as ‘floor’
– ...or hurdle for private sector to beat
– Often = the root cause of the problem
167
Who’s the Bad Guy?
• The private sector is often painted as the bad guy
– ...but the public sector has its moments!
• Recent commission (review public sector forecasts)
– Initial feedback - forecasts = too high - not well received
– Suspicions that BCR was being propped-up by the (high) forecasts
– My suggested numbers removed from final report
– Final report not made public
– Business case not made public
– Forecasts
• Public sector consultants: 65-70,000 vehicles/day
• Independent review team: 35-55,000 vehicles/day
• Politician: 80-100,000 vehicles/day!!
– Project opponents vilified in the press
• Despite focus on process, not project
• Accusations of “analysis paralysis”
• Public sector forecasts regularly regarded as ‘floor’
– ...or hurdle for private sector to beat
– Often = the root cause of the problem
168
Who’s the Bad Guy?
• The private sector is often painted as the bad guy
– ...but the public sector has its moments!
• Recent commission (review public sector forecasts)
– Initial feedback - forecasts = too high - not well received
– Suspicions that BCR was being propped-up by the (high) forecasts
– My suggested numbers removed from final report
– Final report not made public
– Business case not made public
– Forecasts
• Public sector consultants: 65-70,000 vehicles/day
• Independent review team: 35-55,000 vehicles/day
• Politician: 80-100,000 vehicles/day!!
– Project opponents vilified in the press
• Despite focus on process, not project
• Accusations of “analysis paralysis”
• Public sector forecasts regularly regarded as ‘floor’
– ...or hurdle for private sector to beat
– Often = the root cause of the problem
169
Solution?
• Disclosure and transparency?
• Adjust/correct the incentives?
• Checks and balances to reduce the scope for influence?
• Take the pressure off the forecasts?
• ...or a mix of all 4?
• What do you think?
170

Rob Bain - Errors & Optimism Bias in Toll Road Traffic Forecasts

  • 1.
    Error & OptimismBias in Toll Road Traffic Forecasts Robert Bain RBconsult | University of Leeds PERTH Western Australia 11 August 2015
  • 2.
    Alternatively… The Challenge ofPredictive Unreliability 2
  • 3.
    What Do WeWant to Achieve? 3
  • 4.
    What Do WeWant to Achieve? Spatial Area 90% Confidence Level Traffic Forecast Horizon 1 Year 10 Years 25 Years National ?Regional Local 4
  • 5.
    A Little Reminder 5 DMRB1996 (none of this is new!)
  • 6.
    A Little Reminder 6 DMRB1996 None of this is new!
  • 7.
    A Focus onPrediction Intervals • Travel demand forecasts have prediction intervals 1. What do these prediction intervals look like? 2. What does empirical evidence tell us? 7 An estimate of an interval in which future observations will fall, with a certain probability, given what has already been observed.
  • 8.
    A Focus onPrediction Intervals • Travel demand forecasts have prediction intervals 1. What do these prediction intervals look like? 2. What does empirical evidence tell us? 8 An estimate of an interval in which future observations will fall, with a certain probability, given what has already been observed.
  • 9.
  • 10.
  • 11.
  • 12.
  • 13.
  • 14.
  • 15.
  • 16.
  • 17.
  • 18.
  • 19.
    Research at Standard& Poor’s 19
  • 20.
    Conclusions • Toll roadtraffic forecasting errors... – are common – are commonly large – are symmetrically distributed around a mean < 1.0 • ‘optimism bias’ 20
  • 21.
  • 22.
  • 23.
    Literature Review • JPMorgan (1997) – 14 new toll roads in the US – Only 1 exceeded its revenue prediction – 3 missed the mark by 25% – For 4, revenue was less than 30% of forecast • Flyvbjerg et al (2005) – 183 tolled and non-tolled roads – For ½, difference between actual and forecast was ± 20% – For ¼, difference was over ± 40% – No improvement in accuracy over 30 years 23
  • 24.
    Literature Review • USTransportation Research Board (2006) – 26 toll highways in the US – “Most of the results demonstrate an underperformance” – “Even with the availability of updated forecasts, only a small number of projections are within 10% of the actual revenues” • Vassallo (2007) – 14 toll roads in Spain – “On average, actual traffic was substantially overestimated (by approximately 35%)” 24
  • 25.
    Literature Review • Li& Hensher (2009) – Toll roads, bridges and tunnels in Australia – “On average, the actual traffic level of these five toll roads* is 45 percent lower than predicted” • Bain (2009) – 27 toll roads for the European Investment Bank – Sample included some ‘shadow’ toll roads – Accuracy range: -67% to +32% – Clear evidence of error and skew (bias) 25 * The M2, M7, Cross City Tunnel, Lane Cove Tunnel & EastLink
  • 26.
    Conclusions • Toll roadtraffic forecasting errors... – are common – are commonly large – are symmetrically distributed, but around a mean < 1.0 • ‘optimism bias’ • From Bain, 2009 (weak) and Flyvbjerg et al, 2005 (strong) – Toll and toll-free roads differ • In terms of bias (tendency for over-forecasting) – Toll and toll-free roads are similar • In terms of error (size of standard deviation) 26
  • 27.
  • 28.
  • 29.
    Forecast Accuracy inthe UK (POPE*) UK Highways Agency Dataset (2012) (n = 55) Actual/Forecast Traffic * Post-Opening Project Evaluation (POPE) of Major Schemes 29
  • 30.
    Conclusions • “73% ofactuals within ± 15% forecasts” – Varies by scheme type • On-line schemes: 82% within ± 15% • Bypass schemes: 67% within ± 15% • Junction schemes: 67% within ± 15% • Contrasted with toll road research findings – Mean is different (≈ 1.0 cf. 0.77) • Absence of systematic bias – SD is not that different (0.22 cf. 0.26) • Still significant error range • HA: “¼ forecasts” are out by > 15% – From HA raw data I calculate closer to ⅓ • Note (of importance): average age of forecast ≈ 5 - 10 years 30
  • 31.
  • 32.
  • 33.
    Summary • Compiled inventoryof traditional (4-step) model short-comings, flaws and limitations – Many technical, detailed and mode-specific: – Simplified assumptions about human behaviour – Simplified assumptions about transport supply – Other assumptions adopted for computational convenience 33 Models - irrespective of mathematical sophistication - remain crude and imperfect representations of complex and dynamic interactions between transport demand and supply
  • 34.
    Let’s Pretend... • Let’spretend that transport demand models are perfect – Complete and correct in terms of design, architecture, specification (explanatory variables & inter-relationships) etc. – 100% accurate in terms of data used to construct and estimate the base-year model • In forecasting mode we need other inputs – Forecasts of the explanatory (growth) variables themselves 34
  • 35.
  • 36.
  • 37.
    Forecasting Inputs • Forecastsof population are a key input for many (most?) transport demand models • Population forecasting should be relatively easy – We know the population today – There is a limited set of influences • Births • Deaths • Migration 37
  • 38.
  • 39.
    Small-Area Population Forecasts Sources:Smith & Shahidullah (1995), Simpson et al (1997), Smith et al (2001), Shaw (2007) and Rayer et al (2009) 39
  • 40.
    Small-Area Population Forecasts Sources:Smith & Shahidullah (1995), Simpson et al (1997), Smith et al (2001), Shaw (2007) and Rayer et al (2009) 40
  • 41.
    US Small Areas≈ Counties 41
  • 42.
    US Counties AreActually Quite Large • Average counties/state = 62 • Average population/county = 146,850 • But traffic modelling zones: – Populations of around 1,000 - 3,000 – 70+ times smaller 42
  • 43.
    US Counties AreActually Quite Large • Average counties/state = 62 • Average population/county = 146,850 • But traffic modelling zones: – Populations of around 1,000 - 3,000 – 70+ times smaller 43
  • 44.
    Predictive Error vSample Size 44
  • 45.
    Predictive Error vSample Size Tayman et al (1998) 45
  • 46.
    Consistent Research Results Authors10-Year MAPEs for Different Population Sizes 2,500-4,999 5,000 5,000-7,500 35,000 25,000-100,000 Tayman et al 30.6 27.9 26.1 11.5 10.5 - 12.4 Others 26.8 1 27.9 2 19.1 2 11.0 1 10.2 3 1. 2. 3. Smith & Shahidullah (1995) Murdock et al (1984) Isserman (1977) 46
  • 47.
    Our ‘Zone’ ofInterest 47
  • 48.
    Our ‘Zone’ ofInterest 48
  • 49.
    Our ‘Zone’ ofInterest These are 10-year forecast MAPEs. Deeper horizon MAPEs will be larger! 49
  • 50.
    Conclusions 1 • Populationforecasts have sizeable error ranges associated with them • These error ranges increase as the forecasting horizon increases – Linear relationship? • These error ranges increase as the study area decreases – Non-linear inverse relationship • The distributional characteristics of absolute percent forecast errors appear stable over time (Smith & Sincich, 1988) – Past errors can be used to estimate CIs for current forecasts 50
  • 51.
    Conclusions 2 • Populationis one of the more predictable variables commonly used to explain traffic growth • Try forecasting employment • ...and allocating it to the correct zones – Evidence from the US suggests that employment projections can be (nearly) twice as inaccurate as population forecasts Transportation Research Board, 2009 • Try forecasting GDP, income or fuel price! 51
  • 52.
  • 53.
  • 54.
    DfT Research &Guidance • WebTAG Unit 3.15.5 – The Treatment of Uncertainty in Model Forecasting – Use a range about the core scenario growth forecast of: ± 2.5% * √n (n = number of years ahead) – Formula estimated from national traffic forecast performance – Functional form is intuitively appealing • If error variance increases linearly with time... • ...standard deviation should vary with the square root of the forecast horizon – Local forecasts will have a (much?) wider range • NRTF97 – For total traffic at the level of a GOR...the uncertainty should widen to about ± 25% at the 35th year • “± 25% at GOR level feels narrow compared to ± 15% (Year 36) at the national level” • “The range for individual area types/links will be greater than GOR level (> ± 25%)” 54
  • 55.
    DfT Research &Guidance Study Level 90% Confidence Traffic Forecast Horizon 1 Year 10 Years 25 Years National ± 2.5% * √n ± 3% ± 8% ± 13% 55
  • 56.
    DfT Research &Guidance Study Level 90% Confidence Traffic Forecast Horizon 1 Year 10 Years 25 Years National ± 2.5% * √n ± 3% ± 8% ± 13% Regional 56
  • 57.
    DfT Research &Guidance Study Level 90% Confidence Traffic Forecast Horizon 1 Year 10 Years 25 Years National ± 2.5% * √n ± 3% ± 8% ± 13% Regional ± 4.3% * √n 57 GOR: ± 25% = √35 * 4.3%
  • 58.
    DfT Research &Guidance Study Level 90% Confidence Traffic Forecast Horizon 1 Year 10 Years 25 Years National ± 2.5% * √n ± 3% ± 8% ± 13% Regional > ± 4.3% * √n 58
  • 59.
    DfT Research &Guidance Study Level 90% Confidence Traffic Forecast Horizon 1 Year 10 Years 25 Years National ± 2.5% * √n ± 3% ± 8% ± 13% Regional > ± 4.3% * √n Local ? 59
  • 60.
    DfT Research &Guidance Study Level 90% Confidence Traffic Forecast Horizon 1 Year 10 Years 25 Years National ± 2.5% * √n ± 3% ± 8% ± 13% Regional > ± 4.3% * √n Local >> ± 4.3% * √n 60
  • 61.
  • 62.
  • 63.
    Traffic Forecasting AccuracySurvey Survey Respondents: • International responses (11 countries) • Consultants/modelling practitioners – President – Managing director – Director of transport planning • Government officials – Transport modelling manager – Senior transport & economics advisor – Traffic & toll modelling manager • Academics/researchers – 4 professors • Including one of the authors of ‘Modelling Transport’ – Senior lecturers – Deputy director, centre for transport studies 63
  • 64.
    Forecasting Accuracy SurveyResults Forecast Horizon Traffic Forecasting Accuracy Existing Road New Road Next Day 1 Year 5 Years 20 Years 64
  • 65.
    Forecasting Accuracy SurveyResults Forecast Horizon Traffic Forecasting Accuracy Existing Road New Road Next Day ± 7.5% n/a 1 Year ± 12.5% ± 17.5% 5 Years ± 20% ± 27.5% 20 Years ± 42.5% ± 47.5% 65
  • 66.
  • 67.
  • 68.
    Summary 68 104 toll roads,bridges & tunnels
  • 69.
  • 70.
  • 71.
  • 72.
    Summary 72 Toll-free = nobias; similar error
  • 73.
  • 74.
  • 75.
  • 76.
  • 77.
    Summary 77 Catalogued 21 weaknesses& limitations with traditional 4-step traffic model
  • 78.
    Summary 78 Models: crude, imperfectsimplifications. Forget it. Let’s pretend they’re perfect!
  • 79.
  • 80.
  • 81.
    Summary 81 Even the moststraightforward of inputs introduce considerable uncertainty (potential for error)
  • 82.
  • 83.
    Summary 83 DfT research into nationaltraffic forecasting accuracy intervals
  • 84.
    Summary 84 Intuitively-appealing form. Proportionality constant willbe larger (much larger?) for local forecasts >> ± 4.3% * √n
  • 85.
  • 86.
    Summary 86 Senior sector representatives andtheir experience of traffic forecasting accuracy
  • 87.
  • 88.
  • 89.
  • 90.
  • 91.
  • 92.
  • 93.
  • 94.
  • 95.
  • 96.
    Prediction Intervals Study Level90% Confidence Traffic Forecast Horizon 1 Year 10 Years 25 Years 96
  • 97.
    Prediction Intervals Study Level90% Confidence Traffic Forecast Horizon 1 Year 10 Years 25 Years National ± 2.5% * √n ± 3% ± 8% ± 13% 97
  • 98.
    Prediction Intervals Study Level90% Confidence Traffic Forecast Horizon 1 Year 10 Years 25 Years National ± 2.5% * √n ± 3% ± 8% ± 13% Regional > ± 4.3% * √n ? 98
  • 99.
    Prediction Intervals Study Level90% Confidence Traffic Forecast Horizon 1 Year 10 Years 25 Years National ± 2.5% * √n ± 3% ± 8% ± 13% Regional Local 99
  • 100.
    Prediction Intervals Study Level90% Confidence Traffic Forecast Horizon 1 Year 10 Years 25 Years National ± 2.5% * √n ± 3% ± 8% ± 13% Regional Local ± 7.5% * √n 100
  • 101.
    Prediction Intervals Study Level90% Confidence Traffic Forecast Horizon 1 Year 10 Years 25 Years National ± 2.5% * √n ± 3% ± 8% ± 13% Regional Local ± 7.5% * √n ± 8% ± 24% ± 38% 101
  • 102.
    Prediction Intervals Study Level90% Confidence Traffic Forecast Horizon 1 Year 10 Years 25 Years National ± 2.5% * √n ± 3% ± 8% ± 13% Regional ± 5% * √n ? Local ± 7.5% * √n ± 8% ± 24% ± 38% 102
  • 103.
    Prediction Intervals Study Level90% Confidence Traffic Forecast Horizon 1 Year 10 Years 25 Years National ± 2.5% * √n ± 3% ± 8% ± 13% Regional ± 5% * √n ± 5% ± 16% ± 25% Local ± 7.5% * √n ± 8% ± 24% ± 38% 103
  • 104.
    So This isWhat Local Traffic Forecasts Should Look Like...
  • 105.
    Empirically-Derived Prediction Intervals 105 1990 20002010 2020 2030 2040 2050 2060 20,000 40,000 60,000 80,000 100,000 120,000 140,000 160,000 180,000 200,000 AADT Project A www.robbain.com
  • 106.
    Empirically-Derived Prediction Intervals 106 2005 20102015 2020 2025 2030 2035 2040 2045 10,000 20,000 30,000 40,000 50,000 60,000 70,000 80,000 90,000 100,000 AnnualTransactions(000's) Project B www.robbain.com
  • 107.
    Empirically-Derived Prediction Intervals 107 2010 20152020 2025 2030 10,000 20,000 30,000 40,000 50,000 60,000 70,000 AnnualRevenue($000's) Project C www.robbain.com
  • 108.
  • 109.
    2015 Research Update •The slide deck presented here dates from late 2013 • Since then Bain has been… – Adding to the existing research steams: • Forecasting errors - new studies measuring toll road forecasting errors (eg. EU Court of Auditors) – Consistent findings • Population forecasts - turning from past errors to published forecast ranges – Wide! • Practitioner expectations - A US equivalent of my ‘ask the practitioners’ survey has been conducted – Broadly consistent findings – Adding 3 new research streams (more petals!)… 109
  • 110.
    New Research (WIP) 8.Same project, different consultants • Huge variance! 9. Same project, different models • Different models → different forecasts 10. Compare & contrast with Monte Carlo simulation • Output ranges not dissimilar to my predictive intervals 110 All that remains is to publish the paper Always the difficult part!!
  • 111.
    New Research (WIP) 8.Same project, different consultants • Huge variance! 9. Same project, different models • Different models → different forecasts 10. Compare & contrast with Monte Carlo simulation • Output ranges not dissimilar to my predictive intervals 111 All that remains is to publish the paper Always the difficult part!!
  • 112.
  • 113.
    Further Information… www.robbain.com 113 AllResearch Papers & Reports Available for Free Download From: www.robbain.com
  • 114.
  • 115.
  • 116.
  • 117.
    Lesson 1 • Roadtook 7 years to reach forecasts. 117
  • 118.
  • 119.
  • 120.
    • Receivers appointedin Dec. 2007. • Cost $1bn+ but sold for $700m. 120 Lesson 2
  • 121.
  • 122.
  • 123.
  • 124.
    • Road underperformedin terms of trips ...but compensated in terms of trip distance restoring vehicle kms travelled. 124 Lesson 3
  • 125.
  • 126.
  • 127.
  • 128.
    • Into receivershipin Jan. 2010. • Cost $1.1bn+ but sold for $630m. • $160m legal action against traffic forecasters launched in Sept. 2009. 128 Lesson 4
  • 129.
  • 130.
  • 131.
  • 132.
    • Share priceslumped from $1 to 45c. • Delisted and sold for $2.2bn (cost $2.5bn). 132 Lesson 5
  • 133.
  • 134.
  • 135.
  • 136.
    Lesson 6 • Sharesinitially fell to 20% of value. Now worth $0. • Into receivership in Feb. 2011 owing $1.3bn to banks. • $150m class action lawsuit against traffic forecasters. • $2bn legal action by receivers against traffic forecasters. 136
  • 137.
  • 138.
  • 139.
    139 Lesson 7 • Councilinsists performance above forecasts (but revised forecasts). • Built for $370m. • 50-year rights sold for $112m.
  • 140.
  • 141.
  • 142.
  • 143.
    Lesson 8 • Underperformanceprompts operator to introduce tolls incrementally. • Tariffs 45% - 55% below anticipated levels. • Into receivership Feb. 2013. 143
  • 144.
  • 145.
    Why? 17 ContributoryFactors... • Public sector focus = maximum upfront value extraction from concession sale • Big ticket, greenfield projects that could not be developed incrementally (tunnels) • Lots of money chasing few assets • Contractor and investment bank-led bidding consortia • Small construction industry: limited competition (and higher prices) • Aggressive financial structures: high leverage, massive debt • Equity packaged and sold-down to third party investors • Traffic consultants on big success fees (and extensive use of disclaimers) • Traffic consultants promised further work • High toll tariffs (reflecting high initial capex) • Modest time savings (especially off-peak) • Traffic calming on surface streets not delivered • Traffic demand models with all the dials turned up to 11 • Limited period modelling and reliance on (massive) expansion/annualisation factors • Key links (including target) over-capacity from Day 1. Busiest facilities in the world! • Traffic & revenue auditor dispensed with (or remit considerably reduced) • Winning bidders way out front (runners-up bunched around half of the winning forecast) 145
  • 146.
    Why? 17 ContributoryFactors... • Public sector focus = maximum upfront value extraction from concession sale • Big ticket, greenfield projects that could not be developed incrementally (tunnels) • Lots of money chasing few assets • Contractor and investment bank-led bidding consortia • Small construction industry: limited competition (and higher prices) • Aggressive financial structures: high leverage, massive debt • Equity packaged and sold-down to third party investors • Traffic consultants on big success fees (and extensive use of disclaimers) • Traffic consultants promised further work • High toll tariffs (reflecting high initial capex) • Modest time savings (especially off-peak) • Traffic calming on surface streets not delivered • Traffic demand models with all the dials turned up to 11 • Limited period modelling and reliance on (massive) expansion/annualisation factors • Key links (including target) over-capacity from Day 1. Busiest facilities in the world! • Traffic & revenue auditor dispensed with (or remit considerably reduced) • Winning bidders way out front (runners-up bunched around half of the winning forecast) 146
  • 147.
    Why? 17 ContributoryFactors... • Public sector focus = maximum upfront value extraction from concession sale • Big ticket, greenfield projects that could not be developed incrementally (tunnels) • Lots of money chasing few assets • Contractor and investment bank-led bidding consortia • Small construction industry: limited competition (and higher prices) • Aggressive financial structures: high leverage, massive debt • Equity packaged and sold-down to third party investors • Traffic consultants on big success fees (and extensive use of disclaimers) • Traffic consultants promised further work • High toll tariffs (reflecting high initial capex) • Modest time savings (especially off-peak) • Traffic calming on surface streets not delivered • Traffic demand models with all the dials turned up to 11 • Limited period modelling and reliance on (massive) expansion/annualisation factors • Key links (including target) over-capacity from Day 1. Busiest facilities in the world! • Traffic & revenue auditor dispensed with (or remit considerably reduced) • Winning bidders way out front (runners-up bunched around half of the winning forecast) 147
  • 148.
    Why? 17 ContributoryFactors... • Public sector focus = maximum upfront value extraction from concession sale • Big ticket, greenfield projects that could not be developed incrementally (tunnels) • Lots of money chasing few assets • Contractor and investment bank-led bidding consortia • Small construction industry: limited competition (and higher prices) • Aggressive financial structures: high leverage, massive debt • Equity packaged and sold-down to third party investors • Traffic consultants on big success fees (and extensive use of disclaimers) • Traffic consultants promised further work • High toll tariffs (reflecting high initial capex) • Modest time savings (especially off-peak) • Traffic calming on surface streets not delivered • Traffic demand models with all the dials turned up to 11 • Limited period modelling and reliance on (massive) expansion/annualisation factors • Key links (including target) over-capacity from Day 1. Busiest facilities in the world! • Traffic & revenue auditor dispensed with (or remit considerably reduced) • Winning bidders way out front (runners-up bunched around half of the winning forecast) 148
  • 149.
    Why? 17 ContributoryFactors... • Public sector focus = maximum upfront value extraction from concession sale • Big ticket, greenfield projects that could not be developed incrementally (tunnels) • Lots of money chasing few assets • Contractor and investment bank-led bidding consortia • Small construction industry: limited competition (and higher prices) • Aggressive financial structures: high leverage, massive debt • Equity packaged and sold-down to third party investors • Traffic consultants on big success fees (and extensive use of disclaimers) • Traffic consultants promised further work • High toll tariffs (reflecting high initial capex) • Modest time savings (especially off-peak) • Traffic calming on surface streets not delivered • Traffic demand models with all the dials turned up to 11 • Limited period modelling and reliance on (massive) expansion/annualisation factors • Key links (including target) over-capacity from Day 1. Busiest facilities in the world! • Traffic & revenue auditor dispensed with (or remit considerably reduced) • Winning bidders way out front (runners-up bunched around half of the winning forecast) 149
  • 150.
    Why? 17 ContributoryFactors... • Public sector focus = maximum upfront value extraction from concession sale • Big ticket, greenfield projects that could not be developed incrementally (tunnels) • Lots of money chasing few assets • Contractor and investment bank-led bidding consortia • Small construction industry: limited competition (and higher prices) • Aggressive financial structures: high leverage, massive debt • Equity packaged and sold-down to third party investors • Traffic consultants on big success fees (and extensive use of disclaimers) • Traffic consultants promised further work • High toll tariffs (reflecting high initial capex) • Modest time savings (especially off-peak) • Traffic calming on surface streets not delivered • Traffic demand models with all the dials turned up to 11 • Limited period modelling and reliance on (massive) expansion/annualisation factors • Key links (including target) over-capacity from Day 1. Busiest facilities in the world! • Traffic & revenue auditor dispensed with (or remit considerably reduced) • Winning bidders way out front (runners-up bunched around half of the winning forecast) 150
  • 151.
    Why? 17 ContributoryFactors... • Public sector focus = maximum upfront value extraction from concession sale • Big ticket, greenfield projects that could not be developed incrementally (tunnels) • Lots of money chasing few assets • Contractor and investment bank-led bidding consortia • Small construction industry: limited competition (and higher prices) • Aggressive financial structures: high leverage, massive debt • Equity packaged and sold-down to third party investors • Traffic consultants on big success fees (and extensive use of disclaimers) • Traffic consultants promised further work • High toll tariffs (reflecting high initial capex) • Modest time savings (especially off-peak) • Traffic calming on surface streets not delivered • Traffic demand models with all the dials turned up to 11 • Limited period modelling and reliance on (massive) expansion/annualisation factors • Key links (including target) over-capacity from Day 1. Busiest facilities in the world! • Traffic & revenue auditor dispensed with (or remit considerably reduced) • Winning bidders way out front (runners-up bunched around half of the winning forecast) 151
  • 152.
    Why? 17 ContributoryFactors... • Public sector focus = maximum upfront value extraction from concession sale • Big ticket, greenfield projects that could not be developed incrementally (tunnels) • Lots of money chasing few assets • Contractor and investment bank-led bidding consortia • Small construction industry: limited competition (and higher prices) • Aggressive financial structures: high leverage, massive debt • Equity packaged and sold-down to third party investors • Traffic consultants on big success fees (and extensive use of disclaimers) • Traffic consultants promised further work • High toll tariffs (reflecting high initial capex) • Modest time savings (especially off-peak) • Traffic calming on surface streets not delivered • Traffic demand models with all the dials turned up to 11 • Limited period modelling and reliance on (massive) expansion/annualisation factors • Key links (including target) over-capacity from Day 1. Busiest facilities in the world! • Traffic & revenue auditor dispensed with (or remit considerably reduced) • Winning bidders way out front (runners-up bunched around half of the winning forecast) 152
  • 153.
    Why? 17 ContributoryFactors... • Public sector focus = maximum upfront value extraction from concession sale • Big ticket, greenfield projects that could not be developed incrementally (tunnels) • Lots of money chasing few assets • Contractor and investment bank-led bidding consortia • Small construction industry: limited competition (and higher prices) • Aggressive financial structures: high leverage, massive debt • Equity packaged and sold-down to third party investors • Traffic consultants on big success fees (and extensive use of disclaimers) • Traffic consultants promised further work • High toll tariffs (reflecting high initial capex) • Modest time savings (especially off-peak) • Traffic calming on surface streets not delivered • Traffic demand models with all the dials turned up to 11 • Limited period modelling and reliance on (massive) expansion/annualisation factors • Key links (including target) over-capacity from Day 1. Busiest facilities in the world! • Traffic & revenue auditor dispensed with (or remit considerably reduced) • Winning bidders way out front (runners-up bunched around half of the winning forecast) 153
  • 154.
    Why? 17 ContributoryFactors... • Public sector focus = maximum upfront value extraction from concession sale • Big ticket, greenfield projects that could not be developed incrementally (tunnels) • Lots of money chasing few assets • Contractor and investment bank-led bidding consortia • Small construction industry: limited competition (and higher prices) • Aggressive financial structures: high leverage, massive debt • Equity packaged and sold-down to third party investors • Traffic consultants on big success fees (and extensive use of disclaimers) • Traffic consultants promised further work • High toll tariffs (reflecting high initial capex) • Modest time savings (especially off-peak) • Traffic calming on surface streets not delivered • Traffic demand models with all the dials turned up to 11 • Limited period modelling and reliance on (massive) expansion/annualisation factors • Key links (including target) over-capacity from Day 1. Busiest facilities in the world! • Traffic & revenue auditor dispensed with (or remit considerably reduced) • Winning bidders way out front (runners-up bunched around half of the winning forecast) 154
  • 155.
    Why? 17 ContributoryFactors... • Public sector focus = maximum upfront value extraction from concession sale • Big ticket, greenfield projects that could not be developed incrementally (tunnels) • Lots of money chasing few assets • Contractor and investment bank-led bidding consortia • Small construction industry: limited competition (and higher prices) • Aggressive financial structures: high leverage, massive debt • Equity packaged and sold-down to third party investors • Traffic consultants on big success fees (and extensive use of disclaimers) • Traffic consultants promised further work • High toll tariffs (reflecting high initial capex) • Modest time savings (especially off-peak) • Traffic calming on surface streets not delivered • Traffic demand models with all the dials turned up to 11 • Limited period modelling and reliance on (massive) expansion/annualisation factors • Key links (including target) over-capacity from Day 1. Busiest facilities in the world! • Traffic & revenue auditor dispensed with (or remit considerably reduced) • Winning bidders way out front (runners-up bunched around half of the winning forecast) 155
  • 156.
    Why? 17 ContributoryFactors... • Public sector focus = maximum upfront value extraction from concession sale • Big ticket, greenfield projects that could not be developed incrementally (tunnels) • Lots of money chasing few assets • Contractor and investment bank-led bidding consortia • Small construction industry: limited competition (and higher prices) • Aggressive financial structures: high leverage, massive debt • Equity packaged and sold-down to third party investors • Traffic consultants on big success fees (and extensive use of disclaimers) • Traffic consultants promised further work • High toll tariffs (reflecting high initial capex) • Modest time savings (especially off-peak) • Traffic calming on surface streets not delivered • Traffic demand models with all the dials turned up to 11 • Limited period modelling and reliance on (massive) expansion/annualisation factors • Key links (including target) over-capacity from Day 1. Busiest facilities in the world! • Traffic & revenue auditor dispensed with (or remit considerably reduced) • Winning bidders way out front (runners-up bunched around half of the winning forecast) 156
  • 157.
    Why? 17 ContributoryFactors... • Public sector focus = maximum upfront value extraction from concession sale • Big ticket, greenfield projects that could not be developed incrementally (tunnels) • Lots of money chasing few assets • Contractor and investment bank-led bidding consortia • Small construction industry: limited competition (and higher prices) • Aggressive financial structures: high leverage, massive debt • Equity packaged and sold-down to third party investors • Traffic consultants on big success fees (and extensive use of disclaimers) • Traffic consultants promised further work • High toll tariffs (reflecting high initial capex) • Modest time savings (especially off-peak) • Traffic calming on surface streets not delivered • Traffic demand models with all the dials turned up to 11 • Limited period modelling and reliance on (massive) expansion/annualisation factors • Key links (including target) over-capacity from Day 1. Busiest facilities in the world! • Traffic & revenue auditor dispensed with (or remit considerably reduced) • Winning bidders way out front (runners-up bunched around half of the winning forecast) 157
  • 158.
    Why? 17 ContributoryFactors... • Public sector focus = maximum upfront value extraction from concession sale • Big ticket, greenfield projects that could not be developed incrementally (tunnels) • Lots of money chasing few assets • Contractor and investment bank-led bidding consortia • Small construction industry: limited competition (and higher prices) • Aggressive financial structures: high leverage, massive debt • Equity packaged and sold-down to third party investors • Traffic consultants on big success fees (and extensive use of disclaimers) • Traffic consultants promised further work • High toll tariffs (reflecting high initial capex) • Modest time savings (especially off-peak) • Traffic calming on surface streets not delivered • Traffic demand models with all the dials turned up to 11 • Limited period modelling and reliance on (massive) expansion/annualisation factors • Key links (including target) over-capacity from Day 1. Busiest facilities in the world! • Traffic & revenue auditor dispensed with (or remit considerably reduced) • Winning bidders way out front (runners-up bunched around half of the winning forecast) 158
  • 159.
    Why? 17 ContributoryFactors... • Public sector focus = maximum upfront value extraction from concession sale • Big ticket, greenfield projects that could not be developed incrementally (tunnels) • Lots of money chasing few assets • Contractor and investment bank-led bidding consortia • Small construction industry: limited competition (and higher prices) • Aggressive financial structures: high leverage, massive debt • Equity packaged and sold-down to third party investors • Traffic consultants on big success fees (and extensive use of disclaimers) • Traffic consultants promised further work • High toll tariffs (reflecting high initial capex) • Modest time savings (especially off-peak) • Traffic calming on surface streets not delivered • Traffic demand models with all the dials turned up to 11 • Limited period modelling and reliance on (massive) expansion/annualisation factors • Key links (including target) over-capacity from Day 1. Busiest facilities in the world! • Traffic & revenue auditor dispensed with (or remit considerably reduced) • Winning bidders way out front (runners-up bunched around half of the winning forecast) 159
  • 160.
    Why? 17 ContributoryFactors... • Public sector focus = maximum upfront value extraction from concession sale • Big ticket, greenfield projects that could not be developed incrementally (tunnels) • Lots of money chasing few assets • Contractor and investment bank-led bidding consortia • Small construction industry: limited competition (and higher prices) • Aggressive financial structures: high leverage, massive debt • Equity packaged and sold-down to third party investors • Traffic consultants on big success fees (and extensive use of disclaimers) • Traffic consultants promised further work • High toll tariffs (reflecting high initial capex) • Modest time savings (especially off-peak) • Traffic calming on surface streets not delivered • Traffic demand models with all the dials turned up to 11 • Limited period modelling and reliance on (massive) expansion/annualisation factors • Key links (including target) over-capacity from Day 1. Busiest facilities in the world! • Traffic & revenue auditor dispensed with (or remit considerably reduced) • Winning bidders way out front (runners-up bunched around half of the winning forecast) 160
  • 161.
    Why? 17 ContributoryFactors... • Public sector focus = maximum upfront value extraction from concession sale • Big ticket, greenfield projects that could not be developed incrementally (tunnels) • Lots of money chasing few assets • Contractor and investment bank-led bidding consortia • Small construction industry: limited competition (and higher prices) • Aggressive financial structures: high leverage, massive debt • Equity packaged and sold-down to third party investors • Traffic consultants on big success fees (and extensive use of disclaimers) • Traffic consultants promised further work • High toll tariffs (reflecting high initial capex) • Modest time savings (especially off-peak) • Traffic calming on surface streets not delivered • Traffic demand models with all the dials turned up to 11 • Limited period modelling and reliance on (massive) expansion/annualisation factors • Key links (including target) over-capacity from Day 1. Busiest facilities in the world! • Traffic & revenue auditor dispensed with (or remit considerably reduced) • Winning bidders way out front (runners-up bunched around half of the winning forecast) 161
  • 162.
    Why? 17 ContributoryFactors... • Public sector focus = maximum upfront value extraction from concession sale • Big ticket, greenfield projects that could not be developed incrementally (tunnels) • Lots of money chasing few assets • Contractor and investment bank-led bidding consortia • Small construction industry: limited competition (and higher prices) • Aggressive financial structures: high leverage, massive debt • Equity packaged and sold-down to third party investors • Traffic consultants on big success fees (and extensive use of disclaimers) • Traffic consultants promised further work • High toll tariffs (reflecting high initial capex) • Modest time savings (especially off-peak) • Traffic calming on surface streets not delivered • Traffic demand models with all the dials turned up to 11 • Limited period modelling and reliance on (massive) expansion/annualisation factors • Key links (including target) over-capacity from Day 1. Busiest facilities in the world! • Traffic & revenue auditor dispensed with (or remit considerably reduced) • Winning bidders way out front (runners-up bunched around half of the winning forecast) 162
  • 163.
    Analysis of ContributoryFactors • 4 main categories: – Model-related – Project-related – Skewed incentives – Gaming the forecasts • Gaming the forecasts – For strategic, commercial or political gain – Forecasts are inherently contestable, so easy/obvious target! 163
  • 164.
    Analysis of ContributoryFactors • 4 main categories: – Model-related – Project-related – Skewed incentives – Gaming the forecasts • Gaming the forecasts – For strategic, commercial or political gain – Forecasts are inherently contestable, so easy/obvious target! 164
  • 165.
    Analysis of ContributoryFactors • 4 main categories: – Model-related – Project-related – Skewed incentives – Gaming the forecasts • Gaming the forecasts – For strategic, commercial, institutional or political gain – Forecasts are inherently contestable, so obvious/easy target! 165
  • 166.
    Who’s the BadGuy? • The private sector is often painted as the bad guy – ...but the public sector has its moments! • Recent commission (review public sector forecasts) – Initial feedback - forecasts = too high - not well received – Suspicions that BCR was being propped-up by the (high) forecasts – My suggested numbers removed from final report – Final report not made public – Business case not made public – Forecasts • Public sector consultants: 65-70,000 vehicles/day • Independent review team: 35-55,000 vehicles/day • Politician: 80-100,000 vehicles/day!! – Project opponents vilified in the press • Despite focus on process, not project • Accusations of “analysis paralysis” • Public sector forecasts regularly regarded as ‘floor’ – ...or hurdle for private sector to beat – Often = the root cause of the problem 166
  • 167.
    Who’s the BadGuy? • The private sector is often painted as the bad guy – ...but the public sector has its moments! • Recent commission (review public sector forecasts) – Initial feedback - forecasts = too high - not well received – Suspicions that BCR was being propped-up by the (high) forecasts – My suggested numbers removed from final report – Final report not made public – Business case not made public – Forecasts • Public sector consultants: 65-70,000 vehicles/day • Independent review team: 35-55,000 vehicles/day • Politician: 80-100,000 vehicles/day!! – Project opponents vilified in the press • Despite focus on process, not project • Accusations of “analysis paralysis” • Public sector forecasts regularly regarded as ‘floor’ – ...or hurdle for private sector to beat – Often = the root cause of the problem 167
  • 168.
    Who’s the BadGuy? • The private sector is often painted as the bad guy – ...but the public sector has its moments! • Recent commission (review public sector forecasts) – Initial feedback - forecasts = too high - not well received – Suspicions that BCR was being propped-up by the (high) forecasts – My suggested numbers removed from final report – Final report not made public – Business case not made public – Forecasts • Public sector consultants: 65-70,000 vehicles/day • Independent review team: 35-55,000 vehicles/day • Politician: 80-100,000 vehicles/day!! – Project opponents vilified in the press • Despite focus on process, not project • Accusations of “analysis paralysis” • Public sector forecasts regularly regarded as ‘floor’ – ...or hurdle for private sector to beat – Often = the root cause of the problem 168
  • 169.
    Who’s the BadGuy? • The private sector is often painted as the bad guy – ...but the public sector has its moments! • Recent commission (review public sector forecasts) – Initial feedback - forecasts = too high - not well received – Suspicions that BCR was being propped-up by the (high) forecasts – My suggested numbers removed from final report – Final report not made public – Business case not made public – Forecasts • Public sector consultants: 65-70,000 vehicles/day • Independent review team: 35-55,000 vehicles/day • Politician: 80-100,000 vehicles/day!! – Project opponents vilified in the press • Despite focus on process, not project • Accusations of “analysis paralysis” • Public sector forecasts regularly regarded as ‘floor’ – ...or hurdle for private sector to beat – Often = the root cause of the problem 169
  • 170.
    Solution? • Disclosure andtransparency? • Adjust/correct the incentives? • Checks and balances to reduce the scope for influence? • Take the pressure off the forecasts? • ...or a mix of all 4? • What do you think? 170