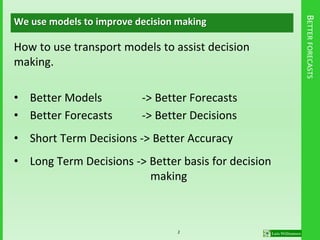
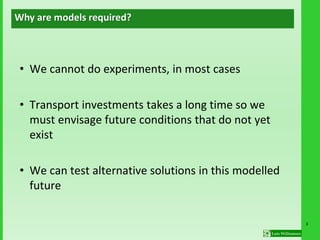
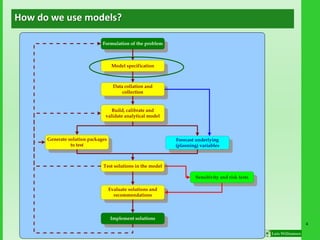
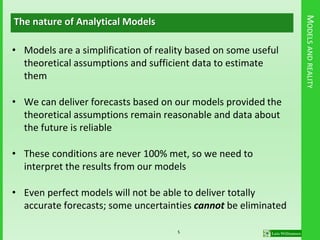
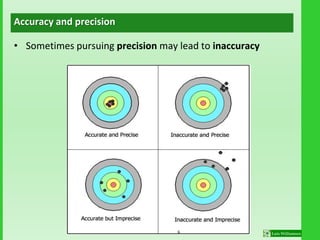
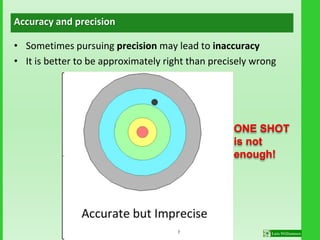
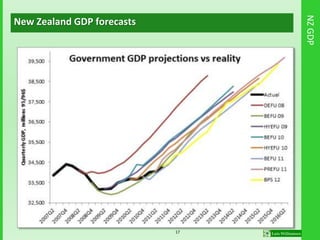
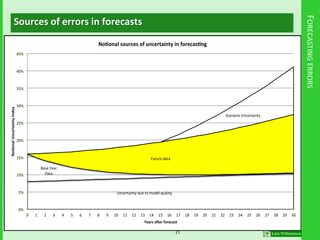
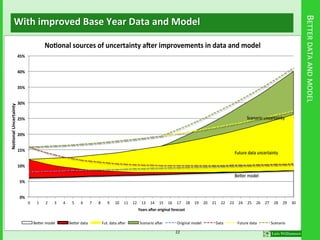
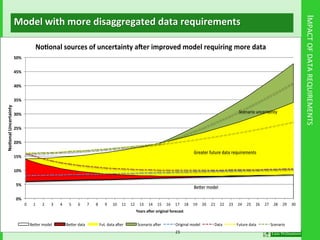
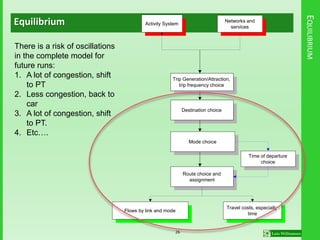
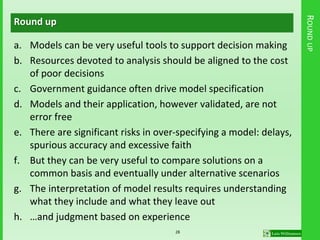
ROLE OF TRANSPORT MODELLING
Luis Willumsen
How to use Transport Models to assist
decision making; assumptions and constraints
Managing Transport Modelling
BETTERFORECASTS
We use models to improve decision making
How to use transport models to assist decision
making.
• Better Models -> Better Forecasts
• Better Forecasts -> Better Decisions
• Short Term Decisions -> Better Accuracy
• Long Term Decisions -> Better basis for decision
making
2
3
• We cannot do experiments, in most cases
• Transport investments takes a long time so we
must envisage future conditions that do not yet
exist
• We can test alternative solutions in this modelled
future
Why are models required?
4
Formulation of the problem
Test solutions in the model
Forecast underlying
(planning) variables
Generate solution packages
to test
Build, calibrate and
validate analytical model
Data collation and
collection
Model specification
Implement solutions
Evaluate solutions and
recommendations
Sensitivity and risk tests
How do we use models?
MODELSANDREALITY
The nature of Analytical Models
• Models are a simplification of reality based on some useful
theoretical assumptions and sufficient data to estimate
them
• We can deliver forecasts based on our models provided the
theoretical assumptions remain reasonable and data about
the future is reliable
• These conditions are never 100% met, so we need to
interpret the results from our models
• Even perfect models will not be able to deliver totally
accurate forecasts; some uncertainties cannot be eliminated
5
Accuracy and precision
• Sometimes pursuing precision may lead to inaccuracy
6
Accuracy and precision
• Sometimes pursuing precision may lead to inaccuracy
• It is better to be approximately right than precisely wrong
ONE SHOT
is not
enough!
7
8
MODELOBJECTIVES
 Assessing options
• Scheme testing
• Policy testing
 Assessing impacts
• Traffic and congestion
• Economic (user, non-user benefits)
• Financial (revenue)
• Environmental (CO2, NOX emissions), Safety (accidents)
• Performance
• Equity: winners and losers
 Forecasting usage (patronage, traffic levels etc.)
Where models can help
9
MODELSPECIFICATION
 Need to understand and define the problem
 Have an idea of the possible solutions
 What are the main behavioural responses to these
solutions
 Resources Available: Time and Budgets, Data, Software,
Skills
 The costs of “getting it wrong”
 Important to identify what the model should be able to
do
 And what the model will NOT be able to do
 Interpretation and post modelling adjustments are fair
How to specify a Model
10
MODELDESIGNSTEPS
 Scope of the model
 Area to be covered
 Behavioural responses to be included
 Government standards (WebTag, etc.)
 Data available
 Data to be collected
 Calibration/validation to be conducted of various stages
 Sensitivity Tests to be carried out
 The resources spent in modelling and analysis should be
related to the cost of a wrong decision
Model design steps
11
Source: ptv
AREATOBECOVERED
Directly related to the scope of
the model
Also related to the
understanding travel patterns
Type of study, strategic or
tactical
How much detail is needed for
route choice and other
responses
Area to be covered and level of detail
12
RESPONSES
• Typical 4/5 stage model
response. Change in:
• Number of trips
• Destination
• Mode used
• Time of travel
• Route used
• Generally
• Small area models with
network issues –route
choice and assignment
only
• PT models – Mode Choice
very important
• Strategic Models – All
responses
Activity System
Networks and
services
Trip Generation/Attraction,
trip frequency choice
Destination choice
Mode choice
Route choice and
assignment
Flows by link and mode
Travel costs, especially
time
Time of departure
choice
Responses to include
13
DATAAVAILABILITY
Data is the key in any model development task
Each response model requires different data; always look for
what is already available
Previous studies, Census data, National Database, etc.
If no other study specific data is available then essential to
carry out surveys, most commonly:
Traffic Counts, Bus, Rail, Metro occupancy surveys/boarding-alighting
counts, Intercept surveys: Road Side Interviews and PT user OD
surveys, Travel time and service quality surveys
A rich source of travel user behaviour is a detailed Household
Interviews (HHI) or Household Travel Surveys (HTS) including a
Travel Diary; generally a 1% to 2% sample.
Data availability
New sensors and probes:
• Radar, loops
• CCTV
• ANPR
• SmartCards
• Transponders/Tags
• Bluetooth
• WiFi & Others
• GPS
• Mobile phones
The future is BRIGHT with new sources of mobility data
14
15
ESTIMATION,CALIBRATIONANDVALIDATIONOFMODEL
Three distinct aspects of model design:
• Calibration of a model is finding the best values for its
parameters
• Model estimation reflects the fact that the functional form
is not decided before hand in some cases
• Model Validation follows post estimation and tests the
model against data not used in calibration; backcasting is
ideal but seldom possible
Means different things for different response models
Demand model elements: total demand, Trip Length Distribution, mode
shares: compared against observed totals
Assignment model: Traffic flows, Boarding Alighting, Patronage
Calibration, Estimation and Validation
DATAERRORS
Sources of error: Data and ……. Models
• Base Year Data errors: Poor and small sample, limited data
for calibration/validation;
• Better methods and QA would reduce these errors
• Future Data errors in the input variables are unavoidable;
typically
• GDP, Population, employment Growth
• Key inputs like fuel prices, fares of competing modes
• Parameter changes: willingness to pay, Values of Time; fixed
tastes assumptions
• And also future Scenarios (not entirely under control)
• New Developments that do/do not materialise
• Competing facilities that DO materialise
• New disruptive technologies
16
NZGDP
New Zealand GDP forecasts
17
SPECIFICATIONERRORS
Sources of error: Model specification
• Bad modelling
• Poor sensitivity to price, too aggregate Values of Time
• Poor models of delay, crowding
• Ignoring relevant behavioural responses
• Including irrelevant behavioural responses
• Overconfidence in the model and its implicit assumptions
(that are never 100% right!):
• Users have perfect information and can process it efficiently
• Users respond instantly to changes
• Etc….
• Over specifying the model: unrealistic precision
18
Consider a modelling effort with 30 years planning horizon
 Base year data is obtained the usual way (2-3 % HH survey
plus some intercept, travel time and service surveys plus
counts);
 Model is calibrated/estimated for year 0;
 …and then applied for future periods, say every 10 years;
 Using projected planning data (GDP, population,
employment, etc. allocated over time and space);
 ..and some assumptions about changes in the technologies,
networks, competitors, economic regeneration, etc.
19
ERRORSINFORECASTS
Sources of errors in forecasts
 The model. It is simplified, ignores some behavioural
responses, network is not perfect, assumes constant
parameters, etc. It is likely to be even more uncertain as time
progresses
 Base year data: small sample, on certain days, blended with
distribution/destination choice models to produce semi-
synthetic matrices: declining influence
 Future year data: uncertainty grows over time horizon; gets
more uncertain the more granular (disaggregated) it is:
increasing influence
 Scenario uncertainty: the elements we do not influence and
cannot fully predict: competitors in a PPP, success of land
use planning and control, policy changes, disruptive
technologies: increases over time
20
FORECASTINGERRORS
Sources of errors in forecasts
Uncertainty due to model quality
Base Year
Data
Future data
Scenario Uncertainty
0%
5%
10%
15%
20%
25%
30%
35%
40%
45%
0 1 2 3 4 5 6 7 8 9 10 11 12 13 14 15 16 17 18 19 20 21 22 23 24 25 26 27 28 29 30
NoonalUncertaintyIndex
Years a er forecast
No onal sources of uncertainty in forecas ng
21
BETTERDATAANDMODEL
With improved Base Year Data and Model
0%
5%
10%
15%
20%
25%
30%
35%
40%
45%
0 1 2 3 4 5 6 7 8 9 10 11 12 13 14 15 16 17 18 19 20 21 22 23 24 25 26 27 28 29 30
NoonalUncertainty
Years a er original forecast
No onal sources of uncertainty a er improvements in data and model
Be er model Be er data Fut. data a er Scenario a er Original model Data Future data Scenario
Scenario uncertainty
Future data uncertainty
Be er model
22
IMPACTOFDATAREQUIREMENTS
Model with more disaggregated data requirements
0%
5%
10%
15%
20%
25%
30%
35%
40%
45%
50%
0 1 2 3 4 5 6 7 8 9 10 11 12 13 14 15 16 17 18 19 20 21 22 23 24 25 26 27 28 29 30
NoonalUncertainty
Years a er original forecast
No onal sources of uncertainty a er improved model requiring more data
Be er model Be er data Fut. data a er Scenario a er Original model Data Future data Scenario
Scenario uncertainty
Greater future data requirements
Be er model
23
MODELSANDEQUILIBRIUM
A model is always a simplification of reality
Some simplifications make our life easier, others are essential
Take Route Choice and Assignment
We model it as a steady state phenomenon: all vehicles clear
the network during the modelled (peak) period.
The software finds a solution with an iterative process until
“equilibrium” is reached:
Wardrop’s Equilibrium:
Under equilibrium conditions traffic arranges itself in congested
networks in such a way that no individual trip maker can reduce
his path costs by switching routes
Certain conditions with respect of the relationship between
flow and travel time must be met to achieve this equilibrium
24
Issues
• If equilibrium of routes and costs is not reached the flows
(and costs) depend on when do we stop the iterative process
• This may affect our choice of scheme
• However, reality is never in “equilibrium”
• Noise in traffic (empty taxis, delivery vehicles, cruisers, lost)
• Noise in the network: stalled vehicles, rain, poor light, roadworks
• Day-to-day variability in the trip matrices
• Moreover, the better we represent delays at junctions, the
more difficult (and sometimes impossible) it is to ensure
“equilibrium”.
25
EQUILIBRIUM
Equilibrium Activity System
Networks and
services
Trip Generation/Attraction,
trip frequency choice
Destination choice
Mode choice
Route choice and
assignment
Flows by link and mode
Travel costs, especially
time
Time of departure
choice
There is a risk of oscillations
in the complete model for
future runs:
1. A lot of congestion, shift
to PT
2. Less congestion, back to
car
3. A lot of congestion, shift
to PT.
4. Etc….
26
10MESSAGES
Ten messages to take with you
1. You may outsource the Model
but not the Planning/Decision
Making
2. Engage in Model Specification,
Develop/retain capacity to
interpret results, protect and
transfer acquired knowledge
3. In specifying the model focus
on What Matters; do not aim
for the academic ideal
4. Decide how will you deal with
the inevitable uncertainties
5. What assumptions were made
in the model build? What
assumptions are made about
the future in the application?
6. Do results make sense? Check
model results by other means (e.g.
back of envelope calculations)
7. The model will be audited: good
documentation & transparency
essential; better if peer-reviewed
throughout
8. Model results will be used in a
wider context and by other
disciplines; avoid intellectual
imperialism
9. Is the model WebTAG compliant?
If not, does it matter and how
does it impact its reliability?
10. Has the model been validated
through alternative techniques to
WebTAG, e.g. benchmarking?
27
ROUNDUP
Round up
a. Models can be very useful tools to support decision making
b. Resources devoted to analysis should be aligned to the cost
of poor decisions
c. Government guidance often drive model specification
d. Models and their application, however validated, are not
error free
e. There are significant risks in over-specifying a model: delays,
spurious accuracy and excessive faith
f. But they can be very useful to compare solutions on a
common basis and eventually under alternative scenarios
g. The interpretation of model results requires understanding
what they include and what they leave out
h. …and judgment based on experience
28
THANK YOU
29

Transport Modelling for managers 2014 willumsen

  • 1.
    ROLE OF TRANSPORTMODELLING Luis Willumsen How to use Transport Models to assist decision making; assumptions and constraints Managing Transport Modelling
  • 2.
    BETTERFORECASTS We use modelsto improve decision making How to use transport models to assist decision making. • Better Models -> Better Forecasts • Better Forecasts -> Better Decisions • Short Term Decisions -> Better Accuracy • Long Term Decisions -> Better basis for decision making 2
  • 3.
    3 • We cannotdo experiments, in most cases • Transport investments takes a long time so we must envisage future conditions that do not yet exist • We can test alternative solutions in this modelled future Why are models required?
  • 4.
    4 Formulation of theproblem Test solutions in the model Forecast underlying (planning) variables Generate solution packages to test Build, calibrate and validate analytical model Data collation and collection Model specification Implement solutions Evaluate solutions and recommendations Sensitivity and risk tests How do we use models?
  • 5.
    MODELSANDREALITY The nature ofAnalytical Models • Models are a simplification of reality based on some useful theoretical assumptions and sufficient data to estimate them • We can deliver forecasts based on our models provided the theoretical assumptions remain reasonable and data about the future is reliable • These conditions are never 100% met, so we need to interpret the results from our models • Even perfect models will not be able to deliver totally accurate forecasts; some uncertainties cannot be eliminated 5
  • 6.
    Accuracy and precision •Sometimes pursuing precision may lead to inaccuracy 6
  • 7.
    Accuracy and precision •Sometimes pursuing precision may lead to inaccuracy • It is better to be approximately right than precisely wrong ONE SHOT is not enough! 7
  • 8.
    8 MODELOBJECTIVES  Assessing options •Scheme testing • Policy testing  Assessing impacts • Traffic and congestion • Economic (user, non-user benefits) • Financial (revenue) • Environmental (CO2, NOX emissions), Safety (accidents) • Performance • Equity: winners and losers  Forecasting usage (patronage, traffic levels etc.) Where models can help
  • 9.
    9 MODELSPECIFICATION  Need tounderstand and define the problem  Have an idea of the possible solutions  What are the main behavioural responses to these solutions  Resources Available: Time and Budgets, Data, Software, Skills  The costs of “getting it wrong”  Important to identify what the model should be able to do  And what the model will NOT be able to do  Interpretation and post modelling adjustments are fair How to specify a Model
  • 10.
    10 MODELDESIGNSTEPS  Scope ofthe model  Area to be covered  Behavioural responses to be included  Government standards (WebTag, etc.)  Data available  Data to be collected  Calibration/validation to be conducted of various stages  Sensitivity Tests to be carried out  The resources spent in modelling and analysis should be related to the cost of a wrong decision Model design steps
  • 11.
    11 Source: ptv AREATOBECOVERED Directly relatedto the scope of the model Also related to the understanding travel patterns Type of study, strategic or tactical How much detail is needed for route choice and other responses Area to be covered and level of detail
  • 12.
    12 RESPONSES • Typical 4/5stage model response. Change in: • Number of trips • Destination • Mode used • Time of travel • Route used • Generally • Small area models with network issues –route choice and assignment only • PT models – Mode Choice very important • Strategic Models – All responses Activity System Networks and services Trip Generation/Attraction, trip frequency choice Destination choice Mode choice Route choice and assignment Flows by link and mode Travel costs, especially time Time of departure choice Responses to include
  • 13.
    13 DATAAVAILABILITY Data is thekey in any model development task Each response model requires different data; always look for what is already available Previous studies, Census data, National Database, etc. If no other study specific data is available then essential to carry out surveys, most commonly: Traffic Counts, Bus, Rail, Metro occupancy surveys/boarding-alighting counts, Intercept surveys: Road Side Interviews and PT user OD surveys, Travel time and service quality surveys A rich source of travel user behaviour is a detailed Household Interviews (HHI) or Household Travel Surveys (HTS) including a Travel Diary; generally a 1% to 2% sample. Data availability
  • 14.
    New sensors andprobes: • Radar, loops • CCTV • ANPR • SmartCards • Transponders/Tags • Bluetooth • WiFi & Others • GPS • Mobile phones The future is BRIGHT with new sources of mobility data 14
  • 15.
    15 ESTIMATION,CALIBRATIONANDVALIDATIONOFMODEL Three distinct aspectsof model design: • Calibration of a model is finding the best values for its parameters • Model estimation reflects the fact that the functional form is not decided before hand in some cases • Model Validation follows post estimation and tests the model against data not used in calibration; backcasting is ideal but seldom possible Means different things for different response models Demand model elements: total demand, Trip Length Distribution, mode shares: compared against observed totals Assignment model: Traffic flows, Boarding Alighting, Patronage Calibration, Estimation and Validation
  • 16.
    DATAERRORS Sources of error:Data and ……. Models • Base Year Data errors: Poor and small sample, limited data for calibration/validation; • Better methods and QA would reduce these errors • Future Data errors in the input variables are unavoidable; typically • GDP, Population, employment Growth • Key inputs like fuel prices, fares of competing modes • Parameter changes: willingness to pay, Values of Time; fixed tastes assumptions • And also future Scenarios (not entirely under control) • New Developments that do/do not materialise • Competing facilities that DO materialise • New disruptive technologies 16
  • 17.
  • 18.
    SPECIFICATIONERRORS Sources of error:Model specification • Bad modelling • Poor sensitivity to price, too aggregate Values of Time • Poor models of delay, crowding • Ignoring relevant behavioural responses • Including irrelevant behavioural responses • Overconfidence in the model and its implicit assumptions (that are never 100% right!): • Users have perfect information and can process it efficiently • Users respond instantly to changes • Etc…. • Over specifying the model: unrealistic precision 18
  • 19.
    Consider a modellingeffort with 30 years planning horizon  Base year data is obtained the usual way (2-3 % HH survey plus some intercept, travel time and service surveys plus counts);  Model is calibrated/estimated for year 0;  …and then applied for future periods, say every 10 years;  Using projected planning data (GDP, population, employment, etc. allocated over time and space);  ..and some assumptions about changes in the technologies, networks, competitors, economic regeneration, etc. 19
  • 20.
    ERRORSINFORECASTS Sources of errorsin forecasts  The model. It is simplified, ignores some behavioural responses, network is not perfect, assumes constant parameters, etc. It is likely to be even more uncertain as time progresses  Base year data: small sample, on certain days, blended with distribution/destination choice models to produce semi- synthetic matrices: declining influence  Future year data: uncertainty grows over time horizon; gets more uncertain the more granular (disaggregated) it is: increasing influence  Scenario uncertainty: the elements we do not influence and cannot fully predict: competitors in a PPP, success of land use planning and control, policy changes, disruptive technologies: increases over time 20
  • 21.
    FORECASTINGERRORS Sources of errorsin forecasts Uncertainty due to model quality Base Year Data Future data Scenario Uncertainty 0% 5% 10% 15% 20% 25% 30% 35% 40% 45% 0 1 2 3 4 5 6 7 8 9 10 11 12 13 14 15 16 17 18 19 20 21 22 23 24 25 26 27 28 29 30 NoonalUncertaintyIndex Years a er forecast No onal sources of uncertainty in forecas ng 21
  • 22.
    BETTERDATAANDMODEL With improved BaseYear Data and Model 0% 5% 10% 15% 20% 25% 30% 35% 40% 45% 0 1 2 3 4 5 6 7 8 9 10 11 12 13 14 15 16 17 18 19 20 21 22 23 24 25 26 27 28 29 30 NoonalUncertainty Years a er original forecast No onal sources of uncertainty a er improvements in data and model Be er model Be er data Fut. data a er Scenario a er Original model Data Future data Scenario Scenario uncertainty Future data uncertainty Be er model 22
  • 23.
    IMPACTOFDATAREQUIREMENTS Model with moredisaggregated data requirements 0% 5% 10% 15% 20% 25% 30% 35% 40% 45% 50% 0 1 2 3 4 5 6 7 8 9 10 11 12 13 14 15 16 17 18 19 20 21 22 23 24 25 26 27 28 29 30 NoonalUncertainty Years a er original forecast No onal sources of uncertainty a er improved model requiring more data Be er model Be er data Fut. data a er Scenario a er Original model Data Future data Scenario Scenario uncertainty Greater future data requirements Be er model 23
  • 24.
    MODELSANDEQUILIBRIUM A model isalways a simplification of reality Some simplifications make our life easier, others are essential Take Route Choice and Assignment We model it as a steady state phenomenon: all vehicles clear the network during the modelled (peak) period. The software finds a solution with an iterative process until “equilibrium” is reached: Wardrop’s Equilibrium: Under equilibrium conditions traffic arranges itself in congested networks in such a way that no individual trip maker can reduce his path costs by switching routes Certain conditions with respect of the relationship between flow and travel time must be met to achieve this equilibrium 24
  • 25.
    Issues • If equilibriumof routes and costs is not reached the flows (and costs) depend on when do we stop the iterative process • This may affect our choice of scheme • However, reality is never in “equilibrium” • Noise in traffic (empty taxis, delivery vehicles, cruisers, lost) • Noise in the network: stalled vehicles, rain, poor light, roadworks • Day-to-day variability in the trip matrices • Moreover, the better we represent delays at junctions, the more difficult (and sometimes impossible) it is to ensure “equilibrium”. 25
  • 26.
    EQUILIBRIUM Equilibrium Activity System Networksand services Trip Generation/Attraction, trip frequency choice Destination choice Mode choice Route choice and assignment Flows by link and mode Travel costs, especially time Time of departure choice There is a risk of oscillations in the complete model for future runs: 1. A lot of congestion, shift to PT 2. Less congestion, back to car 3. A lot of congestion, shift to PT. 4. Etc…. 26
  • 27.
    10MESSAGES Ten messages totake with you 1. You may outsource the Model but not the Planning/Decision Making 2. Engage in Model Specification, Develop/retain capacity to interpret results, protect and transfer acquired knowledge 3. In specifying the model focus on What Matters; do not aim for the academic ideal 4. Decide how will you deal with the inevitable uncertainties 5. What assumptions were made in the model build? What assumptions are made about the future in the application? 6. Do results make sense? Check model results by other means (e.g. back of envelope calculations) 7. The model will be audited: good documentation & transparency essential; better if peer-reviewed throughout 8. Model results will be used in a wider context and by other disciplines; avoid intellectual imperialism 9. Is the model WebTAG compliant? If not, does it matter and how does it impact its reliability? 10. Has the model been validated through alternative techniques to WebTAG, e.g. benchmarking? 27
  • 28.
    ROUNDUP Round up a. Modelscan be very useful tools to support decision making b. Resources devoted to analysis should be aligned to the cost of poor decisions c. Government guidance often drive model specification d. Models and their application, however validated, are not error free e. There are significant risks in over-specifying a model: delays, spurious accuracy and excessive faith f. But they can be very useful to compare solutions on a common basis and eventually under alternative scenarios g. The interpretation of model results requires understanding what they include and what they leave out h. …and judgment based on experience 28
  • 29.