This document summarizes research on the inaccuracies in transportation planning models' traffic forecasts that are used for major capital infrastructure decisions. It finds that forecasts are often inaccurate, with actual traffic volumes being significantly different than what was predicted.
It then examines factors that can contribute to these forecasting inaccuracies, such as uncertainties in inputs, model specification errors, and models not adequately accounting for things like induced demand and land use impacts.
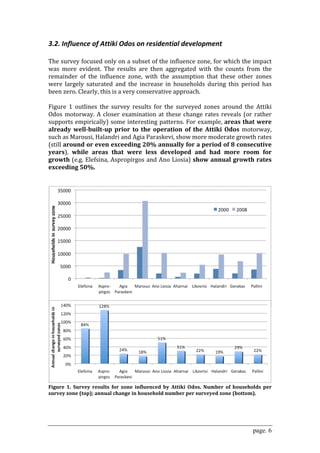
The document presents a case study analyzing changes in land use and traffic patterns near the Attiki Odos motorway in Athens, Greece, finding that the new infrastructure project led to greater development and additional generated traffic beyond what was originally forecasted.