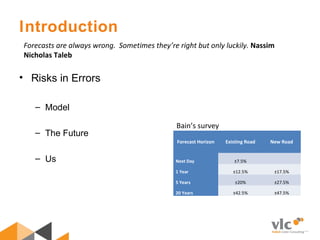
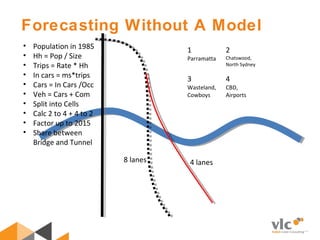
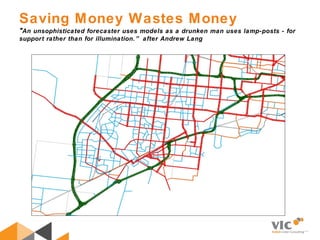
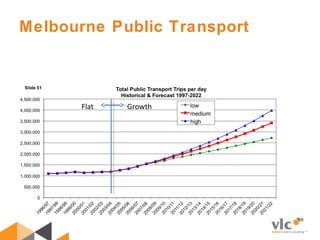
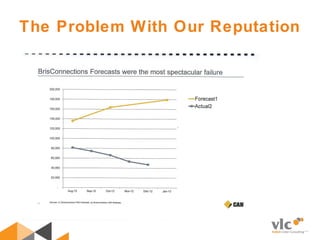
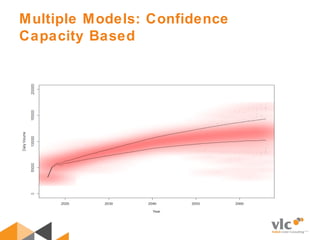
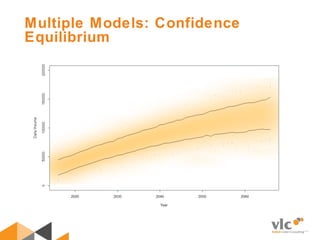
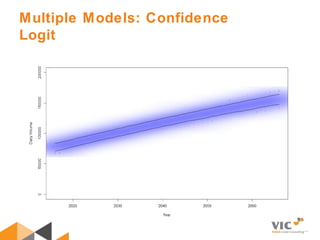
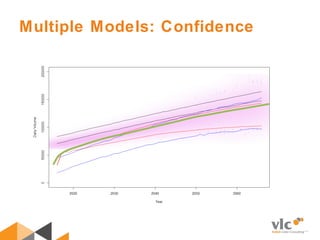
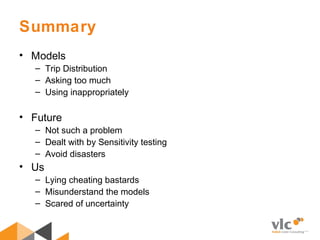
Transport Demand
Forecasting
A Review of the Risks
13 August 2015
13 August 2015
“The Commanding General is well aware that the
forecasts are no good. However, he needs them for
planning purposes.”
Memo to Ken Arrow after his warnings on the
unreliability of forecasts.
Introduction
Forecasts are always wrong. Sometimes they’re right but only luckily. Nassim
Nicholas Taleb
• Risks in Errors
– Model
– The Future
– Us
Forecast Horizon Existing Road New Road
Next Day ±7.5%
 
1 Year ±12.5% ±17.5%
5 Years ±20% ±27.5%
20 Years ±42.5% ±47.5%
Bain’s survey
Forecasting Without A Model
1
Parramatta
2
Chatswood, 
North Sydney
3
Wasteland, 
Cowboys
4
CBD, 
Airports 
8 lanes 4 lanes
• Population in 1985
• Hh = Pop / Size
• Trips = Rate * Hh
• In cars = ms*trips
• Cars = In Cars /Occ
• Veh = Cars + Com
• Split into Cells
• Calc 2 to 4 + 4 to 2
• Factor up to 2015
• Share between 
Bridge and Tunnel
The Devil In the Detail
“There is no such uncertainty as a sure thing.” Robert Burns, poet
This Link
This Intersection
•matrix estimation is a system of simultaneous equations
•about 400,000 equations and at least 3.2 million unknowns  
•there are more than 2x10500
 ways that this system of equations can be solved  
VITM (Victorian Integrated Transport Model):
 • 2900 Zone
•Each trip matrix therefore has more than 8.4 million cells;
•More than 681 million cells in the model
•    30,000 nodes and 45,000 links = 300,000 turning 
movements
Trip Distribution
“Forecasting traffic patterns is a relatively simple exercise. Motorists will almost 
always take the most efficient route between two single points. ” 
Vesna Poljak, Australian Financial Review
Matrices
“The trouble with the future is that there are so many of them.” Niels
Bohr, Physicist
Saving Money Wastes Money
"An unsophisticated forecaster uses models as a drunken man uses lamp-posts - for
support rather than for illumination.” after Andrew Lang
Mistake 3 – Saving Money Wastes
Money
 
Original  Refined  % Difference 
Crossing 
Point   Inbound  Outbound  Inbound  Outbound  Inbound  Outbound 
1  11,800  12,300  12,800  15,500  8%  26% 
2  2,800  3,500  2,100  2,800  -25%  -20% 
3  5,600  5,100  5,200  5,000  -7%  -2% 
4  10,300  10,500  10,400  10,800  1%  3% 
5  6,500  2,200  4,400  2,200  -32%  0% 
6  10,600  12,000  25,100  24,200  137%  102% 
7  15,800  16,200  5,000  4,900  -68%  -70% 
8  18,900  19,700  31,400  30,800  66%  56% 
9  10,200  11,300  11,400  12,800  12%  13% 
10  17,600  20,200  17,700  20,400  1%  1% 
11  22,700  22,800  30,500  32,000  34%  40% 
12  7,400  8,100  7,200  6,500  -3%  -20% 
13  7,300  7,500  10,200  10,400  40%  39% 
14  27,900  27,600  30,900  26,400  11%  -4% 
15  5,200  5,800  3,200  4,200  -38%  -28% 
16  5,200  6,600  4,900  5,700  -6%  -14% 
17  14,300  14,600  19,600  21,700  37%  49% 
18  24,000  24,800  18,000  17,200  -25%  -31% 
19  26,100  23,900  34,600  33,700  33%  41% 
20  14,400  13,500  34,900  33,800  142%  150% 
21  16,900  20,800  11,500  11,900  -32%  -43% 
22  2,400  2,700  2,900  3,000  21%  11% 
23  13,500  12,500  17,300  20,100  28%  61% 
24  300  400  100  100  -67%  -75% 
25  8,900  7,900  5,500  4,600  -38%  -42% 
26  8,200  7,900  7,500  8,500  -9%  8% 
27  14,500  13,400  25,200  27,100  74%  102% 
Total  329,300  333,800  389,500  396,300  18%  19% 
Errors Compounded
“Any man whose errors take ten years to correct is quite a man” J
Robert Oppenheimer, Physicist
The Future
• “I have seen the future and it is like the present, only
longer.” Kehlogg Albran
• “I have seen the future and it doesn't work.” Robert Fulford
Searching for the Past
Forecasting is like driving along an unknown road, in the dark, looking
out the back window. Peter de Vries, New Yorker
Searching for the Past
THE JOMET STUDY50km
70km
JOMET – The Johannesburg
Metropolitan Planning for 2000
Most Likely Scenario
Assumptions
JOMET - Forecast v Actual
Forecast
(2005)
Estimated*
(2005)
Error
(%)
Population 4,695 5,520 -15%
Employment 1,167 1,164 0%
* From Johannesburg City Council estimates
Forecasts of inputs for the JOMET area
compared to the outcomes in thousands
Forecast
(2005)
Actual
(2002)
Estimated
(2005)
Error
(%)
Car 621,000 581,000 610,400 -2%
Public
Transport
558,000 510,900 552,300 -1%
Forecasts of morning peak trips for the JOMET
area compared to the outcomes
Sydney Area Transport Study
Forecast
(2000)
Actual
(2001)
Error
(%)
Population 4,286 3755 14%
Employment 1,910 1,820 5%
Forecasts of inputs for the Sydney
metropolitan area compared to the
outcomes
Forecast
(2000)
Actual
(2001)
Error
(%)
Home Based 9,878 9,000 10%
Non Home Based 1,273 4,154 -69%
Total 11,151 13,154 -15%
Forecasts of daily trips in the Sydney Area
Transport Study compared to the outcomes in
thousands
Sydney Area Transport Study
Forecast
(2000)
Actual
(2001)
Error
(%)
Manufacture 550 208 164%
Commerce/Finance/Property 458 470 -3%
Services/Public Service 615 843 -27%
Transport/Communication 134 145 -8%
Building/Construction 115 139 -17%
Other 38 15 153%
Total 1910 1820 5%
Forecasts of employment by industry
compared to the outcomes
Forecast
(2000)
Actual
(2001)
Error
(%)
Office 892 735 21%
Industrial 580 342 70%
Transportation and
Communication
95 301 -68%
Sales and Service 305 348 -12%
Other 38 94 -60%
Total 1910 1820 5%
Forecasts of employment by industry
compared to the outcomes
Sydney Area Transport Study
Melbourne Public Transport
• Fuel prices were irregular, but increasing and interest
rates were relatively high and climbing
Melbourne Public Transport
Flat Growth
Melbourne Public Transport
What they did right
• Forecast at an aggregate level
• Used models as a means to an end, not an end
• Asked the models the right questions
• Used sensitivities and/or multiple models
• Modern models are under greater expectations
Far better an approximate answer to
the right question, which is often
vague, than an exact answer to the
wrong question, which can always be
made precise. John W Tukey
The Problem With US
Submission to Infrastructure Australia’s Symposium into
Traffic Forecasting for Toll Roads
“The real issue here is that it if a developer wants to take an optimistic view of the future
and ask his traffic advisor to prepare forecasts on the basis of these optimistic
assumptions, it is not the fault of the advisor that the forecasts are ‘high’”.
Flyvbjerg
“… planners lie with numbers. Planners on the dark side are busy, not with getting forecasts
right and following an ethical path, but with getting projects funded and built. The most
effective planner is sometimes the one who can cloak advocacy in the guise of scientific or
technical rationality.”
Bain
“To knowingly inflate traffic and revenue projections is an act of deception – but it is
not alone in that regard. Investors reviewing toll road studies should remain alert to
two other potential acts of deceit.”
Introduction
• Patronage forecasting -- Why do it ?
• The risk of being wrong is high and the impact on
reputation is bad
Is there a “right” forecast?
No! Forecasts need to be tailored to a purpose
– high for impact assessment
– low for CBA
– high for owners to win a PPP deal
– low for lenders
The Problem With Our Reputation
•Looking for a Practitioner’s Remedy
•Forecasts are not just reasonable but SEEN to be reasonable
•Provides alternative outcomes forecasting
•Understand the mechanics of the different models in order to forecast
successfully
•A way to understand more deeply the complex interactions that
contribute to transport demand in the future
A Solution
"You don't drown by falling in the water; you
drown by staying there."
Edwin Louis Cole
Reporting the Weather
The Aftermath
AFTER
BEFORE
Multiple Models: Confidence
Strategic Model
“If you have to forecast, forecast often.”
Edgar Fiedler
Multiple Models: Confidence
Capacity Based
Multiple Models: Confidence
Equilibrium
Multiple Models: Confidence
Logit
Multiple Models: Confidence
Summary
• Models
– Trip Distribution
– Asking too much
– Using inappropriately
• Future
– Not such a problem
– Dealt with by Sensitivity testing
– Avoid disasters
• Us
– Lying cheating bastards
– Misunderstand the models
– Scared of uncertainty
The Computer Says “No!”
FROM TO
"Chicken guts are hard to read and invite flights of fancy or
corruption.” Ian Hacking, Philosopher
Forecasting can make you look stupid
• It will be years – not in my time – before a woman will become Prime
Minister.
– Margaret Thatcher
• With over fifteen types of foreign cars already on sale here, the Japanese auto
industry isn't likely to carve out a big share of the market for itself.
– Businessweek, August 2, 1968
• X-rays will prove to be a hoax.
– Lord Kelvin, President of the Royal Society, 1883
• There's no chance that the iPhone is going to get any significant market share.
– Steve Ballmer, USA Today, April 30, 2007
• Who the hell wants to hear actors talk?
• H. M. Warner, Warner Brothers, 1927
AITPM Transport Demand Forecasting

AITPM Transport Demand Forecasting

  • 1.
    Transport Demand Forecasting A Reviewof the Risks 13 August 2015
  • 2.
    13 August 2015 “TheCommanding General is well aware that the forecasts are no good. However, he needs them for planning purposes.” Memo to Ken Arrow after his warnings on the unreliability of forecasts.
  • 3.
    Introduction Forecasts are alwayswrong. Sometimes they’re right but only luckily. Nassim Nicholas Taleb • Risks in Errors – Model – The Future – Us Forecast Horizon Existing Road New Road Next Day ±7.5%   1 Year ±12.5% ±17.5% 5 Years ±20% ±27.5% 20 Years ±42.5% ±47.5% Bain’s survey
  • 4.
    Forecasting Without AModel 1 Parramatta 2 Chatswood,  North Sydney 3 Wasteland,  Cowboys 4 CBD,  Airports  8 lanes 4 lanes • Population in 1985 • Hh = Pop / Size • Trips = Rate * Hh • In cars = ms*trips • Cars = In Cars /Occ • Veh = Cars + Com • Split into Cells • Calc 2 to 4 + 4 to 2 • Factor up to 2015 • Share between  Bridge and Tunnel
  • 5.
    The Devil Inthe Detail “There is no such uncertainty as a sure thing.” Robert Burns, poet This Link This Intersection
  • 6.
    •matrix estimation is a system of simultaneous equations •about 400,000 equations and at least 3.2 million unknowns   •there are more than 2x10500  ways that this system of equations can be solved   VITM (Victorian IntegratedTransport Model):  • 2900 Zone •Each trip matrix therefore has more than 8.4 million cells; •More than 681 million cells in the model •    30,000 nodes and 45,000 links = 300,000 turning  movements Trip Distribution “Forecasting traffic patterns is a relatively simple exercise. Motorists will almost  always take the most efficient route between two single points. ”  Vesna Poljak, Australian Financial Review
  • 7.
    Matrices “The trouble withthe future is that there are so many of them.” Niels Bohr, Physicist
  • 8.
    Saving Money WastesMoney "An unsophisticated forecaster uses models as a drunken man uses lamp-posts - for support rather than for illumination.” after Andrew Lang
  • 9.
    Mistake 3 –Saving Money Wastes Money   Original  Refined  % Difference  Crossing  Point   Inbound  Outbound  Inbound  Outbound  Inbound  Outbound  1  11,800  12,300  12,800  15,500  8%  26%  2  2,800  3,500  2,100  2,800  -25%  -20%  3  5,600  5,100  5,200  5,000  -7%  -2%  4  10,300  10,500  10,400  10,800  1%  3%  5  6,500  2,200  4,400  2,200  -32%  0%  6  10,600  12,000  25,100  24,200  137%  102%  7  15,800  16,200  5,000  4,900  -68%  -70%  8  18,900  19,700  31,400  30,800  66%  56%  9  10,200  11,300  11,400  12,800  12%  13%  10  17,600  20,200  17,700  20,400  1%  1%  11  22,700  22,800  30,500  32,000  34%  40%  12  7,400  8,100  7,200  6,500  -3%  -20%  13  7,300  7,500  10,200  10,400  40%  39%  14  27,900  27,600  30,900  26,400  11%  -4%  15  5,200  5,800  3,200  4,200  -38%  -28%  16  5,200  6,600  4,900  5,700  -6%  -14%  17  14,300  14,600  19,600  21,700  37%  49%  18  24,000  24,800  18,000  17,200  -25%  -31%  19  26,100  23,900  34,600  33,700  33%  41%  20  14,400  13,500  34,900  33,800  142%  150%  21  16,900  20,800  11,500  11,900  -32%  -43%  22  2,400  2,700  2,900  3,000  21%  11%  23  13,500  12,500  17,300  20,100  28%  61%  24  300  400  100  100  -67%  -75%  25  8,900  7,900  5,500  4,600  -38%  -42%  26  8,200  7,900  7,500  8,500  -9%  8%  27  14,500  13,400  25,200  27,100  74%  102%  Total  329,300  333,800  389,500  396,300  18%  19% 
  • 10.
    Errors Compounded “Any manwhose errors take ten years to correct is quite a man” J Robert Oppenheimer, Physicist
  • 11.
    The Future • “Ihave seen the future and it is like the present, only longer.” Kehlogg Albran • “I have seen the future and it doesn't work.” Robert Fulford
  • 12.
    Searching for thePast Forecasting is like driving along an unknown road, in the dark, looking out the back window. Peter de Vries, New Yorker
  • 13.
  • 14.
  • 15.
    JOMET – TheJohannesburg Metropolitan Planning for 2000
  • 16.
  • 17.
    JOMET - Forecastv Actual Forecast (2005) Estimated* (2005) Error (%) Population 4,695 5,520 -15% Employment 1,167 1,164 0% * From Johannesburg City Council estimates Forecasts of inputs for the JOMET area compared to the outcomes in thousands Forecast (2005) Actual (2002) Estimated (2005) Error (%) Car 621,000 581,000 610,400 -2% Public Transport 558,000 510,900 552,300 -1% Forecasts of morning peak trips for the JOMET area compared to the outcomes
  • 19.
  • 20.
    Sydney Area TransportStudy Forecast (2000) Actual (2001) Error (%) Population 4,286 3755 14% Employment 1,910 1,820 5% Forecasts of inputs for the Sydney metropolitan area compared to the outcomes Forecast (2000) Actual (2001) Error (%) Home Based 9,878 9,000 10% Non Home Based 1,273 4,154 -69% Total 11,151 13,154 -15% Forecasts of daily trips in the Sydney Area Transport Study compared to the outcomes in thousands
  • 21.
    Sydney Area TransportStudy Forecast (2000) Actual (2001) Error (%) Manufacture 550 208 164% Commerce/Finance/Property 458 470 -3% Services/Public Service 615 843 -27% Transport/Communication 134 145 -8% Building/Construction 115 139 -17% Other 38 15 153% Total 1910 1820 5% Forecasts of employment by industry compared to the outcomes Forecast (2000) Actual (2001) Error (%) Office 892 735 21% Industrial 580 342 70% Transportation and Communication 95 301 -68% Sales and Service 305 348 -12% Other 38 94 -60% Total 1910 1820 5% Forecasts of employment by industry compared to the outcomes
  • 22.
  • 23.
  • 24.
    Melbourne Public Transport •Fuel prices were irregular, but increasing and interest rates were relatively high and climbing
  • 25.
  • 26.
  • 27.
    What they didright • Forecast at an aggregate level • Used models as a means to an end, not an end • Asked the models the right questions • Used sensitivities and/or multiple models • Modern models are under greater expectations Far better an approximate answer to the right question, which is often vague, than an exact answer to the wrong question, which can always be made precise. John W Tukey
  • 28.
    The Problem WithUS Submission to Infrastructure Australia’s Symposium into Traffic Forecasting for Toll Roads “The real issue here is that it if a developer wants to take an optimistic view of the future and ask his traffic advisor to prepare forecasts on the basis of these optimistic assumptions, it is not the fault of the advisor that the forecasts are ‘high’”. Flyvbjerg “… planners lie with numbers. Planners on the dark side are busy, not with getting forecasts right and following an ethical path, but with getting projects funded and built. The most effective planner is sometimes the one who can cloak advocacy in the guise of scientific or technical rationality.” Bain “To knowingly inflate traffic and revenue projections is an act of deception – but it is not alone in that regard. Investors reviewing toll road studies should remain alert to two other potential acts of deceit.”
  • 29.
    Introduction • Patronage forecasting-- Why do it ? • The risk of being wrong is high and the impact on reputation is bad
  • 30.
    Is there a“right” forecast? No! Forecasts need to be tailored to a purpose – high for impact assessment – low for CBA – high for owners to win a PPP deal – low for lenders
  • 31.
    The Problem WithOur Reputation
  • 32.
    •Looking for aPractitioner’s Remedy •Forecasts are not just reasonable but SEEN to be reasonable •Provides alternative outcomes forecasting •Understand the mechanics of the different models in order to forecast successfully •A way to understand more deeply the complex interactions that contribute to transport demand in the future A Solution "You don't drown by falling in the water; you drown by staying there." Edwin Louis Cole
  • 33.
  • 34.
  • 35.
    Multiple Models: Confidence StrategicModel “If you have to forecast, forecast often.” Edgar Fiedler
  • 36.
  • 37.
  • 38.
  • 39.
  • 40.
    Summary • Models – TripDistribution – Asking too much – Using inappropriately • Future – Not such a problem – Dealt with by Sensitivity testing – Avoid disasters • Us – Lying cheating bastards – Misunderstand the models – Scared of uncertainty
  • 41.
    The Computer Says“No!” FROM TO "Chicken guts are hard to read and invite flights of fancy or corruption.” Ian Hacking, Philosopher
  • 42.
    Forecasting can makeyou look stupid • It will be years – not in my time – before a woman will become Prime Minister. – Margaret Thatcher • With over fifteen types of foreign cars already on sale here, the Japanese auto industry isn't likely to carve out a big share of the market for itself. – Businessweek, August 2, 1968 • X-rays will prove to be a hoax. – Lord Kelvin, President of the Royal Society, 1883 • There's no chance that the iPhone is going to get any significant market share. – Steve Ballmer, USA Today, April 30, 2007 • Who the hell wants to hear actors talk? • H. M. Warner, Warner Brothers, 1927

Editor's Notes

  • #42 Just think about, for a moment, the Delphi Oracle. The priestess, or the sybil, was an older woman of blameless life chosen from among the peasants of the area. She sat on a tripod seat over an opening in the earth emitting some sort of ethylene fumes. Intoxicated by the vapour, the priestess would prophecy in answer to a question in a rave that had to be interpreted by the priests of the temple, who would present her prophecies as poems. The point is that the priests were as responsible for the prophecies as the raving woman on the stool, if not more so; if nothing else, they were sober. They had to be skilled in the interpretation of the sybil’s ranting and in writing poetry. The priests also had to have a good understanding of what was happening in the world or they would not be able to attach the sybil’s words to world events in a coherent way. They were required to undergo many years of training, while the sybil herself only had to be female, old and blameless.