Download to read offline
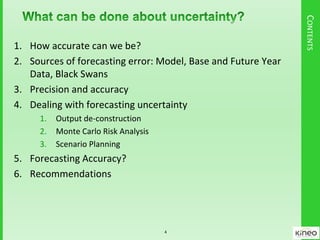


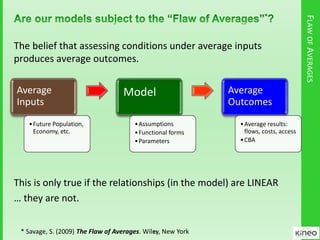

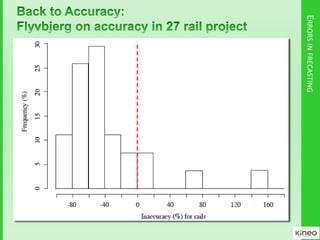
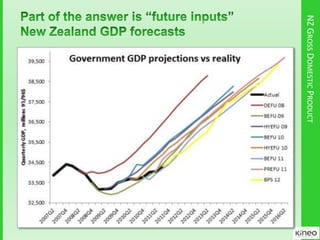
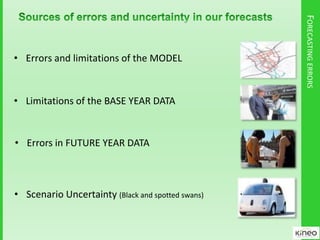
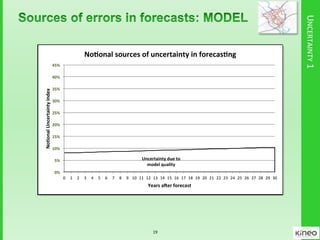
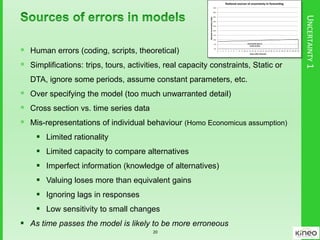
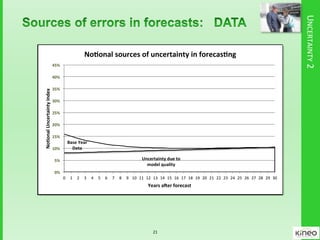
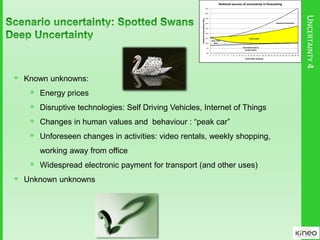
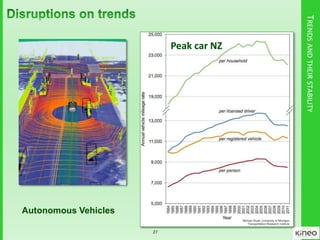
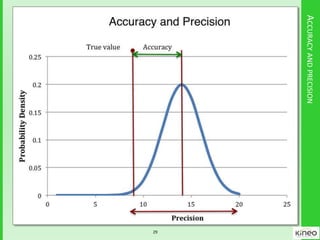
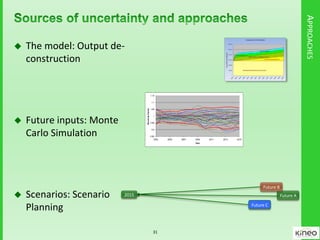
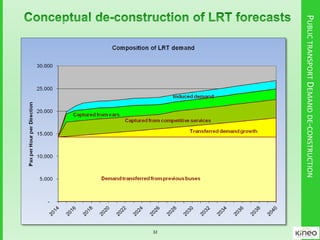


This document discusses approaches for dealing with uncertainty in demand modelling and forecasting. It identifies four main sources of forecasting error: errors in the demand model, limitations of base year data, errors in projecting future year data, and scenario uncertainty. It presents techniques for addressing forecasting uncertainty, including output deconstruction to assess sensitivity to model parameters, Monte Carlo simulation to account for variability in key inputs, and scenario planning to evaluate outcomes under different assumptions. The document emphasizes that long-term forecasting cannot predict with accuracy and advocates focusing on flexibility and evaluating expected outcomes rather than single forecasts.


