Download to read offline


![IJRET: International Journal of Research in Engineering and Technology eISSN: 2319-1163 | pISSN: 2321-7308
_______________________________________________________________________________________
Volume: 04 Issue: 01 | Jan-2015, Available @ http://www.ijret.org 230
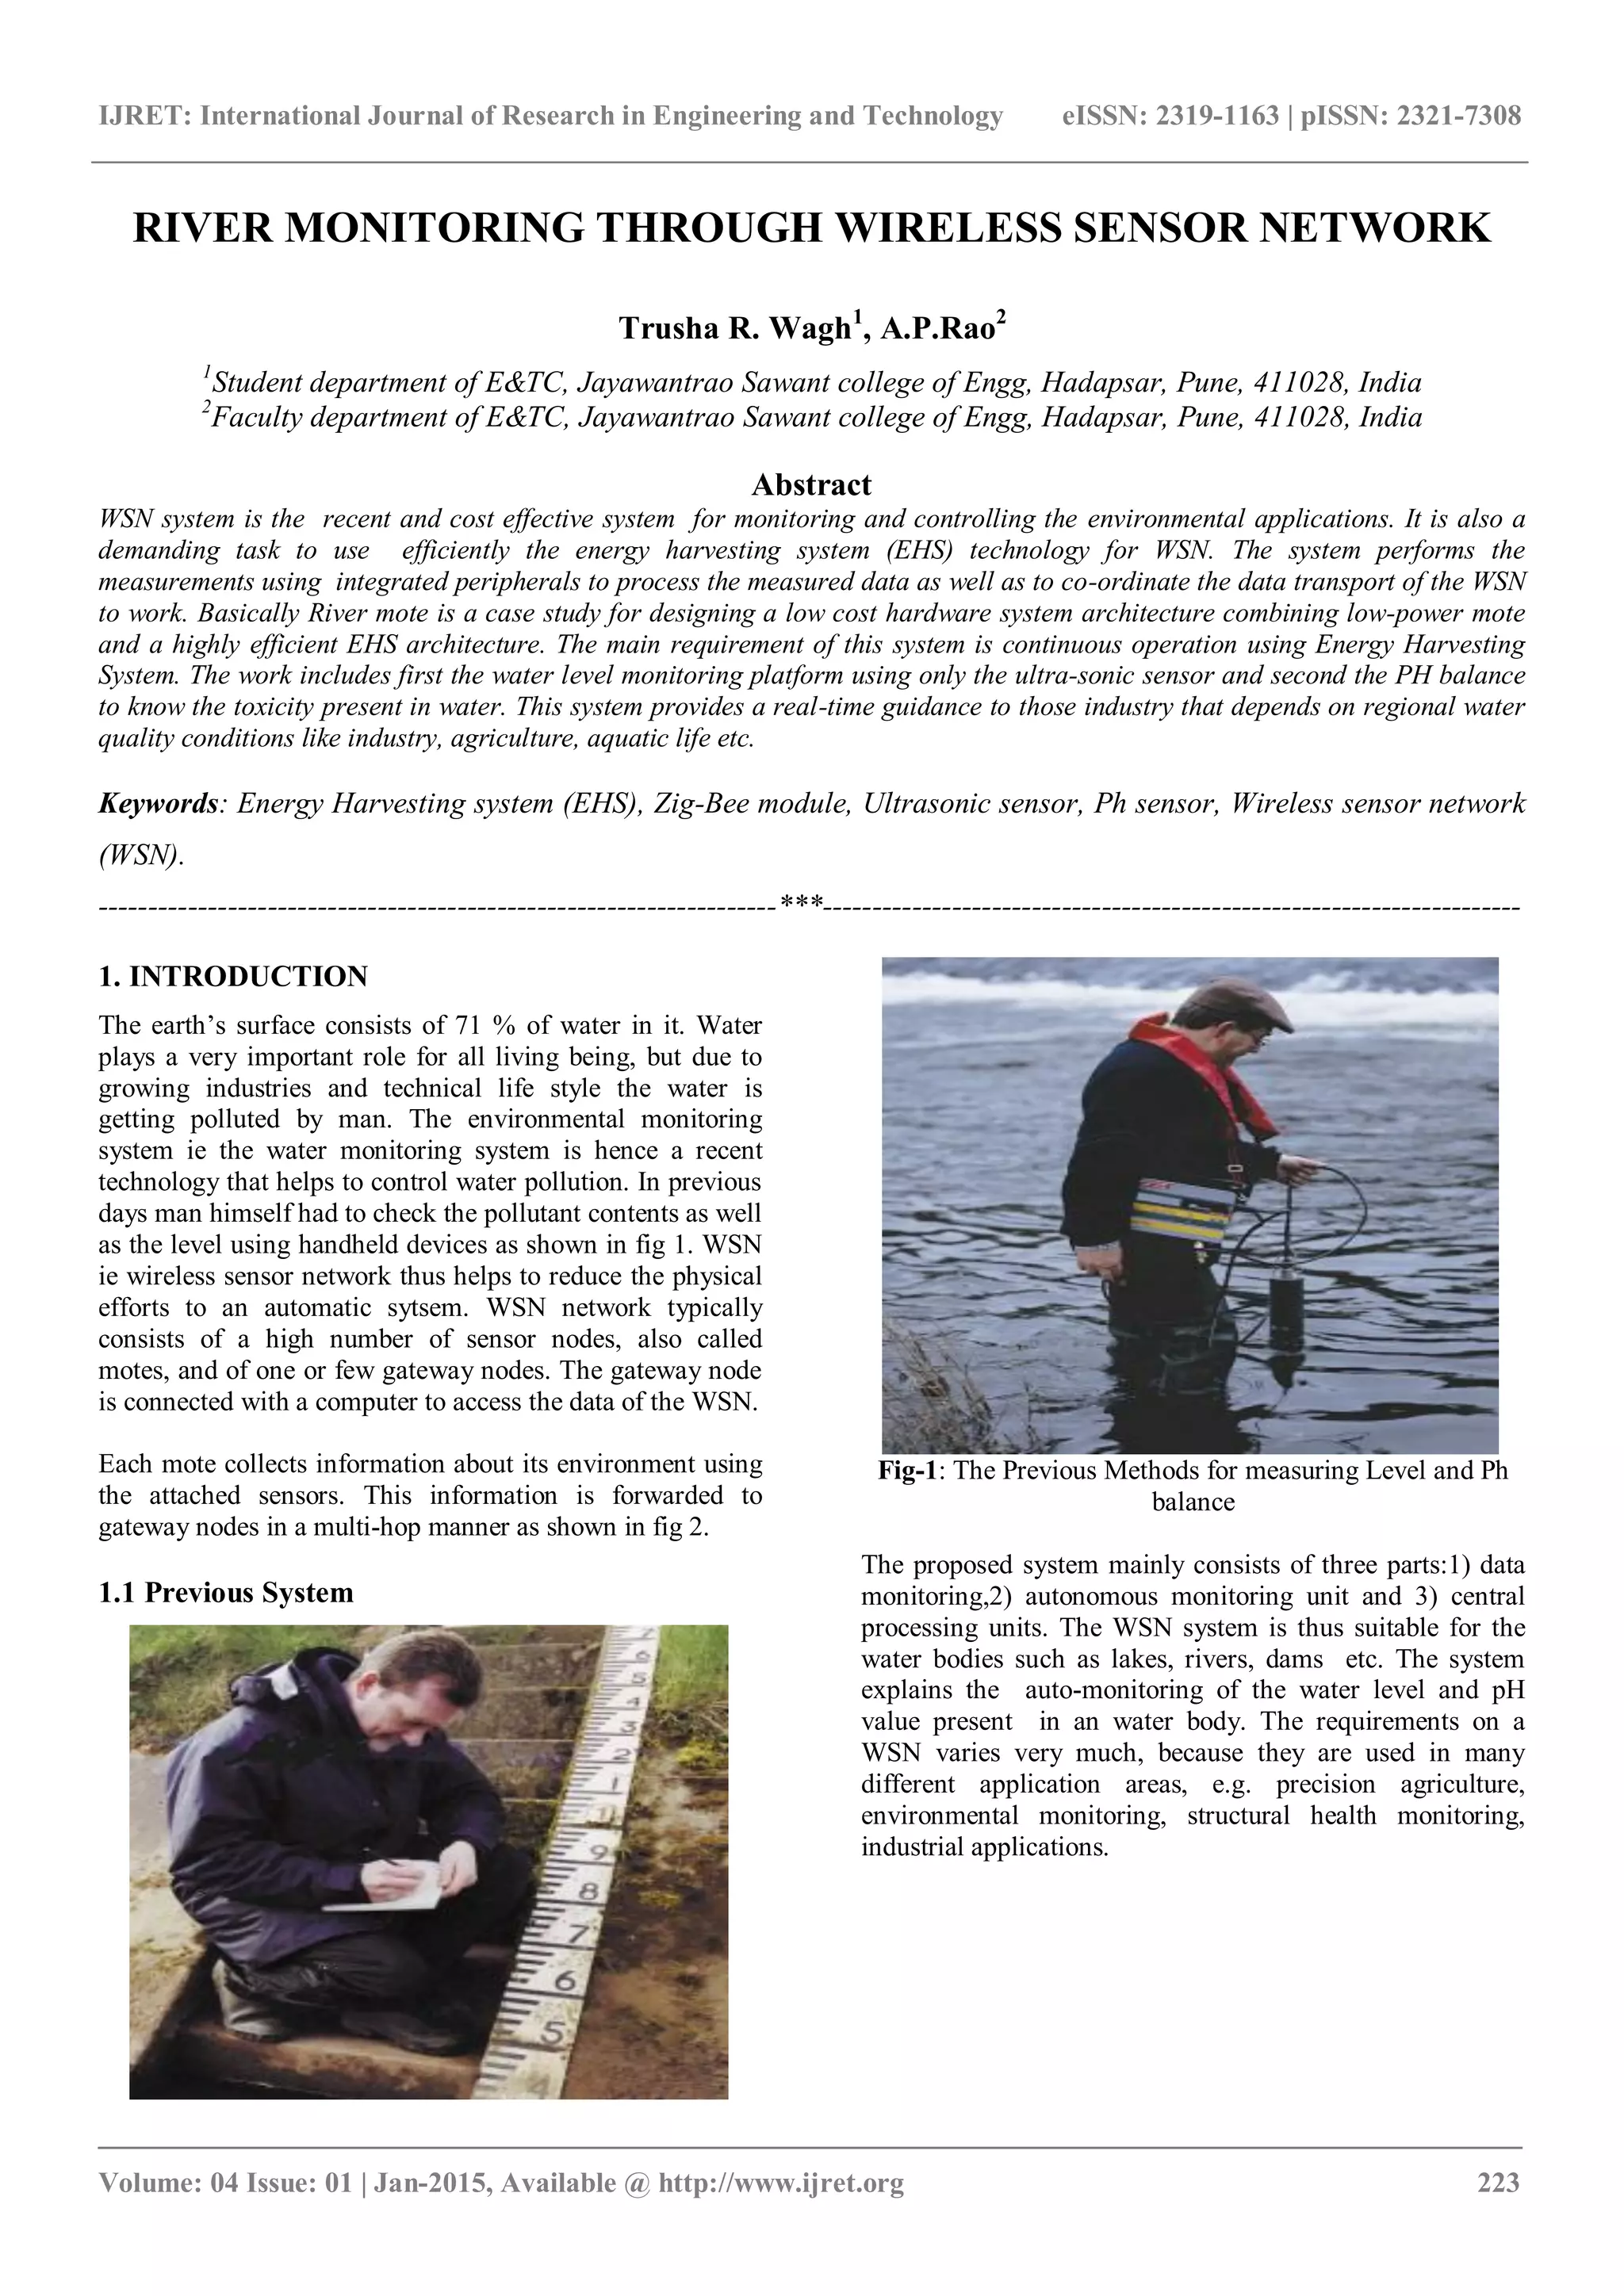
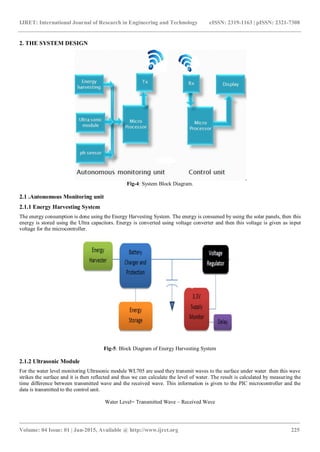
Fig-14: Result of the GUI output
5. CONCLUSION
This work demonstrates the adaptability of a mote to a
specific application area using the microcontroller. It shows
low power design techniques. It also demonstrates the
possibility to supply the mote continuously using an energy
harvesting system and battery as the energy storage
elements. This system uses MRF24FJ40MB which uses the
MAC protocol. This system is not limited only for River
monitoring , it can be build on Dams as well to check the
water level. We can thus define the accurate results of pH
balance and water level using this system.
REFERENCES
[1] George T. Karetsos, Theodore Kotsilieris “A mobile
agent enabled wireless sensor network for river
water monitoring” The Fourth International
Conference on Wireless and Mobile
Communications IEEE pp 346-351, 2008.
[2] Peng Jiang , Hongbo Xia , Zhiye He and Zheming
Wang “Design of a Water Environment Monitoring
System Based on Wireless Sensor Networks”
Sensors, vol.9, pp-6411-6434, 2009.
[3] Jo Ueyama ,Danny Hughes, Ka Lok Man ,Sheng-
Uei Guan “Applying a Multi-Paradigm Approach
to Implementing Wireless Sensor Network Based
River Monitoring” First ACIS International
Symposium on Cryptography, and Network Security
vol. 978-0-7695-4332-1/10 pp. 187-191, 2010.
[4] Philipp Maria Glatz, Leander Bernd Hörmann,
Christian Steger, Reinhold Weiss “Designing
Perpetual Energy Harvesting Systems explained
with River Mote: A Wireless Sensor Network
Platform for River Monitoring” EJSE Special
Issue: Wireless Sensor Networks and Practical
Applications pp. 55-65,2010.
[5] Abdulrahman Alkandari, Meshal alnasheet,
Yousef Alabduljader , Samer M. Moein “Wireless
Sensor Network (WSN) for Water Monitoring
System: Case Study of Kuwait Beaches” The
Society of Digital Information and Wireless
Communications, pp. 709-717 2011.
[6] Sabuj Das Gupta, Islam Md. Shahinur, Akond
Anisul Haque, Amin Ruhul, Sudip Majumder “
Design and Implementation of Water Depth
Measurement and Object Detection Model Using
Ultrasonic Signal System” International Journal of](https://image.slidesharecdn.com/rivermonitoringthroughwirelesssensornetwork-160829110011/85/River-monitoring-through-wireless-sensor-network-8-320.jpg)
![IJRET: International Journal of Research in Engineering and Technology eISSN: 2319-1163 | pISSN: 2321-7308
_______________________________________________________________________________________
Volume: 04 Issue: 01 | Jan-2015, Available @ http://www.ijret.org 231
Engineering Research and Development Volume 4,
Issue 3), PP. 62-69, October 2012.
[7] Leander B. H¨ormann, Philipp M. Glatz, Christian
Steger, Reinhold Weiss “A Wireless Sensor Node
For River Monitoring Using Msp430 R And Energy
Harvesting” 2011 .
[8] Panom Petchjatuporn, Wiwat Kiranon, Anatawat
Kunakorn “A Solar-powered Battery Charger with
Neural Network Maximum Power Point Tracking
Implemented on a Low-Cost PIC-microcontroller”
Faculty of Engineering, Mahanakorn University of
Technology vol. 2394-525-778-185-8 2012.
[9] Lívia C. Degrossi, Guilherme G. do Amaral,
Eduardo S. M. deVasconcelos “Using Wireless
Sensor Networks in the Sensor Web for Flood
Monitoring in Brazil” Proceedings of the 10th
International ISCRAM Conference – Baden-Baden,
Germany, pp 458-462 2013.
BIOGRAPHIES
Trusha R Wagh, pursuing M.E in
Electronics engineering(Digital Systems)
from Jaywantrao Sawant College of
Engineering, Pune, Maharashtra. India.
Dr A.P.Rao, Professor at Electronics and
Telecommunication Department at
Jaywantrao Sawant College of engineering
Pune, Maharashtra. India](https://image.slidesharecdn.com/rivermonitoringthroughwirelesssensornetwork-160829110011/85/River-monitoring-through-wireless-sensor-network-9-320.jpg)

The document discusses the development of a wireless sensor network (WSN) system for monitoring water levels and pH balance in rivers, focusing on energy-efficient design using energy harvesting systems. It details the components of the system, including ultrasonic and pH sensors, as well as the microcontroller used for data processing and transmission to a control unit for real-time monitoring. The proposed solution aims to enhance environmental monitoring by providing accurate data while minimizing manual errors and power consumption.