Download to read offline
![International Research Journal of Engineering and Technology (IRJET) e-ISSN: 2395 -0056
Volume: 04 Issue: 03 | Mar -2017 www.irjet.net p-ISSN: 2395-0072
© 2017, IRJET | Impact Factor value: 5.181 | ISO 9001:2008 Certified Journal | Page 2442
Power Consumption Alert System
D.Aswini1, N.Nisari2, Nivetha3, B.Vaishnavi4
1Assistant Professor, Computer Science and Engineering, Kumaraguru College of Technology, Tamil Nadu, India
2, 3, 4UG Students, Computer Science and Engineering, Kumaraguru College of Technology, Tamil Nadu, India
----------------------------------------------------------------------------***---------------------------------------------------------------------------
Abstract - Nowadays, people are unaware of the cost of
energy consumed by various appliances. This project aims to
design a circuit which helps the consumer in takingcareofthe
electrical energy consumption and the extra charges incurred
due to minor changes in slab categories, even though these
changes are small they affect the consumer’s bill severely. To
make the consumer aware and to control the excess power
consumption, this paper introduces, a “POWER
CONSUMPTION ALERT SYSTEM”. Thissystemwill intimate the
consumer about his /her usage rate. It will display the total
units of power consumed and how many units has been left
with, in order to be in a minimum slab rate being for a period
of time. In this way, the consumer can be made aware of the
power consumed and can hence make the consumer use the
power accordingly. Daily usage is updated to the consumer
periodically through a mobile application and also in a
webpage which generates a report aswell. Oncethemaximum
threshold value is reached, power is cut off with a prior
notification to the consumer. It notonlybenefitstheconsumer,
it also benefits the government as it is capable of reducing the
power consumption and subsequently can reduce the unusual
power usage.
KeyWords: ARDUINO UNO, Optocoupler, Energy
meter, GSM, ESP8266, Thingspeak.
1. INTRODUCTION
Electrical energy is universally accepted as an
essential commodity for human beings. Energy is the
prime mover of economic growth and is vital to the
sustenance of modern economy. Future economic growth
crucially depends on the long-term availability of energy
from its sources.
The IOT based “POWER CONSUMPTION ALERT
SYSTEM” mainly aims at the middle class and the lower
middle class family to bring their electricity bill down with
the help of the power consumption alert system. Energy
meters being deployed at homes are used for reading the
power that is being consumed. Each consumer may fix a
customized threshold value (unit/cost). If the value
reaches above the threshold, the power is cut off with a
prior notification to the consumer. The graph or the
amount of electricity consumed can be visualized with the
help of a mobile application/website where the report is
given to the user periodically.
This system can be installed at any place where the
energy consumption should be regularly monitored and
controlled. The consumers can fix their own threshold
budget values and can be easily customized based on their
requirements.
POWER CONSUMPTION ALERT SYSTEM is used to
continuously monitor the meter reading and give
weekly/monthly/daily information about the number of
units consumed along with its cost to the consumer. Major
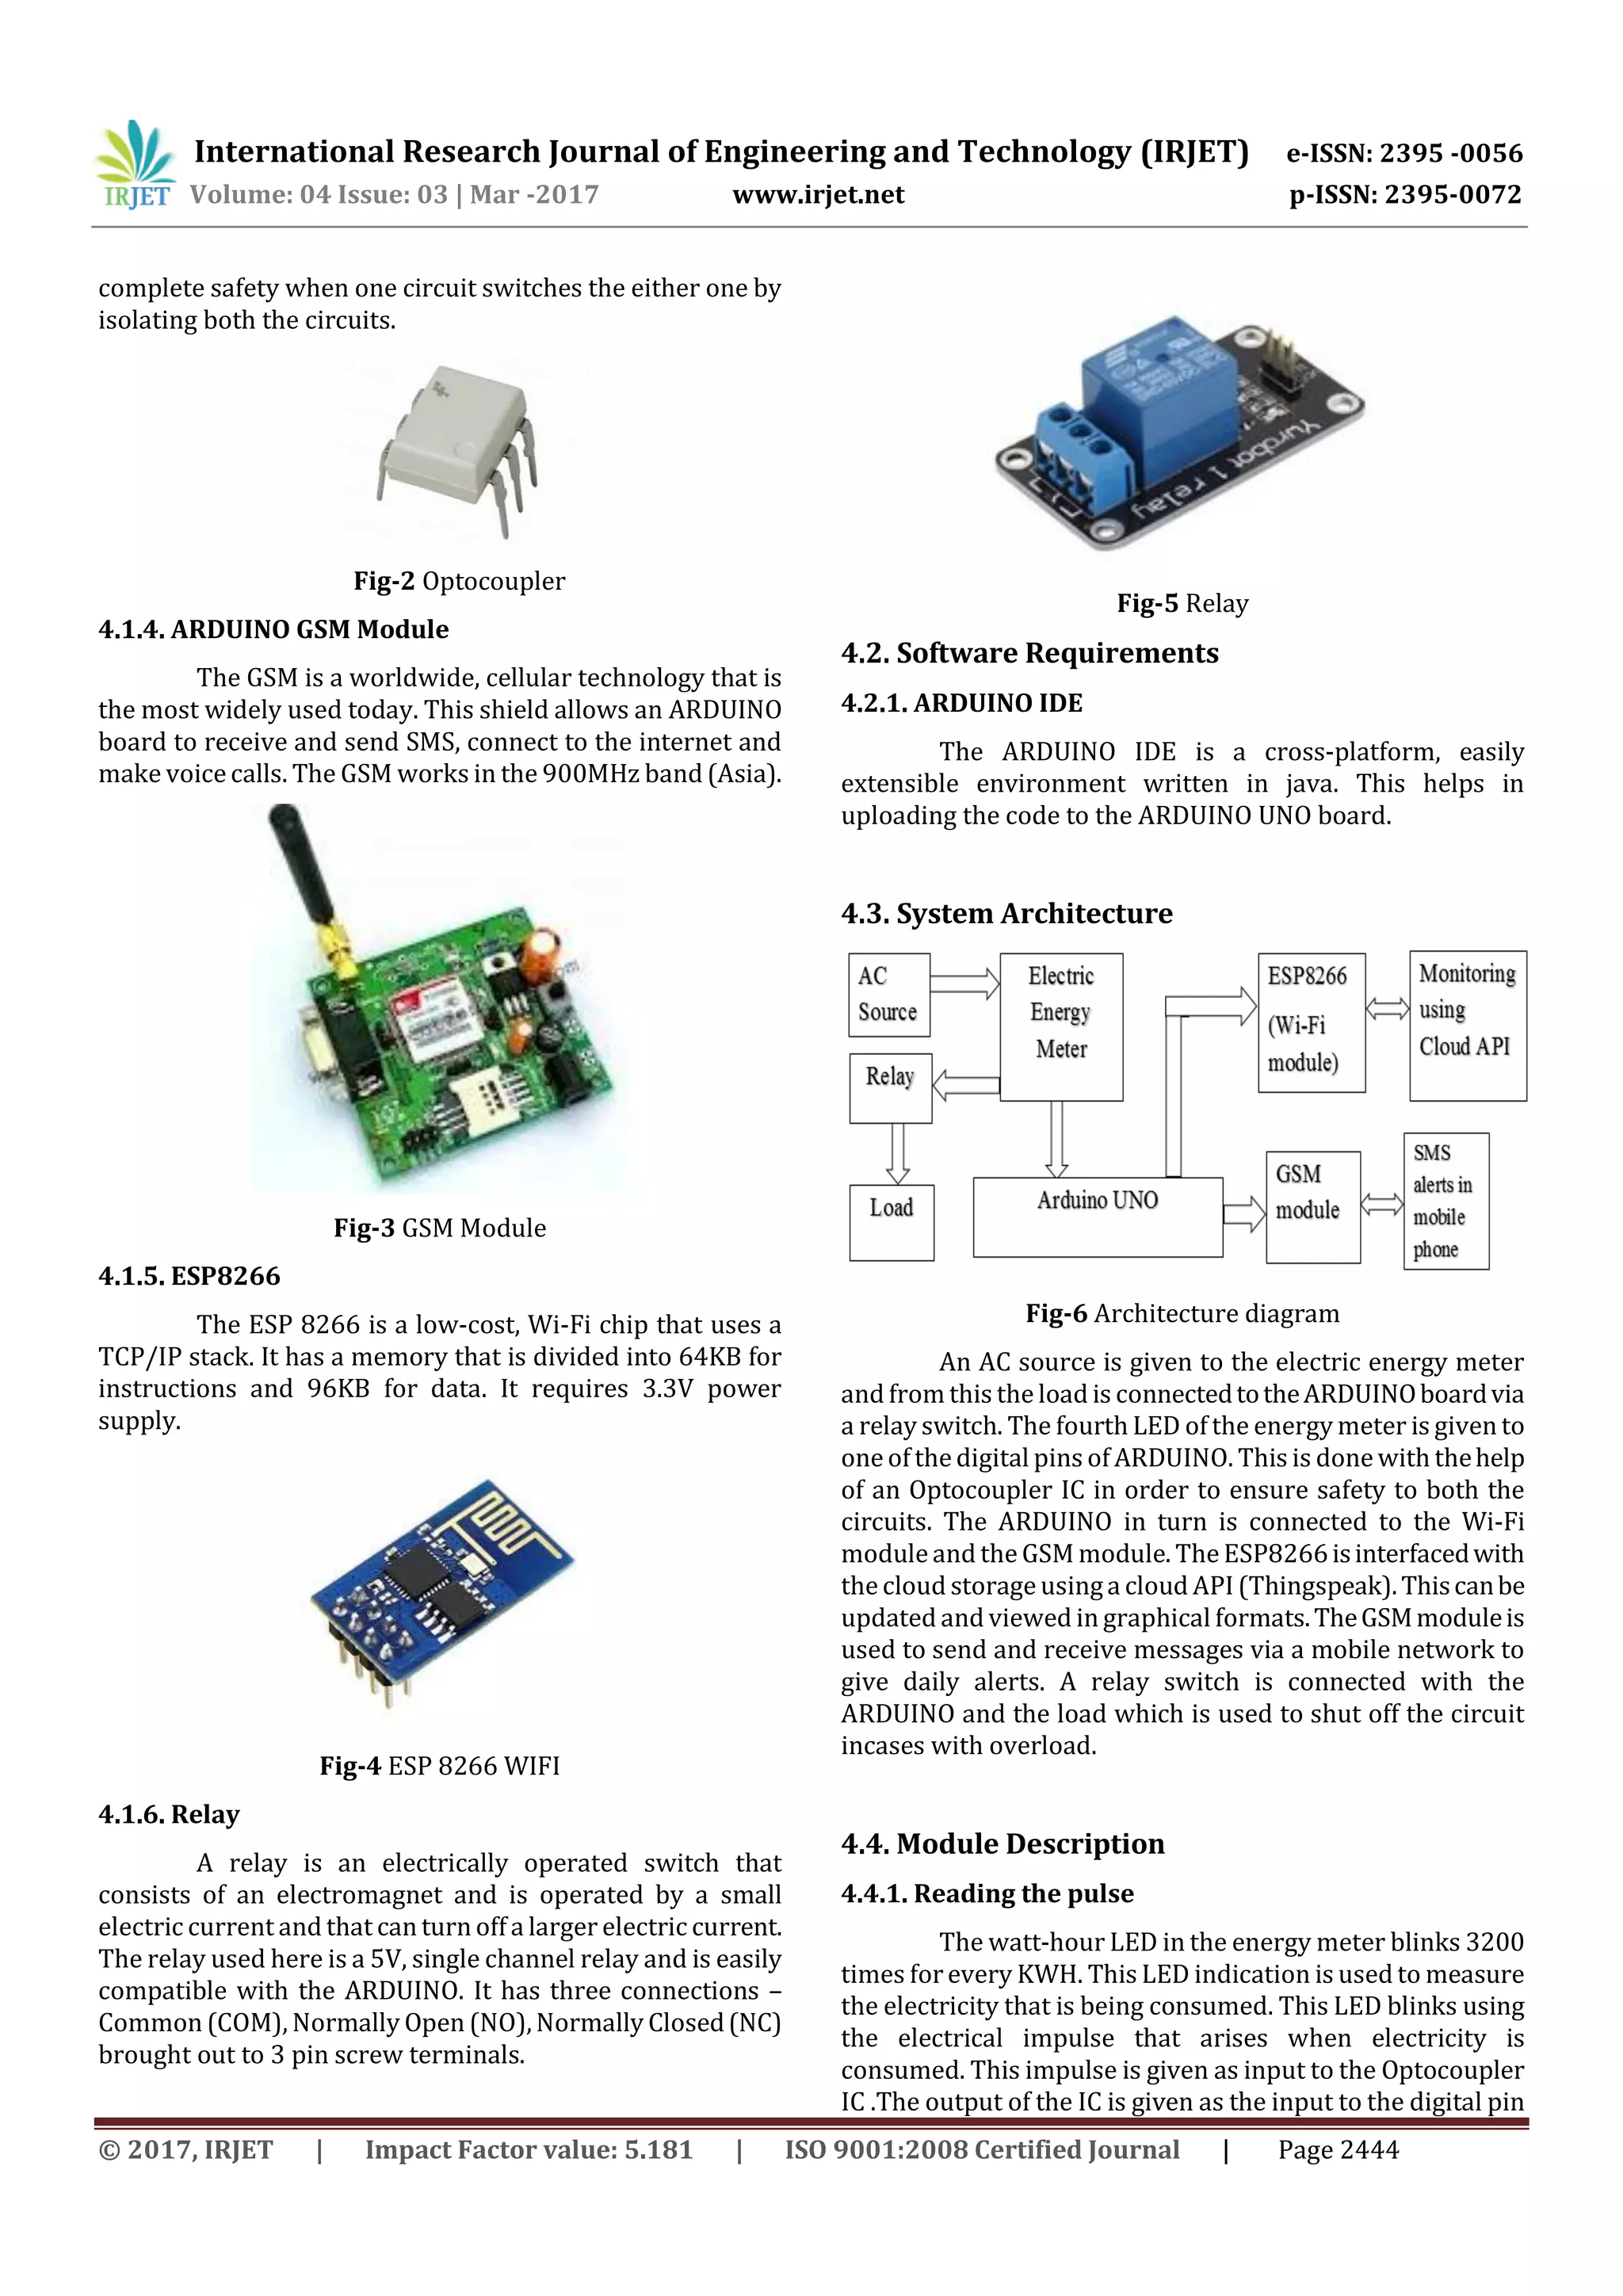
components used in this project are ARDUINO Board, GSM
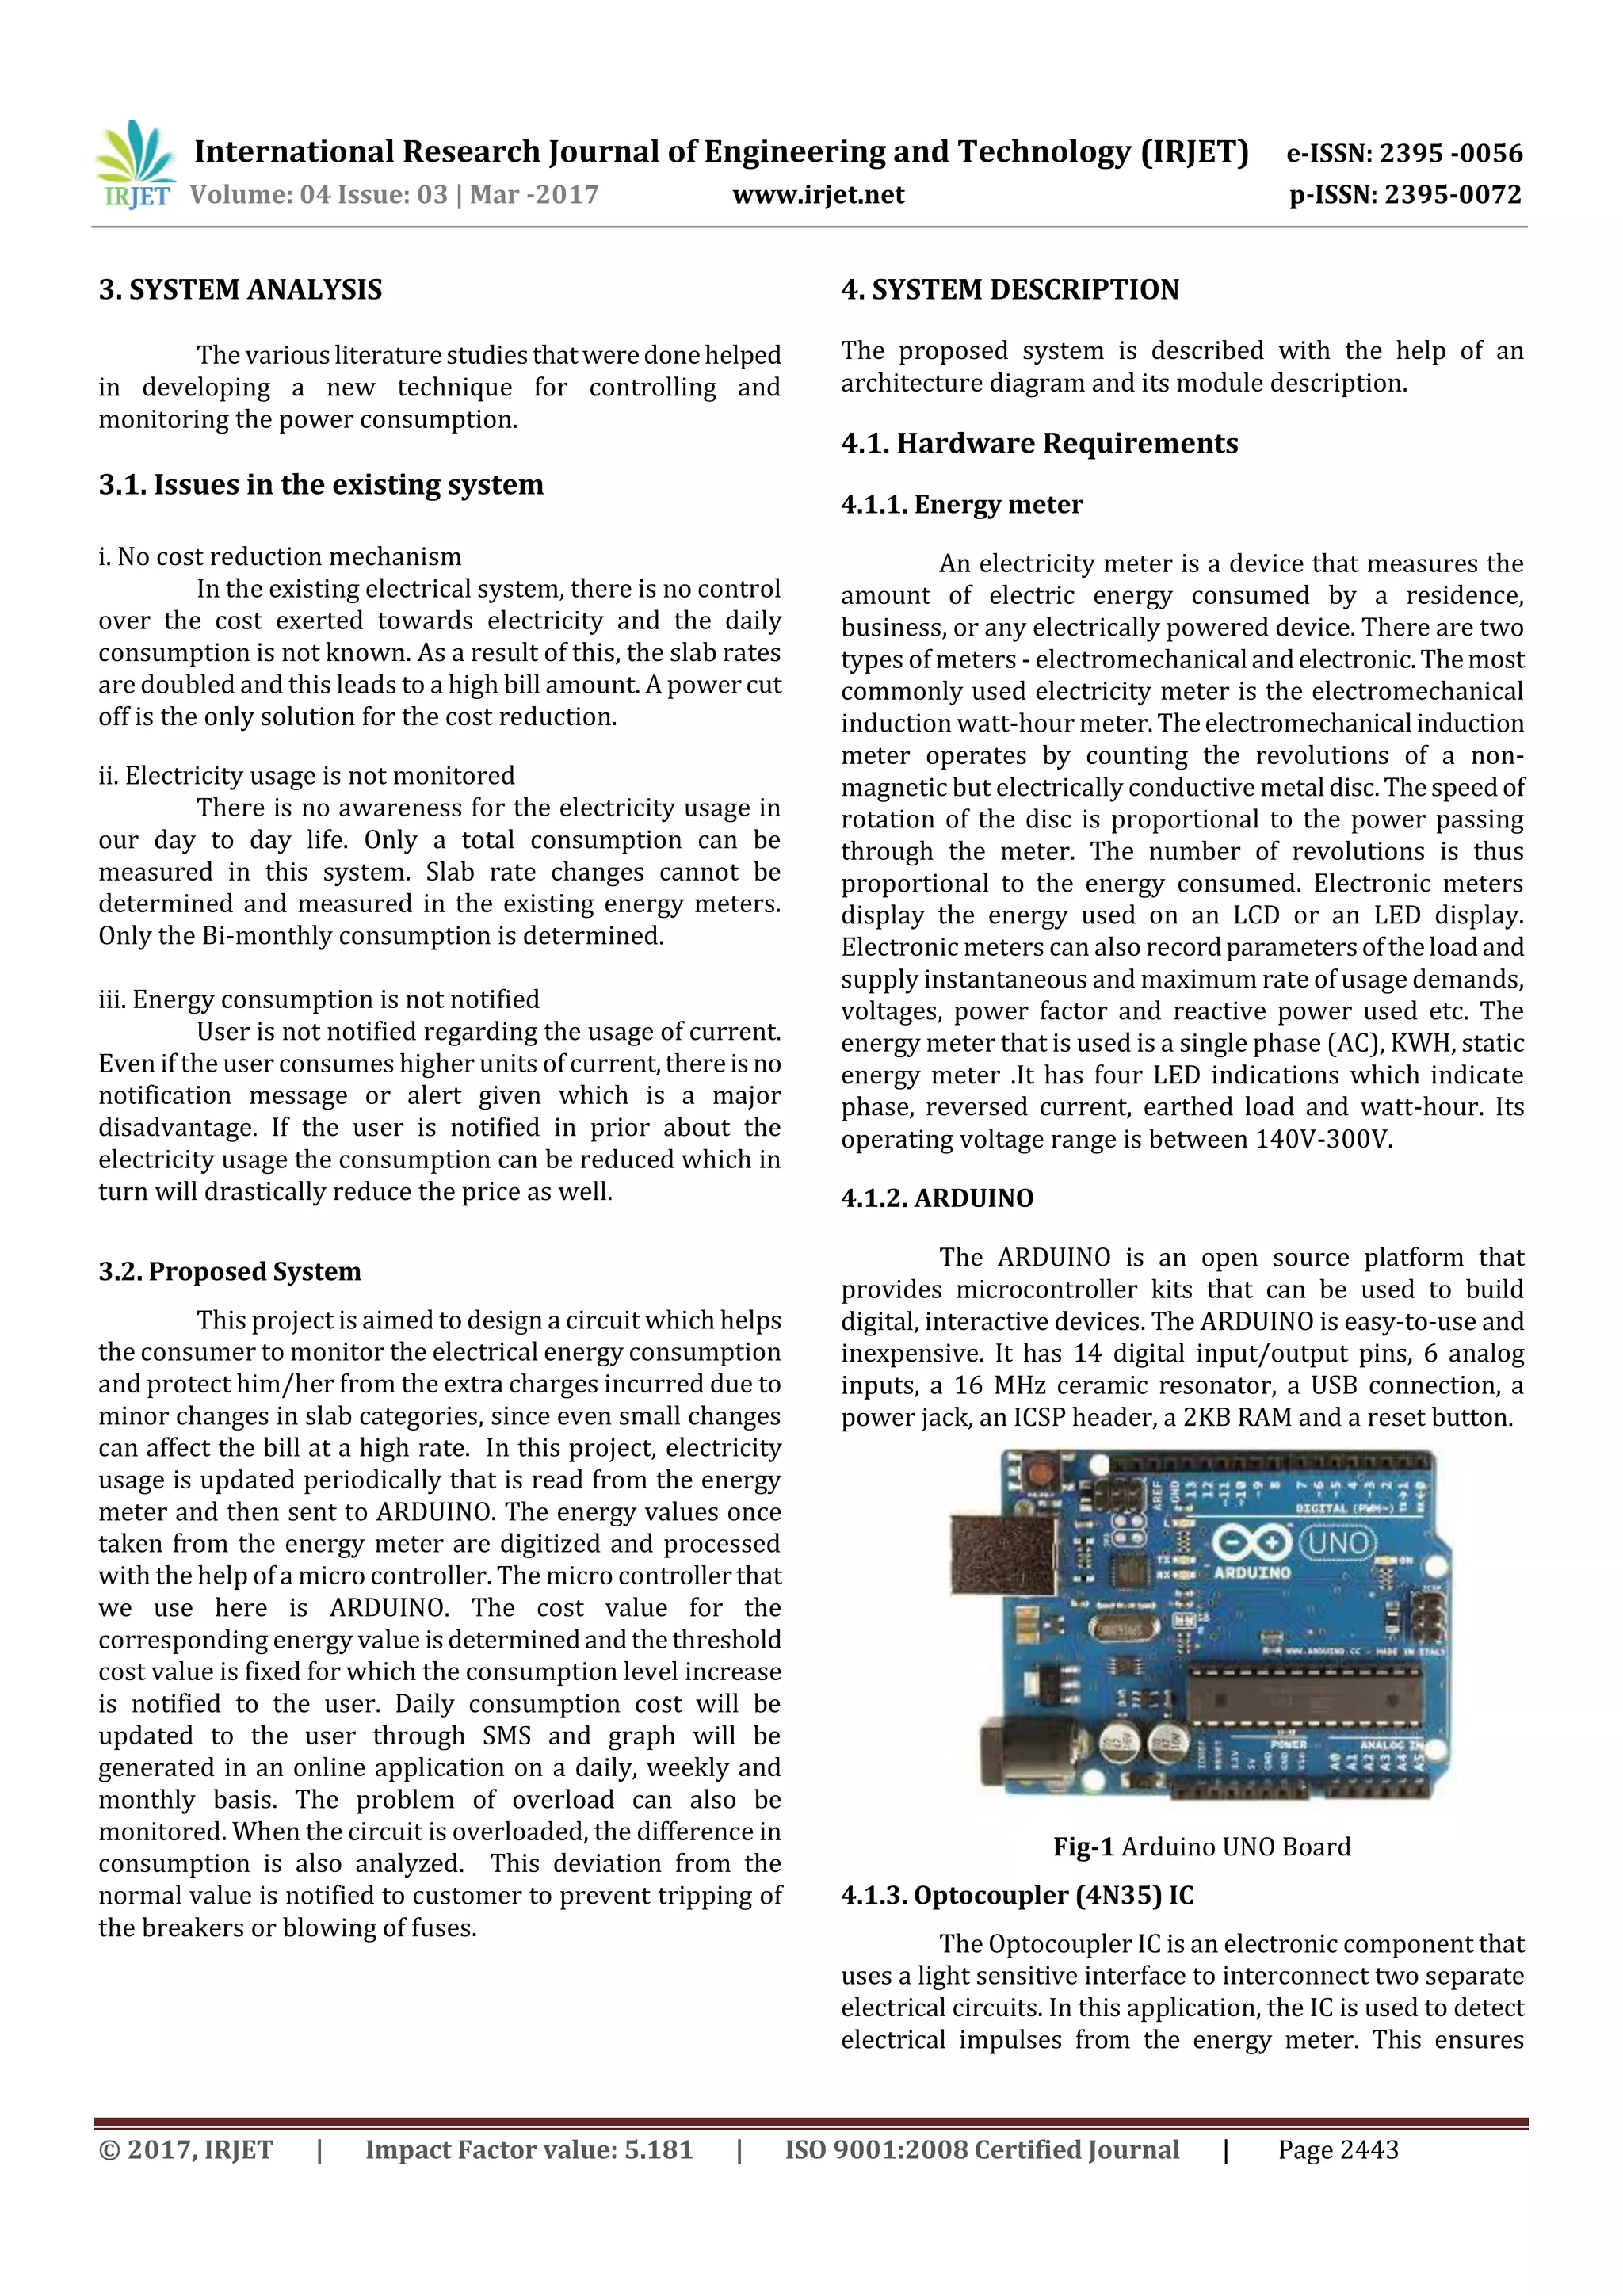
module, ESP 8266, energy meter circuit, andload. ARDUINO
is a credit card sized minicomputer and acts as a fast
processor system. It is the central unit of this project and is
connected to GSM, ESP 8266, and energy meter through
various ports. The overall operation of the proposed system
is discussed in the following sections.
2. LITERATURE SURVEY
Previous Literatures1, 2, 3, 4, 5 andresearchwork done
by scholars in this domain have been reviewed. Difficulties
that were faced by them are presented here.
A communicationbetweentheenergymeterandthe
EB officer [7] through a wireless medium is used for making
longer distance communication easier with reduced cost.
A wireless sensor and actuator network [8] can be
used for monitoring the energyuseofelectrical appliancesin
a home environment. The four pull-down options used are
CSM, Monitor, Node, and Display that helps the consumer to
monitor the usage of electricity.
The prepaid electricity meter uses a prepaid card
that communicates with the user and the prepaid meter.For
each unit of power consumed, the cost is deducted from the
prepaid card .Once the prepaid card is out of balance, the
load of the consumer is disconnected from the utility supply
by the contactor. The user can recharge the card remotely
through mobile communicationbasedoncustomerrequests.](https://image.slidesharecdn.com/irjet-v4i3638-180108070839/75/Power-Consumption-Alert-System-1-2048.jpg)
![International Research Journal of Engineering and Technology (IRJET) e-ISSN: 2395 -0056
Volume: 04 Issue: 03 | Mar -2017 www.irjet.net p-ISSN: 2395-0072
© 2017, IRJET | Impact Factor value: 5.181 | ISO 9001:2008 Certified Journal | Page 2447
6. CONCLUSIONS
Thus, the Power Consumption Alert System is used to alert
the user regarding his everyday consumption of electricity.
This helps in saving electricity and also keeping the
electricity bills under limits. A small moduleconsistingof the
ARDUINO board, ESP8266 and GSM can be installed with
energy meter to make the electricity consumption smarter.
REFERENCES
[1] Changliang Xia, Member, IEEE, Xin Gu, Tingna Shi, and
Yan Yan, “Neutral-Point Potential Balancing of Three-
Level Inverters in Direct-Driven Wind Energy
Conversion System” IEEE TRANSACTIONS ON ENERGY
CONVERSION, VOL. 26, NO. 1, MARCH 2011.
[2] Vijay Chand Ganti, Bhim Singh, Fellow,IEEE,ShivKumar
Aggarwal, and Tara Chandra Kandpal,” DFIG-Based
Wind Power Conversion With Grid Power Leveling for
Reduced Gusts” IEEE TRANSACTIONS ON
SUSTAINABLE ENERGY, VOL. 3, NO. 1, JANUARY 2012.
[3] Jiabing Hu, Member, IEEE, HailiangXu,StudentMember,
IEEE, and Yikang He, Senior Member, IEEE Coordinated
Control of DFIG’s RSC and GSC.
[4] Under Generalized Unbalanced and Distorted Grid
Voltage Conditions”, IEEE TRANSACTIONS ON
INDUSTRIAL ELECTRONICS, VOL. 60, NO. 7, JULY 2013.
[5] Yipeng Song, Student Member, IEEE, and Heng Nian,
Member, IEEE “Modularized Control Strategy and
Performance Analysis of DFIG System Under
Unbalanced and Harmonic Grid Voltage” IEEE
TRANSACTIONSON POWER ELECTRONICS,VOL.30,NO.
9, SEPTEMBER 2015.
[6] Muhamad Zahim Sujod, Member, IEEE, Istvan Erlich,
Senior Member, IEEE, and Stephan IEEE
TRANSACTIONSON ENERGYCONVERSION,VOL.28,NO.
3, SEPTEMBER 2013.
[7] B.S.Sathish Dr.P.Thirusakthimurugan and R.Narmadha
“INTERNATIONAL JOURNAL OF ADVANCEDRESEARCH
IN COMPUTER ENGINEERING & TECHNOLOGY
(IJARCET)”AnAdvancedPowerManagementUsingGSM
Module Volume 3 Issue 4, April 2014 1101 ISSN: 2278 –
1323.
[8] Edwin Chobot, Daniel Newby “INTERNATIONAL
JOURNAL OF EMBEDDED SYSTEMS AND
APPLICATIONS” Design and Implementation of a
Wireless Sensor and Actuator Network for Energy
Measurement and Control at Home vol. 3, no. 1, March
2013.
[9] Amit Jain, Mohnish Bagree“INTERNATIONAL JOURNAL
OF ENGINEERING, SCIENCE AND TECHNOLOGY” A
prepaid meter using mobilecommunicationVol.3,No.3,
2011, pp. 160-166.](https://image.slidesharecdn.com/irjet-v4i3638-180108070839/75/Power-Consumption-Alert-System-6-2048.jpg)

The document describes a power consumption alert system that aims to make consumers aware of their electricity usage and costs. The system monitors energy consumption using a sensor connected to the energy meter. It sends usage data to a microcontroller that determines costs and compares it to a threshold. When the threshold is reached, the consumer is notified via SMS and a mobile/web app that generates daily, weekly, and monthly usage reports. The system cuts power if the maximum limit is exceeded and notifies the consumer. It aims to help consumers reduce electricity bills and curb unusual power usage, benefiting both consumers and the government.