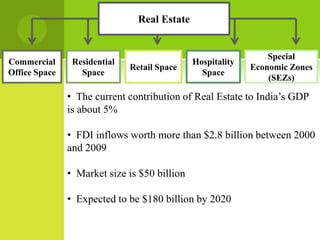
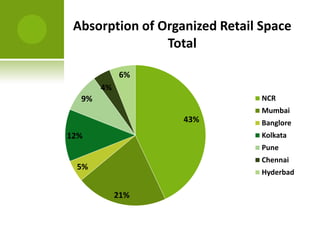
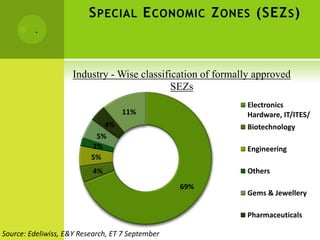
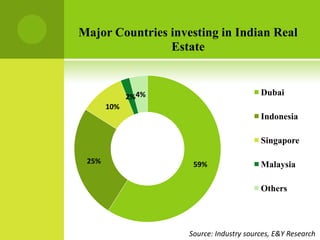
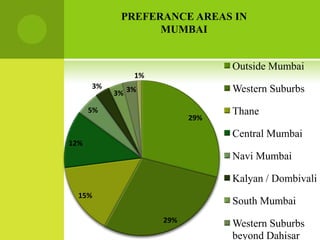
REAL ESTATE
 INDUSTRY


    PRESENTED BY

                   ANUPAM SWAIN

                   MANISH JAISWAL

 
                    CHIRAG BACHANI

                   ANUJ MISHRA

                   AMIT KUMAR
M ONOPOLISTIC OR I MPERFECT
            C OMPETITION

   Where the conditions of perfect competition
    do not hold, ‘imperfect competition’ will exist
   Varying degrees of imperfection give rise to
    varying market structures
   Entry and exit from the industry is relatively
    easy – few barriers to entry and exit
   Consumer and producer knowledge imperfect
M ONOPOLISTIC               OR I MPERFECT        C OMPETITION
        Implications for the diagram:                               Since the additional
                                             MC                     revenue received from
                                                                    each unit sold falls, the
Cost/Revenue
                                                                    MR curve liescurve facing
                                                                    The demand under the
                                                                    AR firm will be downward
                                                                    the curve.
                                                     AC           sloping and represents the
                                                                  AR earned from sales.
£1.00                                                          We assume that the firm
                                                               produces where MR = MC
                                                             If(profit maximising output).
                                                                the firm produces Q1 and
            Abnormal Profit                                  sells each unit for £1.00 on
                                                               At this output level, AR>AC
                                                             average with the cost (on
                                                               and the firm makes
£0.60                                                        average) for each unit being
                                                               abnormal profit (the grey
                                                             60p, the firm will make 40p x
                                                               shaded area).
                                                             Q1 in abnormal profit.
                                                               This is a short run equilibrium
                                                               position for a firm in and
                                                                      Marginal Cost a
                                                               monopolistic marketwill be the
                                                                      Average Cost
                                                               structure. shape.
                                                                      same

                                        MR       D (AR)               However, because the
                                                                      products are
                                                                      differentiated in some
                               Q1
                                              Output / Sales          way, the firm will only be
                                                                      able to sell extra output
                                                                      by lowering price.
REAL ESTATE
           INDUSTRY
   Real Estate Industry in India witnessed a historic boom
    during 2002 to 2007.

   Real Estate Developers in India grew multifold very fast.

   Land and property prices skyrocketed.

   Many developers went for public issue of shares at very
    high valuations.

    Attracted by liberalization of foreign investment
    regulations, International investors invested billions of
    dollars in Indian real estate sector.

   A number of real estate companies went for IPOs
    between 2006 and 2008
Real Estate


                                                                Special
Commercial      Residential                   Hospitality
                              Retail Space                  Economic Zones
Office Space      Space                         Space
                                                                (SEZs)

               • The current contribution of Real Estate to India’s GDP
               is about 5%

               • FDI inflows worth more than $2.8 billion between 2000
               and 2009

               • Market size is $50 billion

               • Expected to be $180 billion by 2020
C OMMERCIAL O FFICE S PACE


    Growth Drivers
   Multinational companies (MNCs) and the growth of the services sector.

   Significant growth in FDI


    Market Structure
   Pan India presence

   International players


    Outlook
• Growth in services —telecom, financial services, IT &
ITeS,
    etc.,
Commercial Office Space Absorption

              10%   14%

       8%
                                     Mumbai
                                     NCR
                                     Hyderbad
 11%
                          23%        Banglore
                                     Chennai
                                     Kolkata
                                     Pune

            26%      8%
C OMPANIES WISE TRENDS                         IN SALES
                       I NDUSTRIAL                                          Crore
               2003-04    2004-05    2005-06      2006-07      2007-08    2008-09

Larsen &      5600        9636.53   10392.03     12622.50     18410.05   27456.22
Turbo
Bharat Heavy 1881.06      2743.71   2885.23      3803.77      3975.01    5261.15
Electricals
Punj Lloyd    1459.16     1380.72   1328.37      2180.98      4421.17    6734.56
ABB           603.56      1044.87   1422.88      2154.03      3295.49    3580.52
TOTAL


                                                     Larsen & Turbo
                                        30.82%
                                                     Bharat
                                                     Punj Lloyd
                       51.69%
                                                     ABB
                                         5.91%
                                                     Others
                                     7.56%
                                4.02%
R ESIDENTIAL S PACE


    Growth Drivers
   Urban population estimated to reach 590 million by 2030

   Number of nuclear families estimated to cross 300 million

   16 to 64 age group—almost 64% of the total population

   Growing demand for affordable housing

   Easier access to loans
    Market Structure
   Unorganized

   Regional players are expanding to achieve a pan-India presence
C OMPANIES            WISE TRENDS IN SALES
                                 H OUSING                                   Crore
           2003-04     2004-05    2005-06      2006-07    2007-08      2008-09
            (157)       (129)      (105)        (104)       (92)         (84)
DLF        442.52     411.77     983.94       1124.15    5516.39      2705.42
EmaarMGF                                                 1026.90      926.22
Sobha      211.37     453.06     28.61        1056.52    1242.01      809.51
Ansal      149.45     184.32     319.08       718.25     823.02       631.70
TOTAL      3841.09    3909.79    5770.01      9428.56    16351.95     13986.87


                                                                    2008-09
                                    19.34%
                                                                      DLF
                                                                      EmmarMGF
                                            6.62%                     Sobha
                                            5.79%                     Ansal
                     63.73%
                                            4.52%                     Others
R ETAIL S PACE

    Growth Drivers
   Growth in organized retailing
   Entry of international retailers


    Segmentation
   Organized retail contribution to the retail industry grew from 2%
    in 2003 to 5.5% in 2009

   International retailers are growing through the franchisee
    route
Absorption of Organized Retail Space
                Total

            6%
       4%
  9%                            NCR
                                Mumbai
                   43%          Banglore
12%                             Kolkata
                                Pune
                                Chennai
 5%
                                Hyderbad

            21%
H OSPITALITY S PACE


    Growth Drivers
   Increase in tourism, including both business and leisure travel

   Medical tourism destination

   International events


    Market Structure
   Existing hotel operators are scaling up their operations.

   Budget hotels and service apartments

   Increasing presence of International players
S PECIAL E CONOMIC Z ONES (SEZ S )
        .


                     Industry - Wise classification of formally approved
                                             SEZs
                                                             Electronics
                                   11%                       Hardware, IT/ITES/
                             4%                              Biotechnology
                           5%
                          2%                                 Engineering
                          5%
                           4%                                Others
                                                  69%
                                                             Gems & Jewellery

                                                             Pharmaceuticals

Source: Edeliwiss, E&Y Research, ET 7 September
Major Countries investing in Indian Real
                Estate


             2%4%                        Dubai
       10%
                                         Indonesia

                                         Singapore

 25%                 59%                 Malaysia

                                         Others


                    Source: Industry sources, E&Y Research
MAJOR INTERNATIONAL &
  DOMESTIC PLAYERS
PREFERANCE AREAS IN
                  MUMBAI


                                Outside Mumbai
               1%
      3%                        Western Suburbs
           3% 3%

      5%                        Thane
                          29%

                                Central Mumbai
12%
                                Navi Mumbai

                                Kalyan / Dombivali
  15%
                                South Mumbai
                    29%
                                Western Suburbs
                                beyond Dahisar
COMPARING PRICE BETWEEN
               MUMBAI AND KOLKATA

            MAJOR PLAYERS IN REAL ESTATE

             COMMERCIAL MARKET

   COMPANY             MUMBAI              KOLKATA
     DLF                15000               11000
 K RAHEJA Corp          14500                9000
    EMAAR               18000               14000
    SOBHA               10000                7000
   UNITECH              12500                9500
 GREENFIELD             16000               11000
PRESTIGE GROUP          11000                6500
COMPARING PRICE
                 BETWEEN MUMBAI AND
                      KOLKATA
                  RESIDENTIAL MARKET

  COMPANY            MUMBAI        KOLKATA

     DLF              10000            6500

 KUMAR DEV.           9500             5000

Omaxe Builders        9000             6000

  UNITECH             11000            6000

 PARSVANATH           9000             6000
CONCLUSIONS
   Though the economic meltdown has tremendously affected
    this cosmopolitan city
   It has made some good for the property investors, because the
    properties which were once sold at sky rocketing tags has
    come down immensely, making it people-affordable purchase.
   With the market slowly picking up, and job opportunities
    steadily moving up, most top real estate players in commercial
    and residential stream like Hiranandani, Adarsh,
    Brigade,Prestige, and DLF group have once again commenced
    their new projects in Mumbai.
   This time the target has been the middle and lower income
    group.
   Thus with the new avenues slowly opening up in the economic
    front, and with the real estate initiating new projects at
    affordable cost, it is the ideal time for investors to make the
    right move on housing decision
REFRENCES

   www.99acres.com

   www.indiahousing.com

   www.ey.com

   http://www.wikipedia.org
Economics

Economics

  • 1.
    REAL ESTATE INDUSTRY  PRESENTED BY  ANUPAM SWAIN  MANISH JAISWAL  CHIRAG BACHANI  ANUJ MISHRA  AMIT KUMAR
  • 2.
    M ONOPOLISTIC ORI MPERFECT C OMPETITION  Where the conditions of perfect competition do not hold, ‘imperfect competition’ will exist  Varying degrees of imperfection give rise to varying market structures  Entry and exit from the industry is relatively easy – few barriers to entry and exit  Consumer and producer knowledge imperfect
  • 3.
    M ONOPOLISTIC OR I MPERFECT C OMPETITION Implications for the diagram: Since the additional MC revenue received from each unit sold falls, the Cost/Revenue MR curve liescurve facing The demand under the AR firm will be downward the curve. AC sloping and represents the AR earned from sales. £1.00 We assume that the firm produces where MR = MC If(profit maximising output). the firm produces Q1 and Abnormal Profit sells each unit for £1.00 on At this output level, AR>AC average with the cost (on and the firm makes £0.60 average) for each unit being abnormal profit (the grey 60p, the firm will make 40p x shaded area). Q1 in abnormal profit. This is a short run equilibrium position for a firm in and Marginal Cost a monopolistic marketwill be the Average Cost structure. shape. same MR D (AR) However, because the products are differentiated in some Q1 Output / Sales way, the firm will only be able to sell extra output by lowering price.
  • 4.
    REAL ESTATE INDUSTRY  Real Estate Industry in India witnessed a historic boom during 2002 to 2007.  Real Estate Developers in India grew multifold very fast.  Land and property prices skyrocketed.  Many developers went for public issue of shares at very high valuations.  Attracted by liberalization of foreign investment regulations, International investors invested billions of dollars in Indian real estate sector.  A number of real estate companies went for IPOs between 2006 and 2008
  • 5.
    Real Estate Special Commercial Residential Hospitality Retail Space Economic Zones Office Space Space Space (SEZs) • The current contribution of Real Estate to India’s GDP is about 5% • FDI inflows worth more than $2.8 billion between 2000 and 2009 • Market size is $50 billion • Expected to be $180 billion by 2020
  • 6.
    C OMMERCIAL OFFICE S PACE Growth Drivers  Multinational companies (MNCs) and the growth of the services sector.  Significant growth in FDI Market Structure  Pan India presence  International players Outlook • Growth in services —telecom, financial services, IT & ITeS, etc.,
  • 7.
    Commercial Office SpaceAbsorption 10% 14% 8% Mumbai NCR Hyderbad 11% 23% Banglore Chennai Kolkata Pune 26% 8%
  • 8.
    C OMPANIES WISETRENDS IN SALES I NDUSTRIAL Crore 2003-04 2004-05 2005-06 2006-07 2007-08 2008-09 Larsen & 5600 9636.53 10392.03 12622.50 18410.05 27456.22 Turbo Bharat Heavy 1881.06 2743.71 2885.23 3803.77 3975.01 5261.15 Electricals Punj Lloyd 1459.16 1380.72 1328.37 2180.98 4421.17 6734.56 ABB 603.56 1044.87 1422.88 2154.03 3295.49 3580.52 TOTAL Larsen & Turbo 30.82% Bharat Punj Lloyd 51.69% ABB 5.91% Others 7.56% 4.02%
  • 9.
    R ESIDENTIAL SPACE Growth Drivers  Urban population estimated to reach 590 million by 2030  Number of nuclear families estimated to cross 300 million  16 to 64 age group—almost 64% of the total population  Growing demand for affordable housing  Easier access to loans Market Structure  Unorganized  Regional players are expanding to achieve a pan-India presence
  • 10.
    C OMPANIES WISE TRENDS IN SALES H OUSING Crore 2003-04 2004-05 2005-06 2006-07 2007-08 2008-09 (157) (129) (105) (104) (92) (84) DLF 442.52 411.77 983.94 1124.15 5516.39 2705.42 EmaarMGF 1026.90 926.22 Sobha 211.37 453.06 28.61 1056.52 1242.01 809.51 Ansal 149.45 184.32 319.08 718.25 823.02 631.70 TOTAL 3841.09 3909.79 5770.01 9428.56 16351.95 13986.87 2008-09 19.34% DLF EmmarMGF 6.62% Sobha 5.79% Ansal 63.73% 4.52% Others
  • 11.
    R ETAIL SPACE Growth Drivers  Growth in organized retailing  Entry of international retailers Segmentation  Organized retail contribution to the retail industry grew from 2% in 2003 to 5.5% in 2009  International retailers are growing through the franchisee route
  • 12.
    Absorption of OrganizedRetail Space Total 6% 4% 9% NCR Mumbai 43% Banglore 12% Kolkata Pune Chennai 5% Hyderbad 21%
  • 13.
    H OSPITALITY SPACE Growth Drivers  Increase in tourism, including both business and leisure travel  Medical tourism destination  International events Market Structure  Existing hotel operators are scaling up their operations.  Budget hotels and service apartments  Increasing presence of International players
  • 14.
    S PECIAL ECONOMIC Z ONES (SEZ S )  . Industry - Wise classification of formally approved SEZs Electronics 11% Hardware, IT/ITES/ 4% Biotechnology 5% 2% Engineering 5% 4% Others 69% Gems & Jewellery Pharmaceuticals Source: Edeliwiss, E&Y Research, ET 7 September
  • 15.
    Major Countries investingin Indian Real Estate 2%4% Dubai 10% Indonesia Singapore 25% 59% Malaysia Others Source: Industry sources, E&Y Research
  • 16.
    MAJOR INTERNATIONAL & DOMESTIC PLAYERS
  • 17.
    PREFERANCE AREAS IN MUMBAI Outside Mumbai 1% 3% Western Suburbs 3% 3% 5% Thane 29% Central Mumbai 12% Navi Mumbai Kalyan / Dombivali 15% South Mumbai 29% Western Suburbs beyond Dahisar
  • 18.
    COMPARING PRICE BETWEEN MUMBAI AND KOLKATA MAJOR PLAYERS IN REAL ESTATE COMMERCIAL MARKET COMPANY MUMBAI KOLKATA DLF 15000 11000 K RAHEJA Corp 14500 9000 EMAAR 18000 14000 SOBHA 10000 7000 UNITECH 12500 9500 GREENFIELD 16000 11000 PRESTIGE GROUP 11000 6500
  • 19.
    COMPARING PRICE BETWEEN MUMBAI AND KOLKATA RESIDENTIAL MARKET COMPANY MUMBAI KOLKATA DLF 10000 6500 KUMAR DEV. 9500 5000 Omaxe Builders 9000 6000 UNITECH 11000 6000 PARSVANATH 9000 6000
  • 20.
    CONCLUSIONS  Though the economic meltdown has tremendously affected this cosmopolitan city  It has made some good for the property investors, because the properties which were once sold at sky rocketing tags has come down immensely, making it people-affordable purchase.  With the market slowly picking up, and job opportunities steadily moving up, most top real estate players in commercial and residential stream like Hiranandani, Adarsh, Brigade,Prestige, and DLF group have once again commenced their new projects in Mumbai.  This time the target has been the middle and lower income group.  Thus with the new avenues slowly opening up in the economic front, and with the real estate initiating new projects at affordable cost, it is the ideal time for investors to make the right move on housing decision
  • 21.
    REFRENCES  www.99acres.com  www.indiahousing.com  www.ey.com  http://www.wikipedia.org