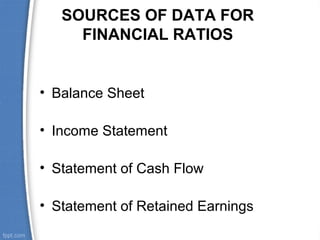
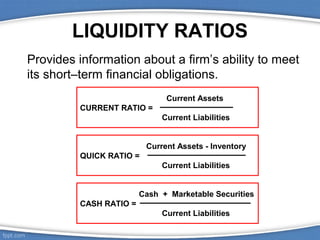
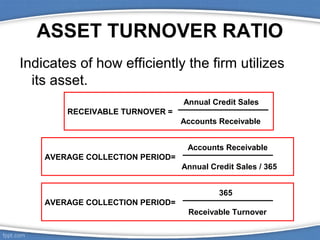
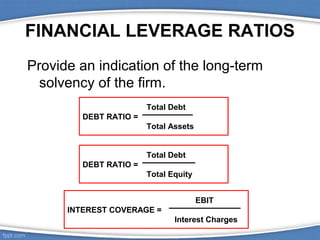
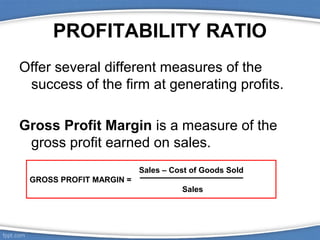
FINANCIAL RATIO
FINANCIAL RATIO
• A financial ratio (or accounting ratio)  is 
a  relative  magnitude  of  two  selected 
numerical  values  taken  from  an 
enterprise's financial statement.
SOURCES OF DATA FOR
FINANCIAL RATIOS

• Balance Sheet
• Income Statement
• Statement of Cash Flow
• Statement of Retained Earnings
PURPOSE AND TYPES OF RATIOS
• Liquidity ratios 
• Asset turnover ratios
• Financial leverage ratios
• Profitability ratios 
• Dividend policy ratios
PURPOSE AND TYPES OF RATIOS
Financial ratios allow for comparisons
•
•
•
•

between companies
between industries
between different time periods for one company
between a single company and its industry
average
LIQUIDITY RATIOS
Provides information about a firm’s ability to meet
its short–term financial obligations.
Current Assets
CURRENT RATIO =
Current Liabilities
Current Assets - Inventory
QUICK RATIO =
Current Liabilities
Cash + Marketable Securities
CASH RATIO =
Current Liabilities
ASSET TURNOVER RATIO
Indicates of how efficiently the firm utilizes
its asset.
Annual Credit Sales
RECEIVABLE TURNOVER =
Accounts Receivable
Accounts Receivable
AVERAGE COLLECTION PERIOD=
Annual Credit Sales / 365
365
AVERAGE COLLECTION PERIOD=
Receivable Turnover
ASSET TURNOVER RATIO
Cost of Goods Sold
INVENTORY TURNOVER =
Average Inventory

Average Inventory
INVENTORY PERIOD =
Annual Cost of Goods Sold / 365

365
INVENTORY PERIOD =
Inventory Turnover
FINANCIAL LEVERAGE RATIOS
Provide an indication of the long-term
solvency of the firm.
Total Debt
DEBT RATIO =
Total Assets
Total Debt
DEBT RATIO =
Total Equity
EBIT
INTEREST COVERAGE =
Interest Charges
PROFITABILITY RATIO
Offer several different measures of the
success of the firm at generating profits.
Gross Profit Margin is a measure of the
gross profit earned on sales.
Sales – Cost of Goods Sold
GROSS PROFIT MARGIN =
Sales
PROFITABILITY RATIO
Return on Assets is a measure of how
effectively the firm’s assets are being used
to generate profits.
Net Income
RETURN ON ASSETS =
Total Assets
PROFITABILITY RATIO
Return on Equity is the bottom line in
measure for the shareholder profits
earned for each dollar invested in the
firm’s stock.
Net Income

RETURN ON EQUITY=
Shareholder Equity
DIVIDEND POLICY RATIO
Provide insight into the dividend policy of the
firm and the prospects for future growth.
Dividends Per Share
DIVIDEND YIELD =
Share Price

Dividends Per Share
PAYOUT RATIO =
Earnings Per Share
USE AND LIMITATIONS OF
FINANCIAL RATIO
1. A reference point is needed
2. Most ratios by themselves are not highly meaningful
3. Year-end values may not be representative
4. Ratios are subjects to the limitations of accounting
methods
CAPITAL BUDGETING RATIO
• Net present value
• Profitability index
• Internal rate of return
• Modified internal rate of return
• Equivalent annuity

Financial ratios

  • 1.
  • 2.
    FINANCIAL RATIO • A financialratio (or accounting ratio)  is  a  relative  magnitude  of  two  selected  numerical  values  taken  from  an  enterprise's financial statement.
  • 3.
    SOURCES OF DATAFOR FINANCIAL RATIOS • Balance Sheet • Income Statement • Statement of Cash Flow • Statement of Retained Earnings
  • 4.
    PURPOSE AND TYPESOF RATIOS • Liquidity ratios  • Asset turnover ratios • Financial leverage ratios • Profitability ratios  • Dividend policy ratios
  • 5.
    PURPOSE AND TYPESOF RATIOS Financial ratios allow for comparisons • • • • between companies between industries between different time periods for one company between a single company and its industry average
  • 6.
    LIQUIDITY RATIOS Provides informationabout a firm’s ability to meet its short–term financial obligations. Current Assets CURRENT RATIO = Current Liabilities Current Assets - Inventory QUICK RATIO = Current Liabilities Cash + Marketable Securities CASH RATIO = Current Liabilities
  • 7.
    ASSET TURNOVER RATIO Indicatesof how efficiently the firm utilizes its asset. Annual Credit Sales RECEIVABLE TURNOVER = Accounts Receivable Accounts Receivable AVERAGE COLLECTION PERIOD= Annual Credit Sales / 365 365 AVERAGE COLLECTION PERIOD= Receivable Turnover
  • 8.
    ASSET TURNOVER RATIO Costof Goods Sold INVENTORY TURNOVER = Average Inventory Average Inventory INVENTORY PERIOD = Annual Cost of Goods Sold / 365 365 INVENTORY PERIOD = Inventory Turnover
  • 9.
    FINANCIAL LEVERAGE RATIOS Providean indication of the long-term solvency of the firm. Total Debt DEBT RATIO = Total Assets Total Debt DEBT RATIO = Total Equity EBIT INTEREST COVERAGE = Interest Charges
  • 10.
    PROFITABILITY RATIO Offer severaldifferent measures of the success of the firm at generating profits. Gross Profit Margin is a measure of the gross profit earned on sales. Sales – Cost of Goods Sold GROSS PROFIT MARGIN = Sales
  • 11.
    PROFITABILITY RATIO Return onAssets is a measure of how effectively the firm’s assets are being used to generate profits. Net Income RETURN ON ASSETS = Total Assets
  • 12.
    PROFITABILITY RATIO Return onEquity is the bottom line in measure for the shareholder profits earned for each dollar invested in the firm’s stock. Net Income RETURN ON EQUITY= Shareholder Equity
  • 13.
    DIVIDEND POLICY RATIO Provideinsight into the dividend policy of the firm and the prospects for future growth. Dividends Per Share DIVIDEND YIELD = Share Price Dividends Per Share PAYOUT RATIO = Earnings Per Share
  • 14.
    USE AND LIMITATIONSOF FINANCIAL RATIO 1. A reference point is needed 2. Most ratios by themselves are not highly meaningful 3. Year-end values may not be representative 4. Ratios are subjects to the limitations of accounting methods
  • 15.
    CAPITAL BUDGETING RATIO •Net present value • Profitability index • Internal rate of return • Modified internal rate of return • Equivalent annuity