The document explains key concepts of revenue in economics, including total revenue (TR), average revenue (AR), and marginal revenue (MR), along with their relationships and formulas. It distinguishes between perfect competition and imperfect competition in market structures, detailing how these affect revenue calculations. Additionally, it discusses the elasticity of demand and its relationship with average revenue.
Revenue
Revenue is theincome that a business
has form its normal business activities,
usually form the sale of goods and
services to customers.
3.
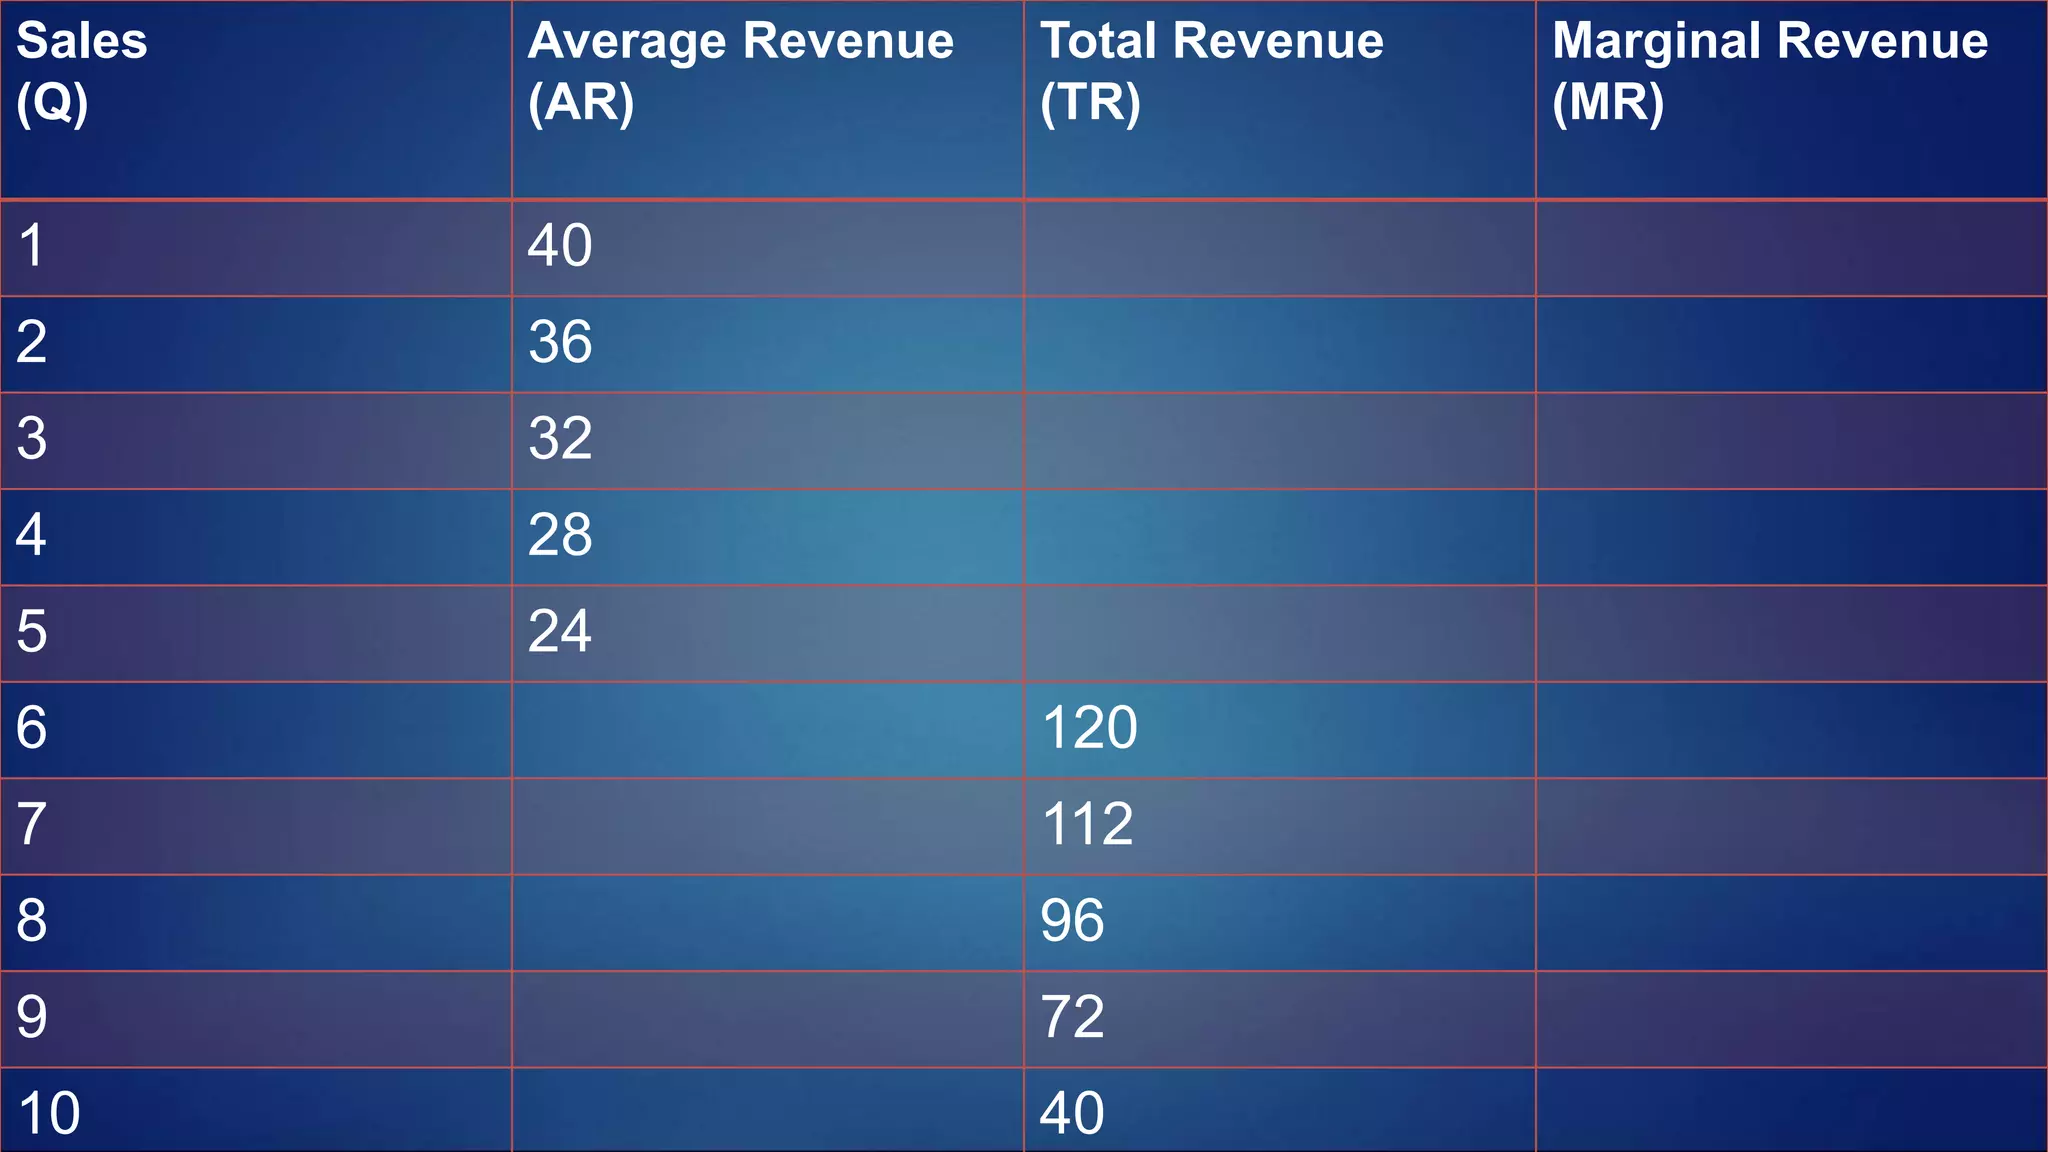
Total Revenue(TR)::This isthe total receipts of money received
by a firm from the sale of its good or service in a given time Period.
TR = P *
Q
Avarege Revenue (AR)::This is the amount of money
receive, or average, for each good sold.
AR =
TR
Q
----
P * Q
Q
--------- P
4.
Marginal Revenue (MR)::
Marginal
costis the cost of producing one more
unit of output. It is the revenue
received from selling one more unit of
output. It is the extra revenue at the
margin.
Relationship Between ARAnd MR
In Perfect Competition
Perfect competition :: The perfect
competition is a market structure where a
large number of buyers and sellers are
present and all are engaged in the buying
and selling of the homogeneous products at
a single price prevailing in the market.
Relationship Between ARAnd MR In Imperfect
Competition
Imperfect competition is a competitive market situation
where there are many sellers but they are selling heterogeneous
goods as opposed to the perfect competitive market scenario. As
the name suggests competitive markets that are imperfect in
nature.
11.
O 1 23 4 5 6 7 8 9 10 X
25
20
15
10
5
Y
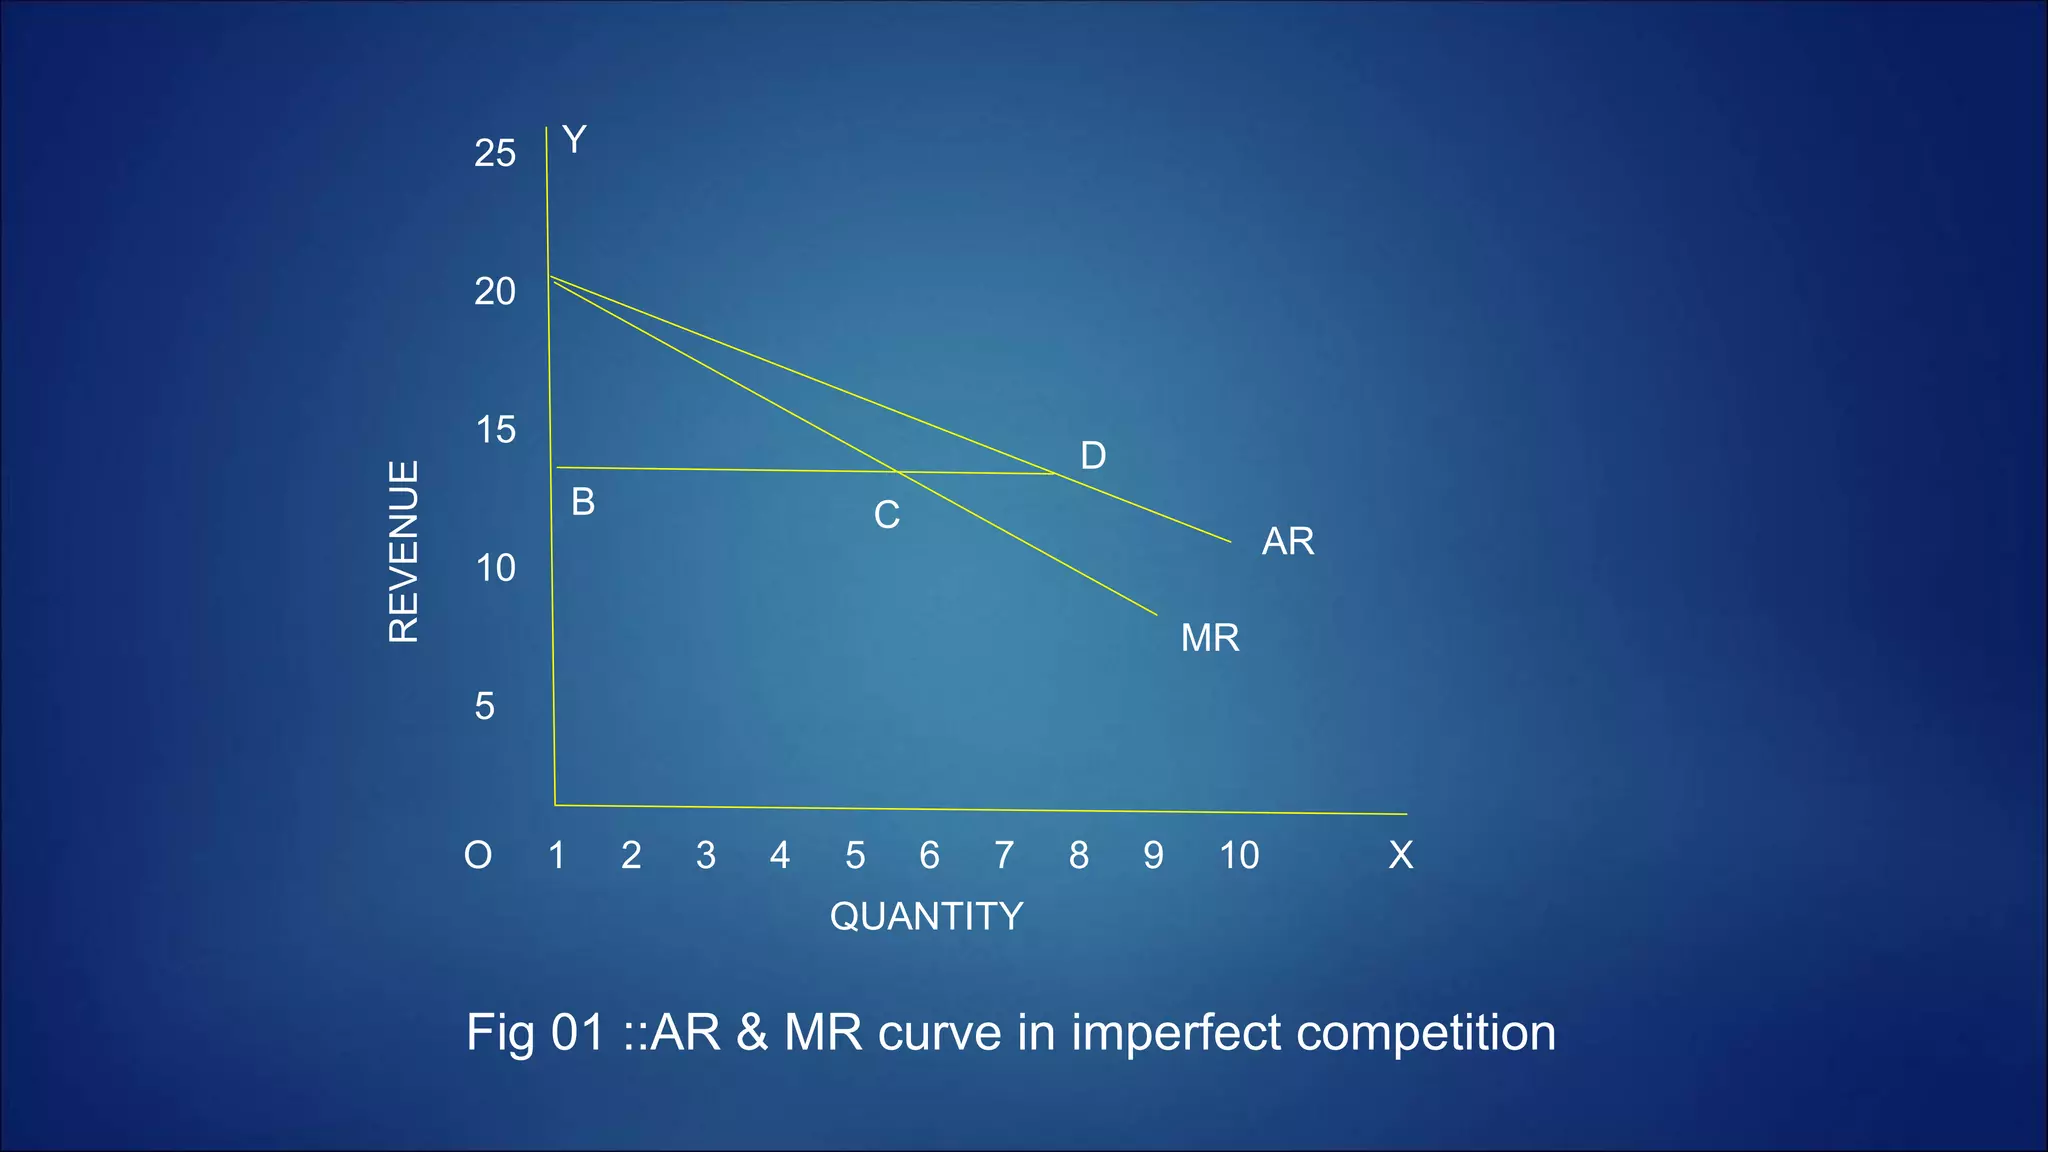
AR
MR
D
CB
Fig 01 ::AR & MR curve in imperfect competition
QUANTITY
REVENUE
12.
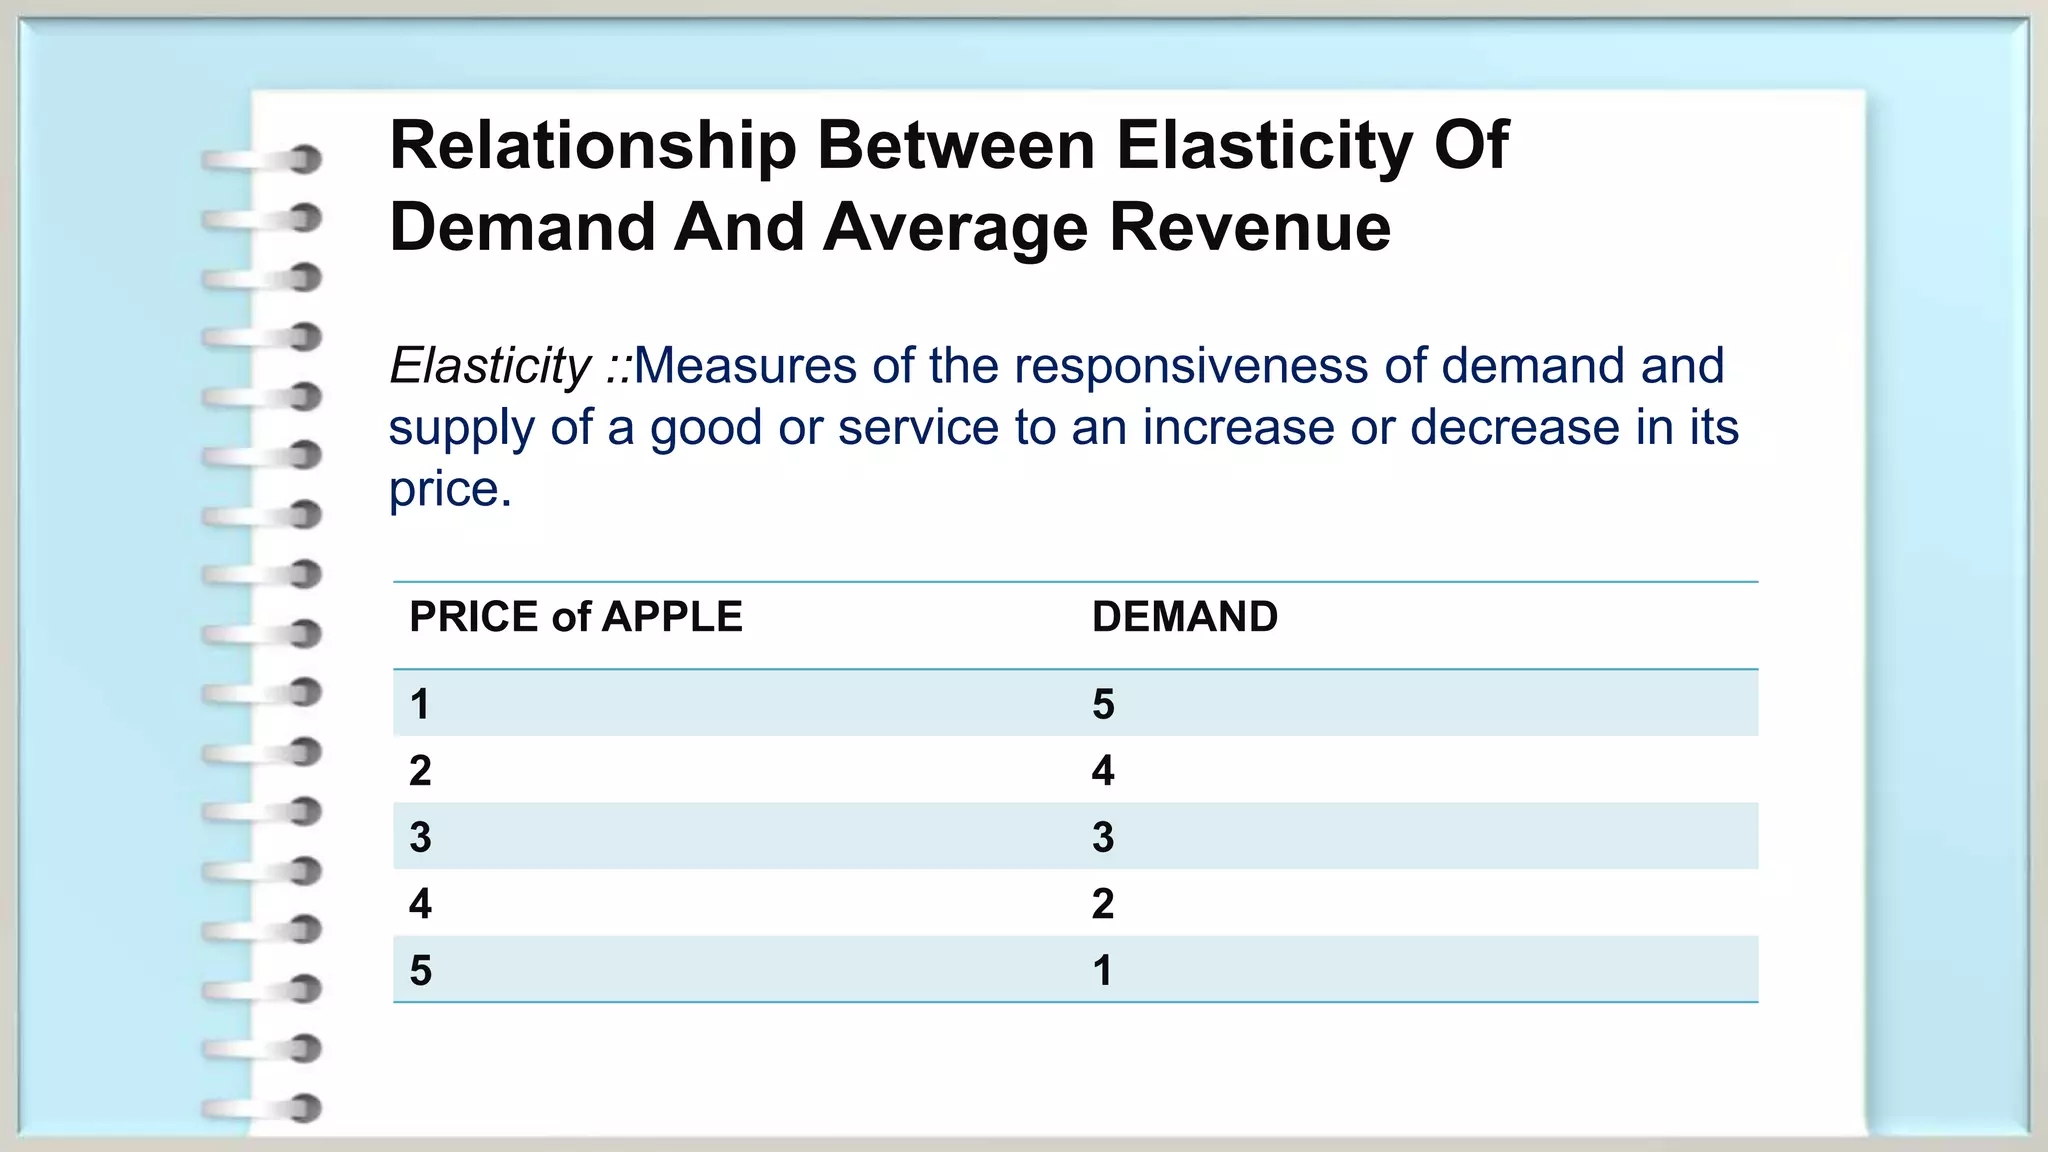
Relationship Between ElasticityOf
Demand And Average Revenue
Elasticity ::Measures of the responsiveness of demand and
supply of a good or service to an increase or decrease in its
price.
PRICE of APPLE DEMAND
1 5
2 4
3 3
4 2
5 1
13.
6
5
4
3
2
1
O 1 23 4 5 X
Y
price
Demand MR AR
6
5
4
3
2
1
O 1 2 3 4 5 X
Y
price
Demand
a
b
c
fig 01: Demand Curve
Fig 02 : Relationship between DC & AR