SlideShare a Scribd company logo
1 of 27
What are fixed/ variable costs?
What is revenue and what is profit formulas?
Concept of Revenue
• The money income which a producer gets from the sale of his product is
known as revenue of the firm.
• The amount of money that a producer receives in exchange for the sale
proceeds is known as revenue.
• The concept of revenue should not be confused with the concept of profit. Profit
of a firm is estimated as the difference between revenue and cost related to the
production of a commodity (Profit = Revenue –Cost).
Revenue has three aspects:
Total Revenue
Average Revenue
Marginal Revenue
Types of Revenue
Total Revenue (TR)
• Total Revenue refers to total receipts from the sale of a given quantity of a
commodity. It is the total income of a firm. Total revenue is obtained by
multiplying the quantity of the commodity.
• Total Revenue = Quantity x Price
Average Revenue (AR)
• Average revenue refers to revenue per unit of output sold. It is obtained by
dividing the total revenue by the number of units sold.
AR and Price are the Same
We knew, AR is equal to per unit sale receipts and price is always per unit. Since sellers receive
revenue according to price, price and AR are one and the same thing. This can be explained as
under: TR = Quantity x Price= So AR=P
• Marginal Revenue: is the additional revenue generated from the sale of an
additional unit of output. It is the change in TR from sale of one more unit of a
commodity.
• MR = ΔTR/ΔQ
• MR=TRn – TRn-1
(Here, MR = Marginal revenue, ΔTR= Change in total revenue, ΔQ= Change in
output, TRn= Total revenue from ‘n’ units of the output and TRn-1= Total
revenue from ‘n – 1’ units of the output.)
• Marginal revenue is the addition to total revenue on account of sale of one more
unit of output
• TR is summation of MR: Total Revenue can also be calculated as the sum of
marginal revenues of all the units sold.
• It means, TR = MR + MR+ MR+ ……………….MRn
Relationship Between Revenue Concepts
The relationship between different revenue concepts can be discussed under two situations:
• When Price remains Constant (It happens under Perfect competition). In this situation,
firm has to accept the same price as determined by the industry. It means, any quantity of a
commodity can be sold at that particular price.
• When Price Falls with rise in output (It happens under Imperfect Competition). In this
situation, firm follows its own pricing policy. However, it can increase sales only by
reducing the price.
Relationship between AR and MR (When Price remains Constant)
• When price remains same at all output levels (like in case of perfect competition), no firm is in
a position to influence the market price of the product. A firm can sell more quantity of
output at the same price.
• It means, the revenue from every additional unit (MR) is equal to AR As a result, both AR and
MR curves coincide in a horizontal straight line parallel to the X-axis as shown.
Relationship between TR and Price line
When price remains constant at all the levels of output, then
Price = AR = MR. Therefore, price line is the same as MR
curve. Also, TR = . So, the area under MR curve or price line
will be equal to TR. In Fig., TR at MR level of output = OP x
OQ =Area under price line.
Relationship between AR and MR (When Price Falls with rise in output)
When firms can increase their volume of sales only by decreasing the price, then AR falls with
increase in sale. It means, revenue from every additional unit (i.e. MR) will be less than AR. As a
result, both AR and MR curves slope downwards from left to right.
General Relationship Between AR and MR
The relationship between AR and MR depends on
whether the price remains same or falls with rise in
output. However, if nothing is mentioned about the
nature of price with rise in output, then the following
general relation exists between AR and MR:
• AR increases as long as MR is higher than AR
(or when MR > AR, AR increases).
• AR is maximum and constant when MR is
equal to AR (or when MR = AR, AR is
maximum).
• AR falls when MR is less than AR (or when
MR < AR>
It must be noted that specific relationship between
AR and MR depends upon the relation of price with
output, Le, whether price remains same or varies
inversely with output.
TR and MR (When Price Falls with rise in output)
AR and MR Curves under Monopoly and Monopolistic Competition
Both, Monopoly and Monopolistic Competition fall under the category of Imperfect
Competition. Therefore, AR and MR curves slope downwards as more units can be sold only by
reducing the price. However, there is one major difference between AR and MR curves of
monopoly and monopolistic competition.
Under monopolistic competition, the AR and MR curves are more elastic as compared to those
of Monopoly. It happens because of the presence of close substitutes under monopolistic
competition and absence of close substitutes under monopoly. So, when price of a commodity is
increased in both the markets, then proportionate fail in demand under monopoly is less than
proportionate fall in demand under monopolistic competition.
Relationship Between TR MR and AR
The TR curve rises as long as MR is positive. It reaches its
highest point (point A) when MR is zero (point B) and it
starts declining when MR becomes negative. The
relationship can be summed up as under:
• As long as MR is positive, TR increases (or when TR
rises, MR is positive).
• When MR is zero, TR is at its maximum point (or when
TR is maximum, MR is zero).
• When MR becomes negative, TR starts falling (or when
TR falls, MR is negative).
Reach a point in a business venture when the
profits are equal to the costs.
To gain an understanding of calculating break-even we will use the
example of a young entrepreneur wishing to start up a business
delivering packages of fruit and veg.
He knows that the last local shop in his area closed last year.
Sensibly, he has carried out market research which indicates that
there will be a good level of demand, but before he begins he needs
to know how profitable the business might be. He has also fully
researched the costs of starting up as a deliveryman and the costs of
purchasing supplies.
The costs he has researched are as follows:
• cost of delivery van purchase £6000;
• insurance and road tax £100 per month;
• petrol £10.00 per day;
• average cost of fruit and veg box £5.00;
• Salaries - £1150 per month;
• loan repayment £500 per month for twelve months.
His market research indicates that the fruit and veg boxes will
have an average sales price of £9.00.
The question then is how many boxes will he need to sell to
cover all his costs, i.e. to break even?
He decides to calculate break-even on a monthly basis.
Fixed costs
Loan - £500 per month
Petrol costs - £250 per month
Insurance/road tax - £100 per month
Salaries - £1150 per month
Total fixed costs - £2000 per month
Variable costs
£5.00 per box
Sales revenue
£9.00 per box
Calculating break-even point using the contribution method.
Once we have calculated costs, the next step in calculating
break-even output or sales is finding out how much
contribution each item sold produces for the business.
Every product made has a variable cost and a selling price
(which must obviously be higher).
The difference between the selling price per unit and the
variable cost per unit is known as the CONTRIBUTION towards
covering the business’s fixed costs.
There is a simple formula for calculating break-even output.
Break-even output = Fixed costs
Contribution per unit.
Contribution per unit = Selling price – Variable costs (per
unit)
Break-even output = Fixed costs
Contribution per unit.
Contribution per unit = Selling price – Variable costs (per unit)
Break even in units = £2,000
£9 - £5
Break even in units = £2,000 / 4
Break even in units = 500 boxes
We can now see that to break even our deliveryman must
sell 500 fruit and veg boxes per month.
• If he sells more than 500 boxes he will make a profit.
• If he sells less than 500 boxes he will make a loss.
At break-even point the
total contribution equals
the total fixed costs.
Break-even analysis also allows us to calculate the profit or
loss a business will make at different levels of output.
This will always be important – after all our grocery seller may
wish to go into business only if his profits are likely to be at a
certain level.
First of all calculate the
break-even output, in the
above case we know it is
500 boxes per month.
As a result of his market research he believes that he can sell 650
boxes a month.
He now wants to know what his profit will be at that level of
sales. To find out how much profit will be made, we again use the
idea of contribution.
In this case predicted sales are 650. Break-even sales are 500.
Profit per sales = Predicted sales – Break even sales x
Contribution per unit
Profit per sales = 650 – 500 x £4
Profit per sales = 150 x £4
Profit per sales = £600
His profits per month on sales of 650 boxes will be £600.

More Related Content

Similar to Revenue and BEA additional of ecoconomy.pptx

monopoly (1).pdf
monopoly (1).pdfmonopoly (1).pdf
monopoly (1).pdfAshin Anish
 
Market structure final perfect competition
Market structure final  perfect competitionMarket structure final  perfect competition
Market structure final perfect competitionTej Kiran
 
Monopolistic Equilibrium in short and long run
Monopolistic Equilibrium in short and long runMonopolistic Equilibrium in short and long run
Monopolistic Equilibrium in short and long runShakti Yadav
 
Price and Output Determination.pptx
Price and Output Determination.pptxPrice and Output Determination.pptx
Price and Output Determination.pptxGinoLacandula1
 
BREAK-EVEN ANALYSIS
BREAK-EVEN ANALYSISBREAK-EVEN ANALYSIS
BREAK-EVEN ANALYSISAsrar Mohd
 
Chap. 7. Market Structure.pptx
Chap. 7. Market Structure.pptxChap. 7. Market Structure.pptx
Chap. 7. Market Structure.pptxRAMOSERLYNP
 
Perfect competition & Monopoly
Perfect competition & MonopolyPerfect competition & Monopoly
Perfect competition & MonopolyNomanshah98
 
best Revenue for my own class and you can not find it because of me.pptx
best Revenue for my own class and you can not find it because of me.pptxbest Revenue for my own class and you can not find it because of me.pptx
best Revenue for my own class and you can not find it because of me.pptxSakshiSingh606019
 
Accounting Economics And Business 17 Nov
Accounting Economics And Business 17  NovAccounting Economics And Business 17  Nov
Accounting Economics And Business 17 NovDr. Trilok Kumar Jain
 
Perfectly Competitive Market.ppt
Perfectly Competitive Market.pptPerfectly Competitive Market.ppt
Perfectly Competitive Market.pptUmarFarooq901006
 
Pricing & Output Decision.ppt
Pricing & Output Decision.pptPricing & Output Decision.ppt
Pricing & Output Decision.pptJetcheDelasPias
 
Market structure and its features
Market structure and its featuresMarket structure and its features
Market structure and its featuresSwapnil Thakur
 

Similar to Revenue and BEA additional of ecoconomy.pptx (20)

Law of Supply
Law of SupplyLaw of Supply
Law of Supply
 
monopoly (1).pdf
monopoly (1).pdfmonopoly (1).pdf
monopoly (1).pdf
 
Revenue
RevenueRevenue
Revenue
 
Market structure
Market structureMarket structure
Market structure
 
Revenue
RevenueRevenue
Revenue
 
Market structure final perfect competition
Market structure final  perfect competitionMarket structure final  perfect competition
Market structure final perfect competition
 
Monopolistic Equilibrium in short and long run
Monopolistic Equilibrium in short and long runMonopolistic Equilibrium in short and long run
Monopolistic Equilibrium in short and long run
 
Price and Output Determination.pptx
Price and Output Determination.pptxPrice and Output Determination.pptx
Price and Output Determination.pptx
 
Pricing
PricingPricing
Pricing
 
BREAK-EVEN ANALYSIS
BREAK-EVEN ANALYSISBREAK-EVEN ANALYSIS
BREAK-EVEN ANALYSIS
 
Chap. 7. Market Structure.pptx
Chap. 7. Market Structure.pptxChap. 7. Market Structure.pptx
Chap. 7. Market Structure.pptx
 
Perfectly competitive market
Perfectly competitive marketPerfectly competitive market
Perfectly competitive market
 
Perfect competition & Monopoly
Perfect competition & MonopolyPerfect competition & Monopoly
Perfect competition & Monopoly
 
Revenue
RevenueRevenue
Revenue
 
best Revenue for my own class and you can not find it because of me.pptx
best Revenue for my own class and you can not find it because of me.pptxbest Revenue for my own class and you can not find it because of me.pptx
best Revenue for my own class and you can not find it because of me.pptx
 
Accounting Economics And Business 17 Nov
Accounting Economics And Business 17  NovAccounting Economics And Business 17  Nov
Accounting Economics And Business 17 Nov
 
Fm
FmFm
Fm
 
Perfectly Competitive Market.ppt
Perfectly Competitive Market.pptPerfectly Competitive Market.ppt
Perfectly Competitive Market.ppt
 
Pricing & Output Decision.ppt
Pricing & Output Decision.pptPricing & Output Decision.ppt
Pricing & Output Decision.ppt
 
Market structure and its features
Market structure and its featuresMarket structure and its features
Market structure and its features
 

Recently uploaded

_Math 4-Q4 Week 5.pptx Steps in Collecting Data
_Math 4-Q4 Week 5.pptx Steps in Collecting Data_Math 4-Q4 Week 5.pptx Steps in Collecting Data
_Math 4-Q4 Week 5.pptx Steps in Collecting DataJhengPantaleon
 
Enzyme, Pharmaceutical Aids, Miscellaneous Last Part of Chapter no 5th.pdf
Enzyme, Pharmaceutical Aids, Miscellaneous Last Part of Chapter no 5th.pdfEnzyme, Pharmaceutical Aids, Miscellaneous Last Part of Chapter no 5th.pdf
Enzyme, Pharmaceutical Aids, Miscellaneous Last Part of Chapter no 5th.pdfSumit Tiwari
 
Science 7 - LAND and SEA BREEZE and its Characteristics
Science 7 - LAND and SEA BREEZE and its CharacteristicsScience 7 - LAND and SEA BREEZE and its Characteristics
Science 7 - LAND and SEA BREEZE and its CharacteristicsKarinaGenton
 
Kisan Call Centre - To harness potential of ICT in Agriculture by answer farm...
Kisan Call Centre - To harness potential of ICT in Agriculture by answer farm...Kisan Call Centre - To harness potential of ICT in Agriculture by answer farm...
Kisan Call Centre - To harness potential of ICT in Agriculture by answer farm...Krashi Coaching
 
भारत-रोम व्यापार.pptx, Indo-Roman Trade,
भारत-रोम व्यापार.pptx, Indo-Roman Trade,भारत-रोम व्यापार.pptx, Indo-Roman Trade,
भारत-रोम व्यापार.pptx, Indo-Roman Trade,Virag Sontakke
 
BASLIQ CURRENT LOOKBOOK LOOKBOOK(1) (1).pdf
BASLIQ CURRENT LOOKBOOK  LOOKBOOK(1) (1).pdfBASLIQ CURRENT LOOKBOOK  LOOKBOOK(1) (1).pdf
BASLIQ CURRENT LOOKBOOK LOOKBOOK(1) (1).pdfSoniaTolstoy
 
Incoming and Outgoing Shipments in 1 STEP Using Odoo 17
Incoming and Outgoing Shipments in 1 STEP Using Odoo 17Incoming and Outgoing Shipments in 1 STEP Using Odoo 17
Incoming and Outgoing Shipments in 1 STEP Using Odoo 17Celine George
 
CARE OF CHILD IN INCUBATOR..........pptx
CARE OF CHILD IN INCUBATOR..........pptxCARE OF CHILD IN INCUBATOR..........pptx
CARE OF CHILD IN INCUBATOR..........pptxGaneshChakor2
 
Blooming Together_ Growing a Community Garden Worksheet.docx
Blooming Together_ Growing a Community Garden Worksheet.docxBlooming Together_ Growing a Community Garden Worksheet.docx
Blooming Together_ Growing a Community Garden Worksheet.docxUnboundStockton
 
“Oh GOSH! Reflecting on Hackteria's Collaborative Practices in a Global Do-It...
“Oh GOSH! Reflecting on Hackteria's Collaborative Practices in a Global Do-It...“Oh GOSH! Reflecting on Hackteria's Collaborative Practices in a Global Do-It...
“Oh GOSH! Reflecting on Hackteria's Collaborative Practices in a Global Do-It...Marc Dusseiller Dusjagr
 
Employee wellbeing at the workplace.pptx
Employee wellbeing at the workplace.pptxEmployee wellbeing at the workplace.pptx
Employee wellbeing at the workplace.pptxNirmalaLoungPoorunde1
 
internship ppt on smartinternz platform as salesforce developer
internship ppt on smartinternz platform as salesforce developerinternship ppt on smartinternz platform as salesforce developer
internship ppt on smartinternz platform as salesforce developerunnathinaik
 
Class 11 Legal Studies Ch-1 Concept of State .pdf
Class 11 Legal Studies Ch-1 Concept of State .pdfClass 11 Legal Studies Ch-1 Concept of State .pdf
Class 11 Legal Studies Ch-1 Concept of State .pdfakmcokerachita
 
SOCIAL AND HISTORICAL CONTEXT - LFTVD.pptx
SOCIAL AND HISTORICAL CONTEXT - LFTVD.pptxSOCIAL AND HISTORICAL CONTEXT - LFTVD.pptx
SOCIAL AND HISTORICAL CONTEXT - LFTVD.pptxiammrhaywood
 
18-04-UA_REPORT_MEDIALITERAСY_INDEX-DM_23-1-final-eng.pdf
18-04-UA_REPORT_MEDIALITERAСY_INDEX-DM_23-1-final-eng.pdf18-04-UA_REPORT_MEDIALITERAСY_INDEX-DM_23-1-final-eng.pdf
18-04-UA_REPORT_MEDIALITERAСY_INDEX-DM_23-1-final-eng.pdfssuser54595a
 
Pharmacognosy Flower 3. Compositae 2023.pdf
Pharmacognosy Flower 3. Compositae 2023.pdfPharmacognosy Flower 3. Compositae 2023.pdf
Pharmacognosy Flower 3. Compositae 2023.pdfMahmoud M. Sallam
 
A Critique of the Proposed National Education Policy Reform
A Critique of the Proposed National Education Policy ReformA Critique of the Proposed National Education Policy Reform
A Critique of the Proposed National Education Policy ReformChameera Dedduwage
 

Recently uploaded (20)

_Math 4-Q4 Week 5.pptx Steps in Collecting Data
_Math 4-Q4 Week 5.pptx Steps in Collecting Data_Math 4-Q4 Week 5.pptx Steps in Collecting Data
_Math 4-Q4 Week 5.pptx Steps in Collecting Data
 
Enzyme, Pharmaceutical Aids, Miscellaneous Last Part of Chapter no 5th.pdf
Enzyme, Pharmaceutical Aids, Miscellaneous Last Part of Chapter no 5th.pdfEnzyme, Pharmaceutical Aids, Miscellaneous Last Part of Chapter no 5th.pdf
Enzyme, Pharmaceutical Aids, Miscellaneous Last Part of Chapter no 5th.pdf
 
Model Call Girl in Tilak Nagar Delhi reach out to us at 🔝9953056974🔝
Model Call Girl in Tilak Nagar Delhi reach out to us at 🔝9953056974🔝Model Call Girl in Tilak Nagar Delhi reach out to us at 🔝9953056974🔝
Model Call Girl in Tilak Nagar Delhi reach out to us at 🔝9953056974🔝
 
Science 7 - LAND and SEA BREEZE and its Characteristics
Science 7 - LAND and SEA BREEZE and its CharacteristicsScience 7 - LAND and SEA BREEZE and its Characteristics
Science 7 - LAND and SEA BREEZE and its Characteristics
 
Kisan Call Centre - To harness potential of ICT in Agriculture by answer farm...
Kisan Call Centre - To harness potential of ICT in Agriculture by answer farm...Kisan Call Centre - To harness potential of ICT in Agriculture by answer farm...
Kisan Call Centre - To harness potential of ICT in Agriculture by answer farm...
 
Staff of Color (SOC) Retention Efforts DDSD
Staff of Color (SOC) Retention Efforts DDSDStaff of Color (SOC) Retention Efforts DDSD
Staff of Color (SOC) Retention Efforts DDSD
 
भारत-रोम व्यापार.pptx, Indo-Roman Trade,
भारत-रोम व्यापार.pptx, Indo-Roman Trade,भारत-रोम व्यापार.pptx, Indo-Roman Trade,
भारत-रोम व्यापार.pptx, Indo-Roman Trade,
 
BASLIQ CURRENT LOOKBOOK LOOKBOOK(1) (1).pdf
BASLIQ CURRENT LOOKBOOK  LOOKBOOK(1) (1).pdfBASLIQ CURRENT LOOKBOOK  LOOKBOOK(1) (1).pdf
BASLIQ CURRENT LOOKBOOK LOOKBOOK(1) (1).pdf
 
Incoming and Outgoing Shipments in 1 STEP Using Odoo 17
Incoming and Outgoing Shipments in 1 STEP Using Odoo 17Incoming and Outgoing Shipments in 1 STEP Using Odoo 17
Incoming and Outgoing Shipments in 1 STEP Using Odoo 17
 
CARE OF CHILD IN INCUBATOR..........pptx
CARE OF CHILD IN INCUBATOR..........pptxCARE OF CHILD IN INCUBATOR..........pptx
CARE OF CHILD IN INCUBATOR..........pptx
 
Blooming Together_ Growing a Community Garden Worksheet.docx
Blooming Together_ Growing a Community Garden Worksheet.docxBlooming Together_ Growing a Community Garden Worksheet.docx
Blooming Together_ Growing a Community Garden Worksheet.docx
 
“Oh GOSH! Reflecting on Hackteria's Collaborative Practices in a Global Do-It...
“Oh GOSH! Reflecting on Hackteria's Collaborative Practices in a Global Do-It...“Oh GOSH! Reflecting on Hackteria's Collaborative Practices in a Global Do-It...
“Oh GOSH! Reflecting on Hackteria's Collaborative Practices in a Global Do-It...
 
Employee wellbeing at the workplace.pptx
Employee wellbeing at the workplace.pptxEmployee wellbeing at the workplace.pptx
Employee wellbeing at the workplace.pptx
 
internship ppt on smartinternz platform as salesforce developer
internship ppt on smartinternz platform as salesforce developerinternship ppt on smartinternz platform as salesforce developer
internship ppt on smartinternz platform as salesforce developer
 
Class 11 Legal Studies Ch-1 Concept of State .pdf
Class 11 Legal Studies Ch-1 Concept of State .pdfClass 11 Legal Studies Ch-1 Concept of State .pdf
Class 11 Legal Studies Ch-1 Concept of State .pdf
 
SOCIAL AND HISTORICAL CONTEXT - LFTVD.pptx
SOCIAL AND HISTORICAL CONTEXT - LFTVD.pptxSOCIAL AND HISTORICAL CONTEXT - LFTVD.pptx
SOCIAL AND HISTORICAL CONTEXT - LFTVD.pptx
 
18-04-UA_REPORT_MEDIALITERAСY_INDEX-DM_23-1-final-eng.pdf
18-04-UA_REPORT_MEDIALITERAСY_INDEX-DM_23-1-final-eng.pdf18-04-UA_REPORT_MEDIALITERAСY_INDEX-DM_23-1-final-eng.pdf
18-04-UA_REPORT_MEDIALITERAСY_INDEX-DM_23-1-final-eng.pdf
 
Pharmacognosy Flower 3. Compositae 2023.pdf
Pharmacognosy Flower 3. Compositae 2023.pdfPharmacognosy Flower 3. Compositae 2023.pdf
Pharmacognosy Flower 3. Compositae 2023.pdf
 
A Critique of the Proposed National Education Policy Reform
A Critique of the Proposed National Education Policy ReformA Critique of the Proposed National Education Policy Reform
A Critique of the Proposed National Education Policy Reform
 
TataKelola dan KamSiber Kecerdasan Buatan v022.pdf
TataKelola dan KamSiber Kecerdasan Buatan v022.pdfTataKelola dan KamSiber Kecerdasan Buatan v022.pdf
TataKelola dan KamSiber Kecerdasan Buatan v022.pdf
 

Revenue and BEA additional of ecoconomy.pptx

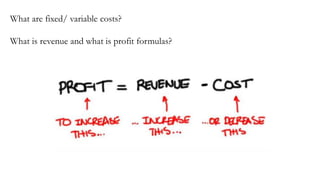
  • 1. What are fixed/ variable costs? What is revenue and what is profit formulas?
  • 2. Concept of Revenue • The money income which a producer gets from the sale of his product is known as revenue of the firm. • The amount of money that a producer receives in exchange for the sale proceeds is known as revenue. • The concept of revenue should not be confused with the concept of profit. Profit of a firm is estimated as the difference between revenue and cost related to the production of a commodity (Profit = Revenue –Cost). Revenue has three aspects: Total Revenue Average Revenue Marginal Revenue
  • 3. Types of Revenue Total Revenue (TR) • Total Revenue refers to total receipts from the sale of a given quantity of a commodity. It is the total income of a firm. Total revenue is obtained by multiplying the quantity of the commodity. • Total Revenue = Quantity x Price Average Revenue (AR) • Average revenue refers to revenue per unit of output sold. It is obtained by dividing the total revenue by the number of units sold. AR and Price are the Same We knew, AR is equal to per unit sale receipts and price is always per unit. Since sellers receive revenue according to price, price and AR are one and the same thing. This can be explained as under: TR = Quantity x Price= So AR=P
  • 4. • Marginal Revenue: is the additional revenue generated from the sale of an additional unit of output. It is the change in TR from sale of one more unit of a commodity. • MR = ΔTR/ΔQ • MR=TRn – TRn-1 (Here, MR = Marginal revenue, ΔTR= Change in total revenue, ΔQ= Change in output, TRn= Total revenue from ‘n’ units of the output and TRn-1= Total revenue from ‘n – 1’ units of the output.) • Marginal revenue is the addition to total revenue on account of sale of one more unit of output • TR is summation of MR: Total Revenue can also be calculated as the sum of marginal revenues of all the units sold. • It means, TR = MR + MR+ MR+ ……………….MRn
  • 5. Relationship Between Revenue Concepts The relationship between different revenue concepts can be discussed under two situations: • When Price remains Constant (It happens under Perfect competition). In this situation, firm has to accept the same price as determined by the industry. It means, any quantity of a commodity can be sold at that particular price. • When Price Falls with rise in output (It happens under Imperfect Competition). In this situation, firm follows its own pricing policy. However, it can increase sales only by reducing the price.
  • 6. Relationship between AR and MR (When Price remains Constant) • When price remains same at all output levels (like in case of perfect competition), no firm is in a position to influence the market price of the product. A firm can sell more quantity of output at the same price. • It means, the revenue from every additional unit (MR) is equal to AR As a result, both AR and MR curves coincide in a horizontal straight line parallel to the X-axis as shown.
  • 7. Relationship between TR and Price line When price remains constant at all the levels of output, then Price = AR = MR. Therefore, price line is the same as MR curve. Also, TR = . So, the area under MR curve or price line will be equal to TR. In Fig., TR at MR level of output = OP x OQ =Area under price line.
  • 8. Relationship between AR and MR (When Price Falls with rise in output) When firms can increase their volume of sales only by decreasing the price, then AR falls with increase in sale. It means, revenue from every additional unit (i.e. MR) will be less than AR. As a result, both AR and MR curves slope downwards from left to right.
  • 9. General Relationship Between AR and MR The relationship between AR and MR depends on whether the price remains same or falls with rise in output. However, if nothing is mentioned about the nature of price with rise in output, then the following general relation exists between AR and MR: • AR increases as long as MR is higher than AR (or when MR > AR, AR increases). • AR is maximum and constant when MR is equal to AR (or when MR = AR, AR is maximum). • AR falls when MR is less than AR (or when MR < AR> It must be noted that specific relationship between AR and MR depends upon the relation of price with output, Le, whether price remains same or varies inversely with output.
  • 10. TR and MR (When Price Falls with rise in output)
  • 11. AR and MR Curves under Monopoly and Monopolistic Competition Both, Monopoly and Monopolistic Competition fall under the category of Imperfect Competition. Therefore, AR and MR curves slope downwards as more units can be sold only by reducing the price. However, there is one major difference between AR and MR curves of monopoly and monopolistic competition. Under monopolistic competition, the AR and MR curves are more elastic as compared to those of Monopoly. It happens because of the presence of close substitutes under monopolistic competition and absence of close substitutes under monopoly. So, when price of a commodity is increased in both the markets, then proportionate fail in demand under monopoly is less than proportionate fall in demand under monopolistic competition.
  • 12. Relationship Between TR MR and AR The TR curve rises as long as MR is positive. It reaches its highest point (point A) when MR is zero (point B) and it starts declining when MR becomes negative. The relationship can be summed up as under: • As long as MR is positive, TR increases (or when TR rises, MR is positive). • When MR is zero, TR is at its maximum point (or when TR is maximum, MR is zero). • When MR becomes negative, TR starts falling (or when TR falls, MR is negative).
  • 13.
  • 14.
  • 15. Reach a point in a business venture when the profits are equal to the costs.
  • 16. To gain an understanding of calculating break-even we will use the example of a young entrepreneur wishing to start up a business delivering packages of fruit and veg. He knows that the last local shop in his area closed last year. Sensibly, he has carried out market research which indicates that there will be a good level of demand, but before he begins he needs to know how profitable the business might be. He has also fully researched the costs of starting up as a deliveryman and the costs of purchasing supplies.
  • 17. The costs he has researched are as follows: • cost of delivery van purchase £6000; • insurance and road tax £100 per month; • petrol £10.00 per day; • average cost of fruit and veg box £5.00; • Salaries - £1150 per month; • loan repayment £500 per month for twelve months.
  • 18. His market research indicates that the fruit and veg boxes will have an average sales price of £9.00. The question then is how many boxes will he need to sell to cover all his costs, i.e. to break even? He decides to calculate break-even on a monthly basis.
  • 19. Fixed costs Loan - £500 per month Petrol costs - £250 per month Insurance/road tax - £100 per month Salaries - £1150 per month Total fixed costs - £2000 per month Variable costs £5.00 per box Sales revenue £9.00 per box
  • 20. Calculating break-even point using the contribution method. Once we have calculated costs, the next step in calculating break-even output or sales is finding out how much contribution each item sold produces for the business.
  • 21. Every product made has a variable cost and a selling price (which must obviously be higher). The difference between the selling price per unit and the variable cost per unit is known as the CONTRIBUTION towards covering the business’s fixed costs.
  • 22. There is a simple formula for calculating break-even output. Break-even output = Fixed costs Contribution per unit. Contribution per unit = Selling price – Variable costs (per unit)
  • 23. Break-even output = Fixed costs Contribution per unit. Contribution per unit = Selling price – Variable costs (per unit) Break even in units = £2,000 £9 - £5 Break even in units = £2,000 / 4 Break even in units = 500 boxes
  • 24. We can now see that to break even our deliveryman must sell 500 fruit and veg boxes per month. • If he sells more than 500 boxes he will make a profit. • If he sells less than 500 boxes he will make a loss. At break-even point the total contribution equals the total fixed costs.
  • 25. Break-even analysis also allows us to calculate the profit or loss a business will make at different levels of output. This will always be important – after all our grocery seller may wish to go into business only if his profits are likely to be at a certain level. First of all calculate the break-even output, in the above case we know it is 500 boxes per month.
  • 26. As a result of his market research he believes that he can sell 650 boxes a month. He now wants to know what his profit will be at that level of sales. To find out how much profit will be made, we again use the idea of contribution.
  • 27. In this case predicted sales are 650. Break-even sales are 500. Profit per sales = Predicted sales – Break even sales x Contribution per unit Profit per sales = 650 – 500 x £4 Profit per sales = 150 x £4 Profit per sales = £600 His profits per month on sales of 650 boxes will be £600.