Download to read offline

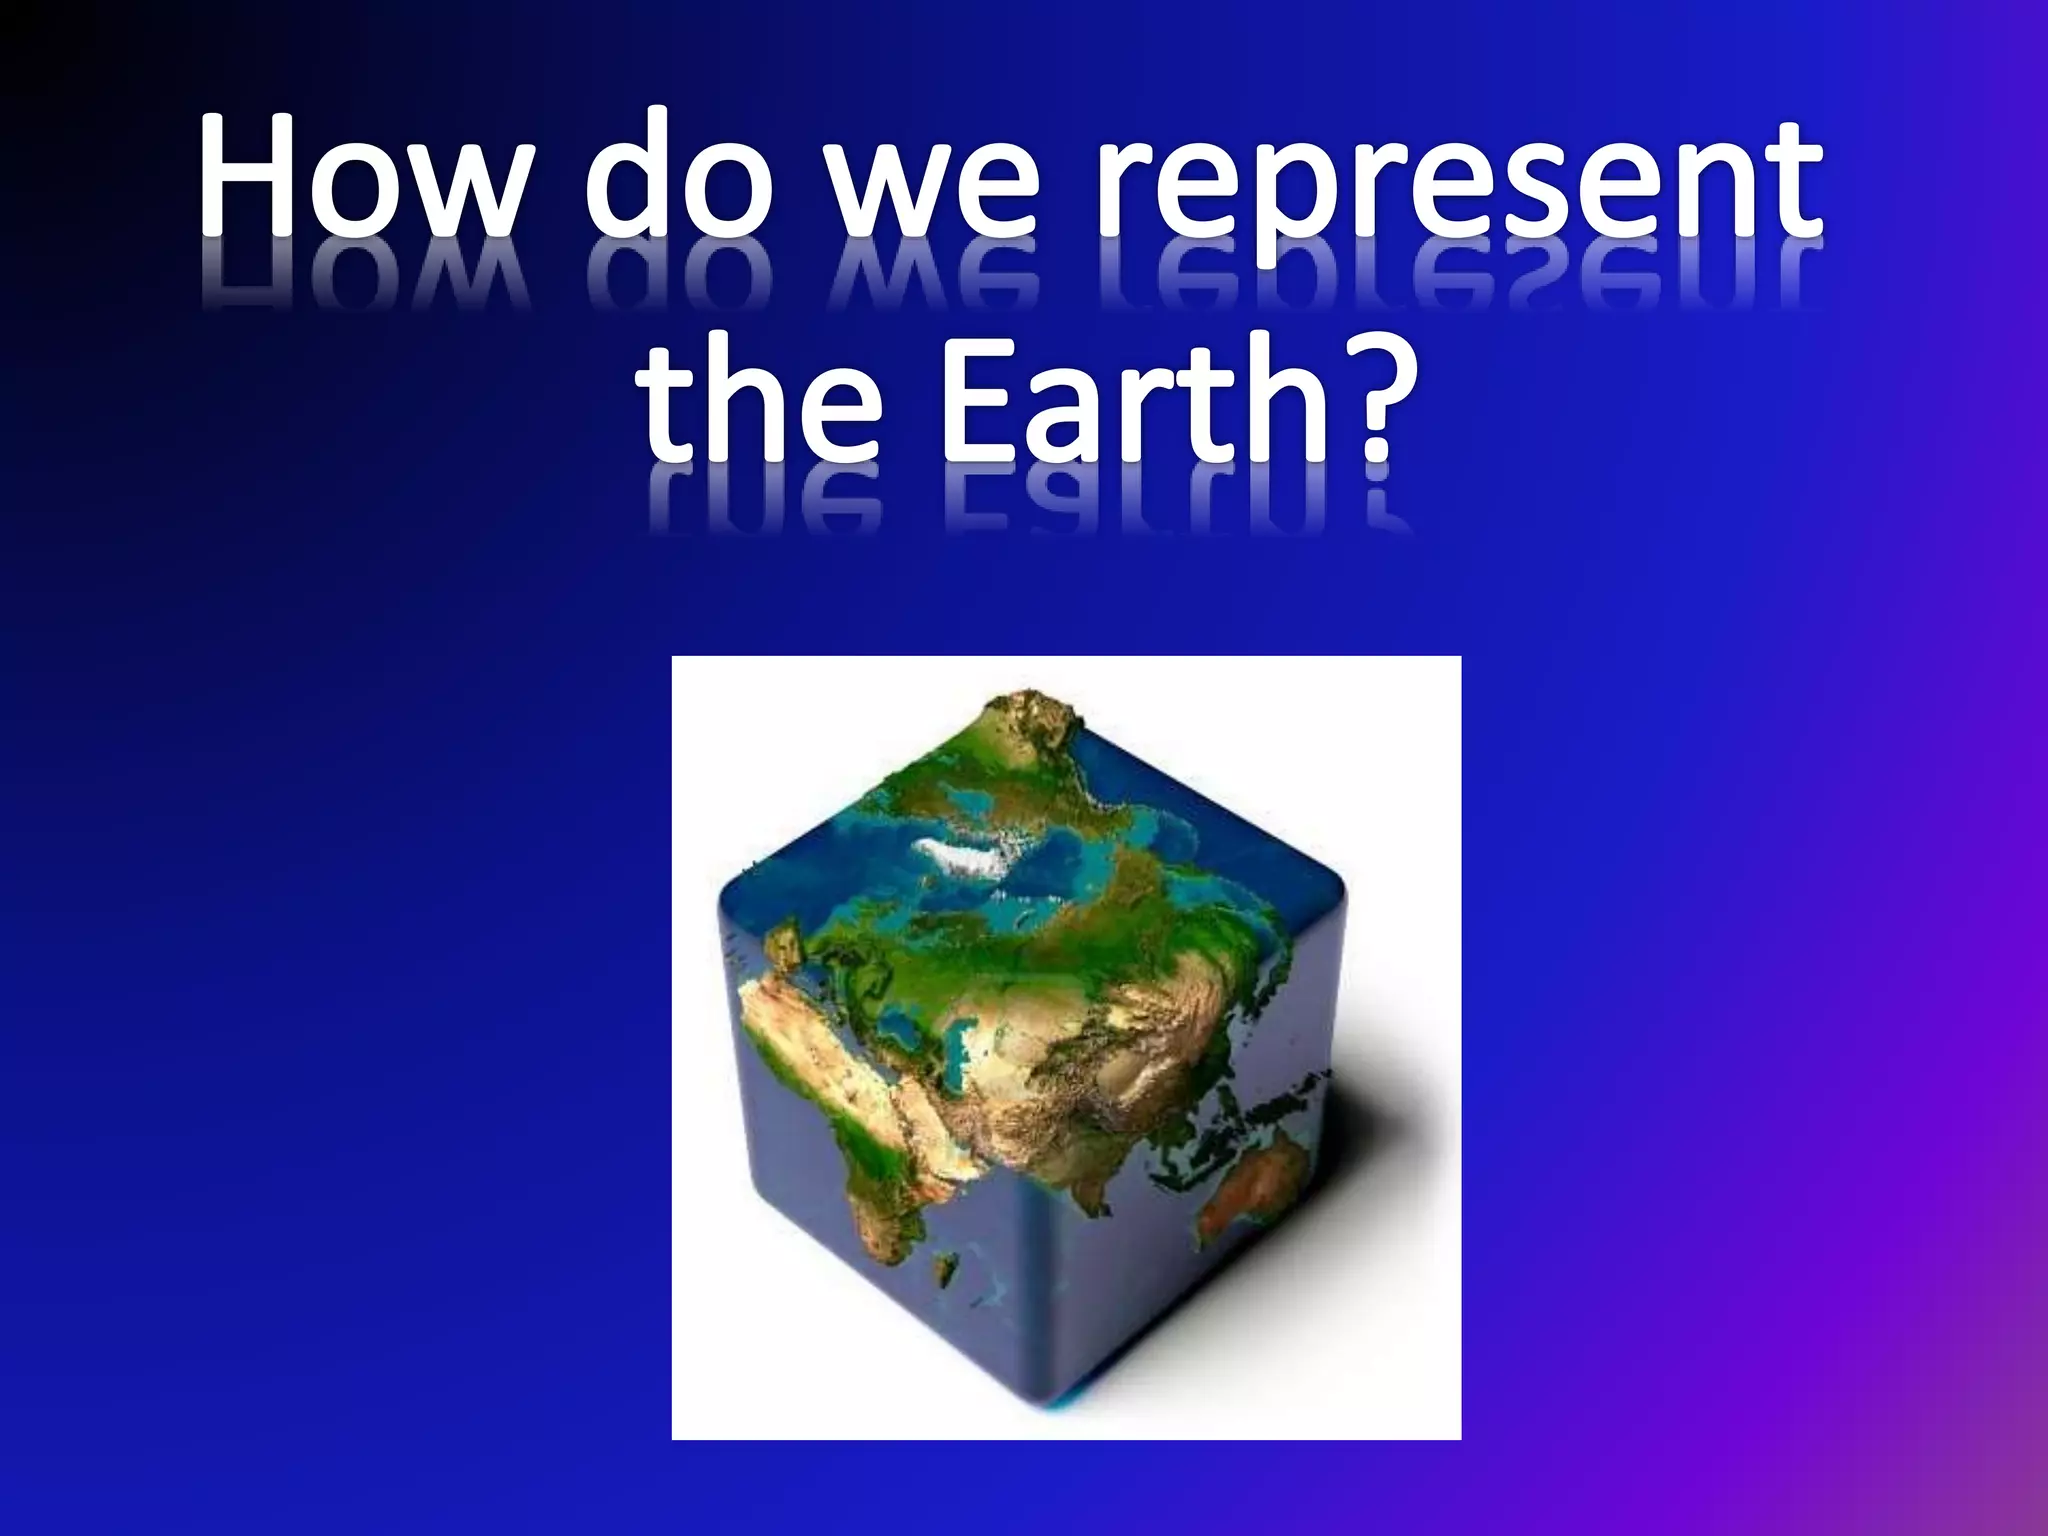
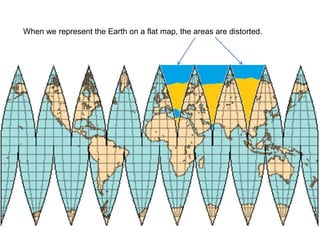
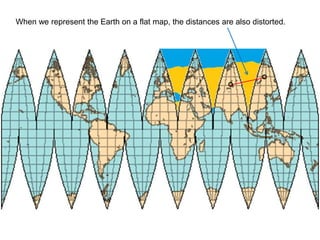
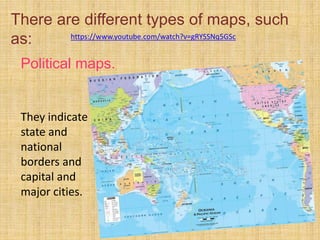
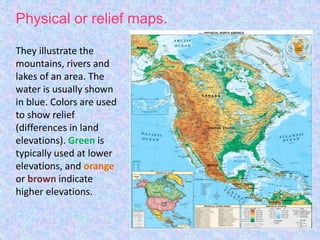
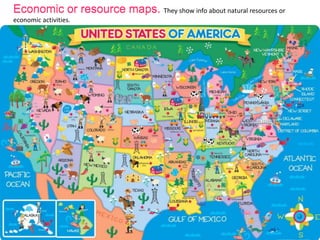
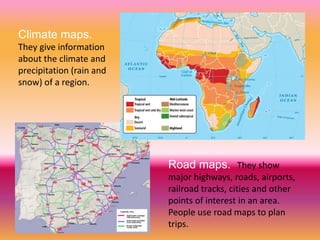
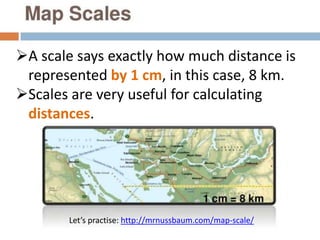
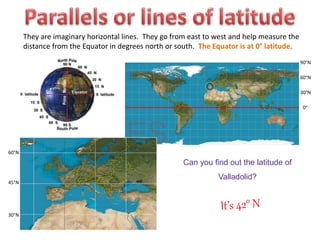


There are different types of maps that represent geographic information in various ways. Physical maps illustrate terrain features like mountains and rivers. Political maps show national borders and cities. Economic maps represent natural resources and industries. Climate maps provide climate and precipitation data. Road maps are used for planning trips as they show roads, cities, and other transportation details. When representing the spherical Earth on a flat map, areas and distances become distorted.


![Introduction to World History [PDF]](https://cdn.slidesharecdn.com/ss_thumbnails/introductiontoworldhistorypowerpointfull-150914164656-lva1-app6891-thumbnail.jpg?width=640&height=640&fit=bounds)