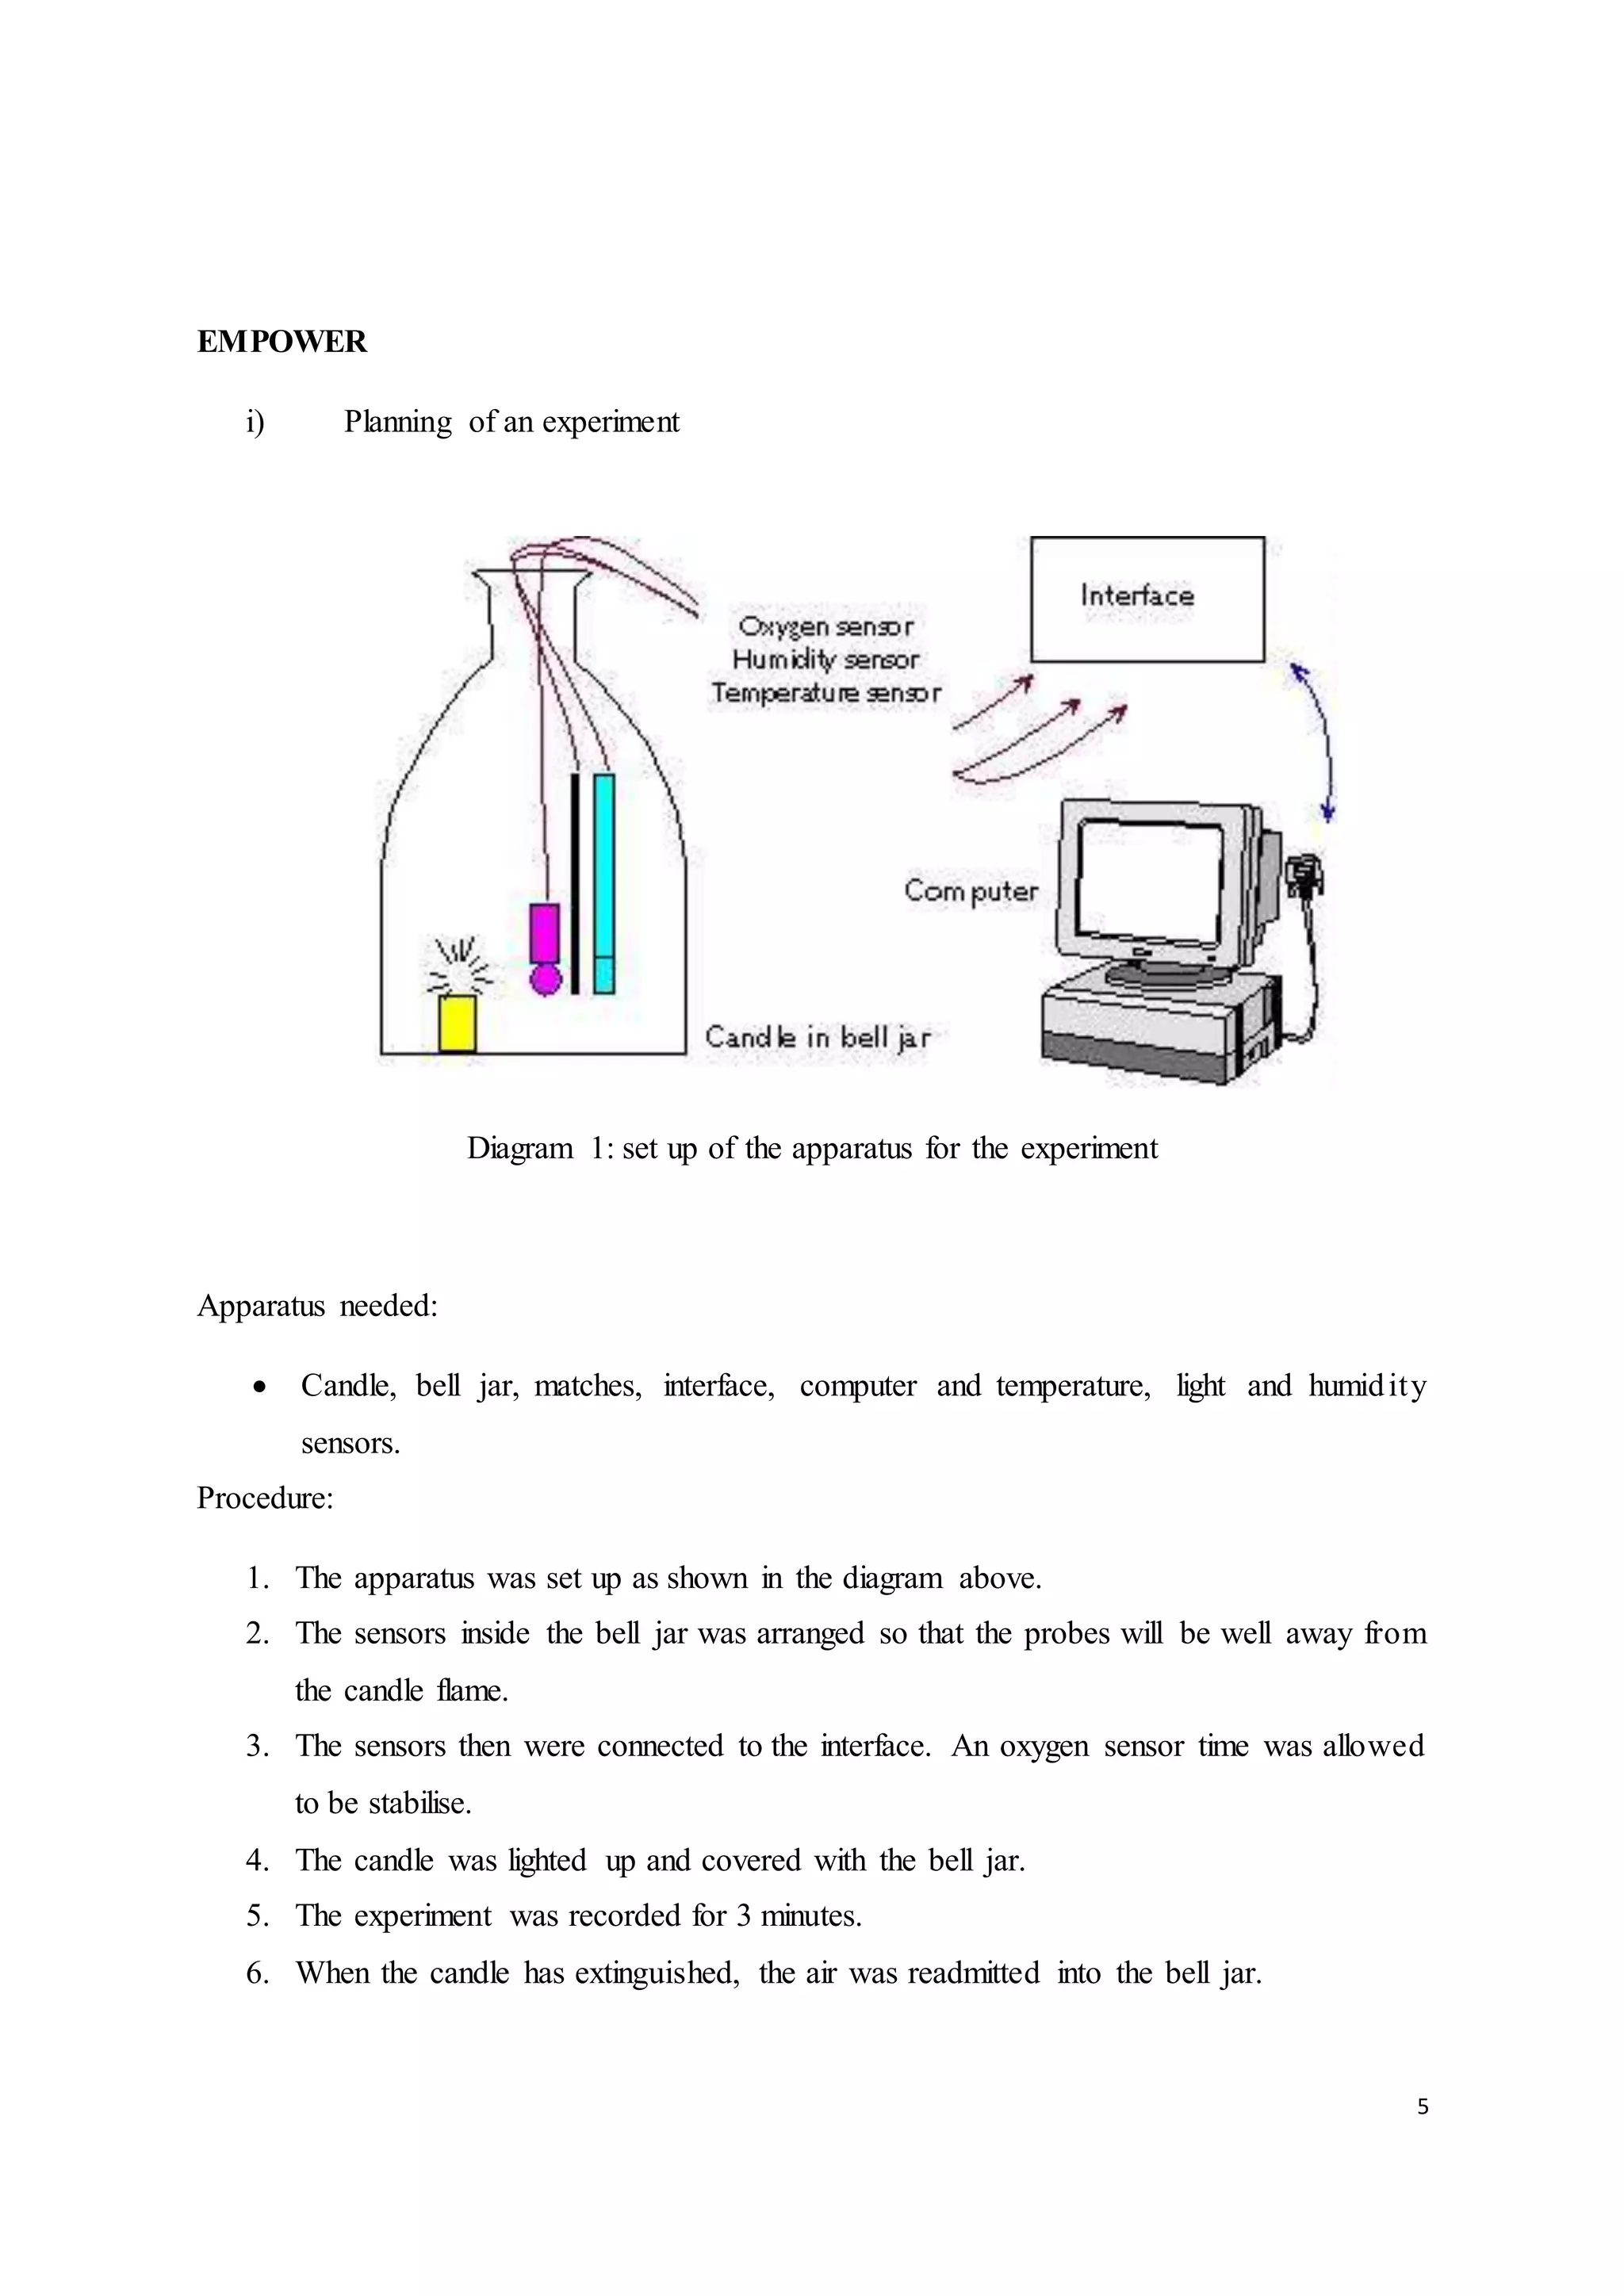
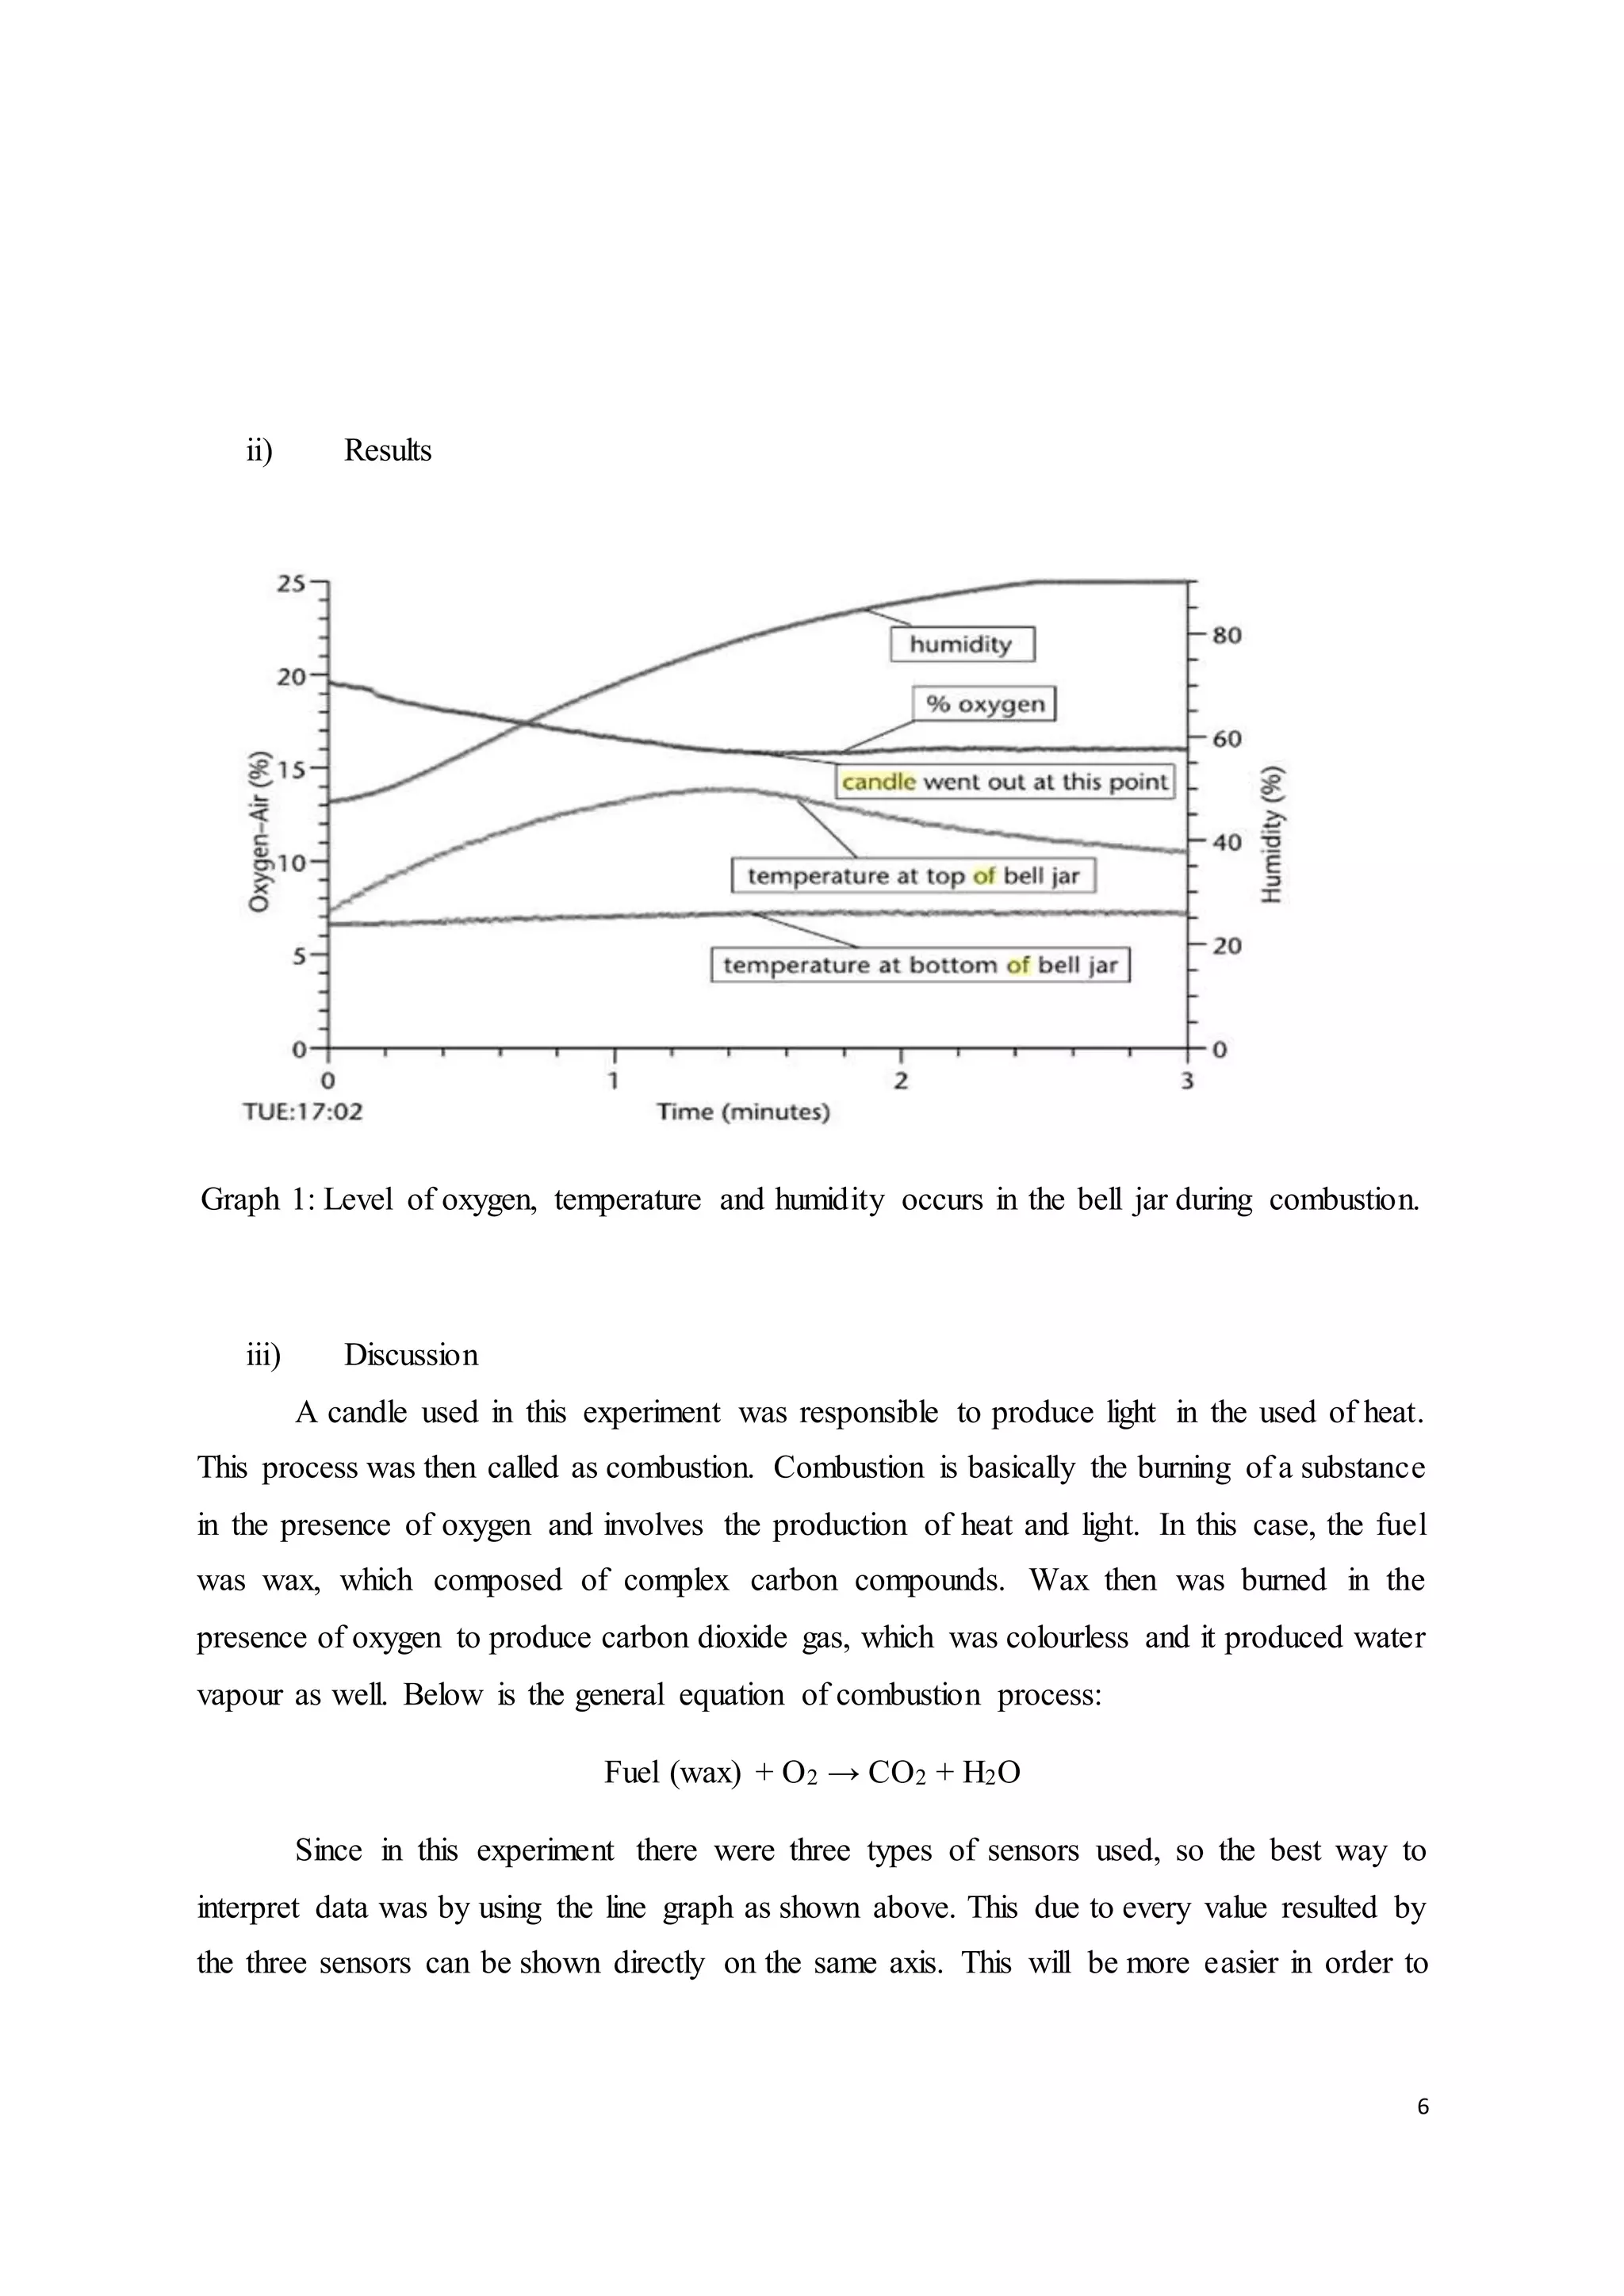
This document provides information about a practical report on data logging conducted by students. It discusses the introduction to data logging, how it was used in a scientific experiment to monitor combustion. The experiment measured oxygen, temperature, and humidity levels in a bell jar during combustion using different sensors connected to a computer. The results are presented in a graph showing decreases in oxygen and temperature and increases in humidity over time. The discussion explains how combustion occurred and how the sensors measured related changes in the variables during the reaction.