The document discusses replacement theory in operations research. It describes how replacement theory is used to determine the optimal time to replace equipment that deteriorates over time, such as vehicles. An example is provided where a transport company needs to determine the most economical time to replace a vehicle based on its decreasing resale value and increasing maintenance costs over eight years. The solution is that the vehicle should be replaced after four years, when the average total cost is lowest. The document also covers group replacement theory for items that fail suddenly without warning, like light bulbs, and provides an example to determine the optimal replacement policy for a set of light bulbs.
The efficiency of all industrial and military equipment's deteriorates with time. Sometimes the equipment fails completely and effects the whole system. The maintenance costs (running costs) of an equipment also go on increasing with time. Thus it becomes more economical to replace the old equipment with a new one. Hence there is a need to formulae a most economical replacement policy which is in the best interest of the system.
Extra time provided to worker for recovery from fatigue and for relaxation is called allowance
This may take into consideration personal factors as well as unavoidable constraints encountered in the work situation.
Allowances include all unavoidable delays, but rule out avoidable delays.
An allowance factor represents time lost due to personal factors, shift adjustments, improper equipment, fatigue, and related issues.
Plant & maintenance engineering is most important part of successful operation of a factory. But many companies ignore this function. Here is a brief presentation about aspects of plant & maintenance engineering, which is important part of operation and maintenance management.
LCA is useful in activity releated to discrete manufacturing.Wide range of activity such as
Loading,Feeding,Clamping,Machining,Welding,Forming,Gauging,Assembly and Packing can be subjected to LCA system adoption.
Useful in processing industries for manufacturing chemicals, oils, or pharmaceuticals.
This file is received from Mr Vishal Rajani .Very useful information on cost reduction methods. Specially AKBAR -BIRBAL story used to explain cost reduction in simple words. Thanks Vishal.
BUSI2301 Introduction to Operations Management FVannaSchrader3
BUSI2301
Introduction to Operations Management
Fall 2021
Individual Assignment
1. Consider the total production (and sales) of ice cream in Canada (in millions of liters)
for the period 1995 until 2007 (from left to right):
341, 331, 317, 315, 321, 278, 298, 311, 302, 302, 335, 320, 285
Fit a model to ice cream production data using each of the following techniques and
forecast the 2008 production in each case. Also, plot the two moving average
forecasts and the actual, the two exponential smoothing forecasts and the actual, and
the linear trend and the actual (three graphs altogether).
a. Two-year moving average.
b. Four-year moving average.
c. Exponential smoothing with smoothing constant = 0.2.
d. Exponential smoothing with smoothing constant = 0.4.
e. Linear trend (regression).
f. Just by observing the plots, which of the above techniques would you use to
forecast the ice cream production and why? (Hint: The plot overall closest to
actual demand will be most accurate).
g. Alternatively, compute the MAD for each forecasting technique and determine
the most accurate technique.
Individual Assignment: BUSI2301
2 | P a g e
2. The number of Toyota Corollas produced in the Cambridge, Ontario, plant during each
month of January 2008 to December 2009 period was as follows:
Assume that the cars are sold in the same month they are produced. Identify an
appropriate forecasting technique, briefly state the reason(s) you chose it, and
forecast Corolla demand in January 2010.
3. Fleet managers have a large pool of cars and trucks to maintain.13 One approach to
the vehicle maintenance is to use periodic oil analysis: the oil from the engine and
transmission are subjected periodically to a test. These tests can sometimes signal
an impending failure (for example, iron particles in the oil), and preventive
maintenance is then performed (at a relatively low cost), eliminating the risk of failure
(failure would result in a relatively high cost). However, oil analysis costs money and
it is not perfect—it can indicate that a unit is defective when in fact it is not, and it can
indicate that a unit is nondefective when in fact it is. As a possible substitute for oil
analysis, the company could simply change the oil periodically, thereby reducing the
probability of failure. The fleet manager for the Southern Company, an electrical utility
based in Atlanta (parent of Georgia Power and Light), has four alternatives: (1) do
nothing, (2) use oil analysis only, (3) replace oil only, or (4) replace oil and do oil
analysis. For option (1) the probability of failure is 0.1, and the cost of failure is $1,200.
For option (2), the probability of failure remains at 0.1. If the unit is about to fail, the oil
analysis will indicate this with probability 0.7; if the unit is not about to fail, the oil
Individual Assignment: BUSI2301
3 | P a g e
analysis will indicate thi ...
Classmate ALearning OutcomesIn Chapters 5 and 6, we haveVinaOconner450
Classmate A
Learning Outcomes
In Chapters 5 and 6, we have learned about the cost behavior patterns and process costing in an organization. It considered that the cost behavior patterns and process costing in accounting decisions. Cost behavior patterns define how the organization and operating expenditures change or remain the same through dissimilar events. Practices can be changed, particularly while changing the production levels or sales volume within a business. It may rise in fixed, variable, and mixed expenditures. For example, let's assume that the cost of direct material of a bike company for each bike is $40. If the motorcycle unrestricted made one bike, the total variable price for natural materials is around $40. If the bike company made two bikes, the total variable cost becomes double that is $80. It shows that the variable cost mainly changes in percentage to change in the volume of activity. If the production becomes double, then total variable cost also double, and the cost per unit remains similar. The term variable costs must define the full price with the variations in activities, not the price per unit.
In chapter 8, we also learned about how united airlines fight to regulate costs. United Airlines is considered the second primary air carrier in the world. The industry study that the airlines had high fixed prices, making it hard for the business to cut prices rapidly in line with its deduction in income. It also shows that there is difficulty in finding the fixed costs. The fixed expenses are a significant element of total operating expenditures, making it hard for airlines to create short-term cuts in spending when income reduces. It seems that the variable, fixed, and mixed expenses are essential for quick decision-making and are used for a particular period. The appropriate variety is the range of actions for which cost behavior patterns are like to be correct.
In chapter 9 it has been discussed the process costing in production costs. Process costing is an introductory section in production costs because process costing defines the price of each product made as similar to the price of every other product. It seems that a desk company produces desks, and it maintains a benefit over it that their participants made desks in large quantities, that is 4000 to 8000 desks per month, with the help of globally accepted designs. It permits the business to purchase material in bulk, which results in a discount on costs from suppliers. The same desk is made for all the consumers; as a result, desk products can limit the production procedure to two processing sections: assembly and finished. New participants recently started producing the same desk, and the desk company worried whether the desk production price is reasonable. The above example shows that it is hard to make the production process successful without proper technique costing.
The managers can use cost behavior patterns while making decisions because it helps ...
Students, digital devices and success - Andreas Schleicher - 27 May 2024..pptxEduSkills OECD
Andreas Schleicher presents at the OECD webinar ‘Digital devices in schools: detrimental distraction or secret to success?’ on 27 May 2024. The presentation was based on findings from PISA 2022 results and the webinar helped launch the PISA in Focus ‘Managing screen time: How to protect and equip students against distraction’ https://www.oecd-ilibrary.org/education/managing-screen-time_7c225af4-en and the OECD Education Policy Perspective ‘Students, digital devices and success’ can be found here - https://oe.cd/il/5yV
How to Make a Field invisible in Odoo 17Celine George
It is possible to hide or invisible some fields in odoo. Commonly using “invisible” attribute in the field definition to invisible the fields. This slide will show how to make a field invisible in odoo 17.
Unit 8 - Information and Communication Technology (Paper I).pdfThiyagu K
This slides describes the basic concepts of ICT, basics of Email, Emerging Technology and Digital Initiatives in Education. This presentations aligns with the UGC Paper I syllabus.
Welcome to TechSoup New Member Orientation and Q&A (May 2024).pdfTechSoup
In this webinar you will learn how your organization can access TechSoup's wide variety of product discount and donation programs. From hardware to software, we'll give you a tour of the tools available to help your nonprofit with productivity, collaboration, financial management, donor tracking, security, and more.
Synthetic Fiber Construction in lab .pptxPavel ( NSTU)
Synthetic fiber production is a fascinating and complex field that blends chemistry, engineering, and environmental science. By understanding these aspects, students can gain a comprehensive view of synthetic fiber production, its impact on society and the environment, and the potential for future innovations. Synthetic fibers play a crucial role in modern society, impacting various aspects of daily life, industry, and the environment. ynthetic fibers are integral to modern life, offering a range of benefits from cost-effectiveness and versatility to innovative applications and performance characteristics. While they pose environmental challenges, ongoing research and development aim to create more sustainable and eco-friendly alternatives. Understanding the importance of synthetic fibers helps in appreciating their role in the economy, industry, and daily life, while also emphasizing the need for sustainable practices and innovation.
Instructions for Submissions thorugh G- Classroom.pptxJheel Barad
This presentation provides a briefing on how to upload submissions and documents in Google Classroom. It was prepared as part of an orientation for new Sainik School in-service teacher trainees. As a training officer, my goal is to ensure that you are comfortable and proficient with this essential tool for managing assignments and fostering student engagement.
The Indian economy is classified into different sectors to simplify the analysis and understanding of economic activities. For Class 10, it's essential to grasp the sectors of the Indian economy, understand their characteristics, and recognize their importance. This guide will provide detailed notes on the Sectors of the Indian Economy Class 10, using specific long-tail keywords to enhance comprehension.
For more information, visit-www.vavaclasses.com
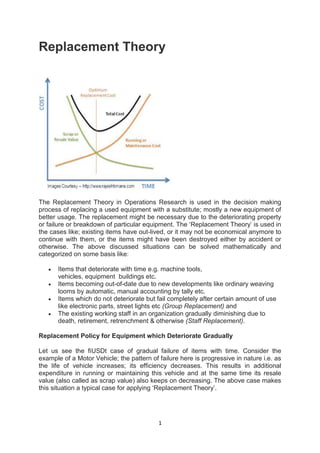
1. 1
Replacement Theory
The Replacement Theory in Operations Research is used in the decision making
process of replacing a used equipment with a substitute; mostly a new equipment of
better usage. The replacement might be necessary due to the deteriorating property
or failure or breakdown of particular equipment. The „Replacement Theory‟ is used in
the cases like; existing items have out-lived, or it may not be economical anymore to
continue with them, or the items might have been destroyed either by accident or
otherwise. The above discussed situations can be solved mathematically and
categorized on some basis like:
Items that deteriorate with time e.g. machine tools,
vehicles, equipment buildings etc.
Items becoming out-of-date due to new developments like ordinary weaving
looms by automatic, manual accounting by tally etc.
Items which do not deteriorate but fail completely after certain amount of use
like electronic parts, street lights etc (Group Replacement) and
The existing working staff in an organization gradually diminishing due to
death, retirement, retrenchment & otherwise (Staff Replacement).
Replacement Policy for Equipment which Deteriorate Gradually
Let us see the fiUSDt case of gradual failure of items with time. Consider the
example of a Motor Vehicle; the pattern of failure here is progressive in nature i.e. as
the life of vehicle increases; its efficiency decreases. This results in additional
expenditure in running or maintaining this vehicle and at the same time its resale
value (also called as scrap value) also keeps on decreasing. The above case makes
this situation a typical case for applying „Replacement Theory‟.
2. 2
Example:
A transport company purchased a motor vehicle for rupees 80000/-. The resale
value of the vehicle keeps on decreasing from USD 70000/- in the fiUSDt year to
USD 5000/- in the eighth year while, the running cost in maintaining the vehicle
keeps on increasing with USD. 3000/- in the fiUSDt year till it goes to USD. 20000/-
in the eighth year as shown in the below table. Determine the optimum replacement
policy?
The MS-Excel Files of this Algorithm can be downloaded from the links provided
further in this post. The cost of the equipment is to be entered in the cell B1 (as
shown by the green cell with 80000). Now, enter the scrap values and the running
costs as entered in the green columns C5 to C12 and D5 to D12. The algorithm will
now automatically calculate the solution which is as shown in the below figure.
The answer can be fetched from the last column. See the pattern; the average total
cost (ATC) at first starts dipping from USD. 13000/- till it reaches USD. 11850/- in the
cell H8. From H9 it again starts increasing. This cost at which the ATC is lowest in a
particular year (after which it starts increasing again) gives the optimum replacement
period and cost of the vehicle.
Solution: The vehicle needs to be replaced after four years of its purchase wherein
the cost of maintaining that vehicle would be lowest at an average of USD 11850/-
per year.
3. 3
Clarification on the Methodology
There are two considerations here. First, the running cost (Rn) is increasing every
year at the same time the vehicle is depreciating in its value. This depreciation is
„(C-S)‟ i.e. in the first year the scrap value of the vehicle is USD. 70000/- which was
purchased for USD. 80000/- . So, the vehicle is depreciated by USD. 10000/- in year
one and so on (see column F).
Thus the total cost in keeping this vehicle is this depreciation and its maintenance.
The maintenance is made cumulative by adding previous years running cost to it
every successive year. Let‟s make this simple!
The depreciation is USD. 10000/- in the first, 19000/- in the second, 25000/- in the
third and so on. See here, the vehicle is depreciated by USD. 25000/- “by” the third
year and not “in” the third year. Note that the non-cumulative cost of depreciation “in”
the third year would be USD. 6000/- [USD. 25000/ minus USD. 19000/, see the cells
F6 and F7]
As, the depreciation in itself is a cumulative function here, we make the running cost
cumulative also. That means the cost of maintaining the vehicle “by” the particular
years. So, the cost of maintaining the vehicle “by” the third year is USD. 11400/-
(D5+D6+ D7 or 3000+3600+4800).
Hence the total cost incurred by the third year would be USD. 25000 + USD. 11400
= USD. 36400 (see cell G7). Finally, the “average cost” of keeping this vehicle for
three years would be 36400 divided by 3 years i.e. USD. 12133.33 as can be seen
from cell H7 and so on.
Notations Used:
C – (Capital) Cost of Equipment
S – Scrap (or Resale) Value
Rn – Running (or Maintenance) Cost
E Rn – Cumulative Running Cost
(C-S) – Depreciation
TC – Total Cost
ATC – Average Total Cost
4. 4
Group Replacement Theory
Replacement of items that fail suddenly
There are certain items which do not deteriorate but fail completely after certain
amount of use. These kinds of failures are analyzed by the method called as group
replacement theory. Here, large numbers of items are failing at their average life
expectancy. This kind of items may not have maintenance costs as such but they fail
suddenly without any prior warning. Also, in case of sudden breakdowns immediate
replacement may not be available. Few examples are fluorescent tubes, light bulbs,
electronic chips, fuse etc.
Let‟s consider the example of street lights. We often see street-lights being repaired
by the corporation staff using extendable ladders. If a particular light is beyond
repairs, then it is replaced. This kind of policy of replacement is called as
„replacement of items as-and-when they fail‟ or ‘Individual Replacement’. On the
other hand, if all the street lights in a particular cluster are replaced as and when
they fail and also simultaneously in groups, then the policy is called as ‘Group
Replacement’. It should be noted that, group replacement does involve periodic
simultaneous replacements along with individual replacements in between.
It is found that replacing these random failing items simultaneously at specific
intervals is economical as compared to replacing them only when an item fails. A
long period between group replacements results in increase in cost of individual
replacements, while frequent group replacements are definitely costly. There lies the
need to balance this and find an optimum replacement time for optimum cost of
replacement.
Problem:
A factory has 1000 bulbs installed. Cost of individual replacement is USD. 3/- while
that of group replacement USD 1/-per bulb respectively. It is decided to replace all
the bulbs simultaneously at fixed interval & also to replace the individual bulbs that
fail in between. Determine optimal replacement policy. Failure probabilities are as
given below:
5. 5
Solution:
The probabilities given in the problem are cumulative i.e. till week 1, till week 2 etc.
Individual probabilities would be 0.10 in 1st
week, 0.15 (0.25-0.10) in 2nd
week, and
so on. (as shown in the below table)
Policy-I: Individual Replacement
Step 1) Cost of Individual Replacements
Individual Failures/week = Total Quantity / Mean Life = 1000 / 3.45 = 289.9
Individual Replacement Cost = (Individual Failures per week) x (Individual
replacement cost)
= 289.9 x 3 = USD. 869.6
Policy-II: Group Replacement
Step 2) Individual failures per week
In the first week: 10 % (0.10) of the bulbs will fail out of 1000 bulbs i.e. 100
In the second week: 15 % of the bulbs will fail out of 1000 bulbs i.e. 150. Also, 10%
of 100 replaced in the first week i.e. 10. TOTAL bulbs failed until second week = 160
(150+10)
Rest of the calculation is as shown in the below table:
6. 6
Step 3) Calculating the total cost & time of replacement:
Thus, replacing all the bulbs simultaneously at fixed interval & also to replace the
individual bulbs that fail in between will be economical or optimal after 4 weeks
(optimal interval between group replacements).
Interpretation:
1. The cost of only individual replacements id USD. 869.6 (As seen in the Policy-
I)
2. The cost of combine policy i.e. group and individual replacement id USD.
863.6 (see last column of table 3)
3. Hence the Policy-II is the optimum replacement policy
Hence, the bulbs shall be replaced every four weeks individually as well as in groups
which combine would cost USD. 863.6 per week (lesser than individual cost of USD.
869.6 per week)
7. 7
Click the following link to Download the Excel Solver
Group Replacement Algorithm
Practice Problem:
___________________________________________________________________
________
The following mortality rates have been observed for a special type of light bulbs.
There are 1000 such bulbs in the concerned unit of the industry.
It costs USD 10 to replace an individual bulb that has burnt out. If the bulbs were
replaced simultaneously, it would cost USD. 2.50 per bulb. It is proposed to replace
all the bulbs at fixed interval, whether are not they have burnt out, and to continue
replacing the burnt out bulbs as they fail. At what intervals of time should the
manager replace all the bulbs? Decide the optimum replacement policy.
Solution:
Step 1) Download the Excel Solver
Step 2) Over-write the new problem values in the orange cells.
Step 3) Compare:
Individual Cost = USD. 2985 (Cell D20)
Individual & Group Cost = USD. 2550 (Cell Q10)
Hence, the bulbs need to be replaced completely after every two months along with
individual replacements as and when they fail.
PowerPoint Presentation