Download to read offline
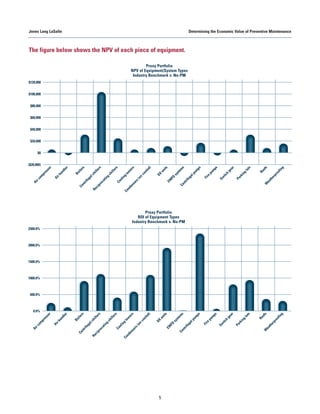

This document summarizes a study conducted to determine the economic value of preventive maintenance programs. The study analyzed preventive maintenance costs, repair costs, equipment replacement costs, equipment lifespan, and energy usage under different maintenance scenarios. The results showed that following industry benchmark preventive maintenance provided substantial returns, with an estimated portfolio-wide net present value of $2 billion and return on investment of 545% over 25 years from spending $39 million annually on preventive maintenance. The analysis demonstrated that preventive maintenance pays for itself and produces significant financial benefits by extending equipment lifespan and reducing long-term costs.


