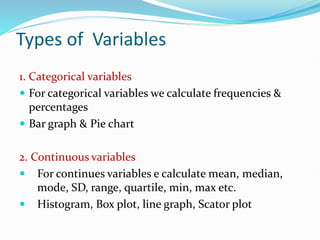
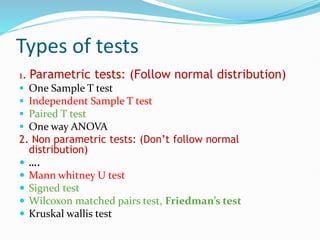
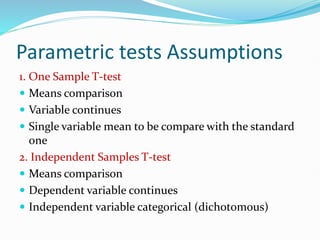
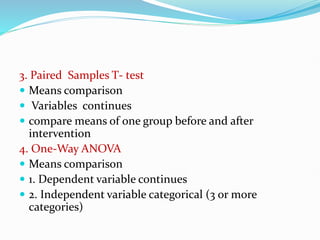
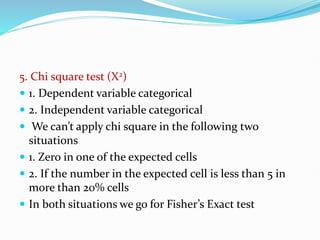
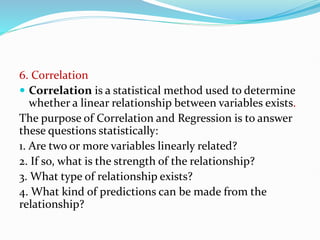
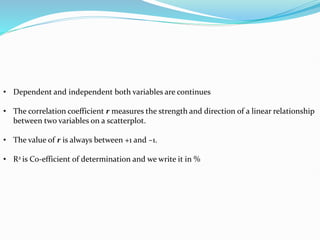
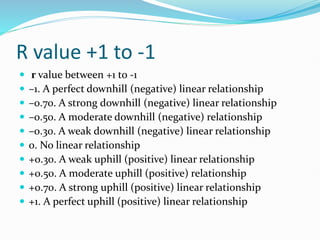
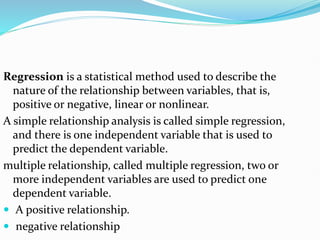
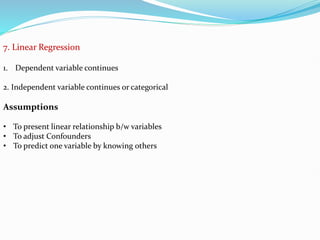
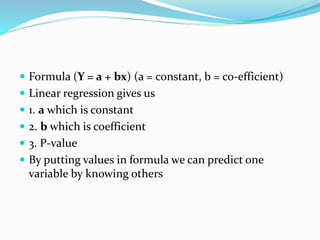
Prep by: Mr. Bashir Ullah
BS Cardiac Perfusion Technology
MS Epi & biostatic (continue)
KMU-IPHSS
Modified from Dr :Nauman Arif lecture
Types of Variables
1. Categorical variables
 For categorical variables we calculate frequencies &
percentages
 Bar graph & Pie chart
2. Continuous variables
 For continues variables e calculate mean, median,
mode, SD, range, quartile, min, max etc.
 Histogram, Box plot, line graph, Scator plot
Types of tests
1. Parametric tests: (Follow normal distribution)
 One Sample T test
 Independent Sample T test
 Paired T test
 One way ANOVA
2. Non parametric tests: (Don’t follow normal
distribution)
 ….
 Mann whitney U test
 Signed test
 Wilcoxon matched pairs test, Friedman’s test
 Kruskal wallis test
Parametric tests Assumptions
1. One Sample T-test
 Means comparison
 Variable continues
 Single variable mean to be compare with the standard
one
2. Independent Samples T-test
 Means comparison
 Dependent variable continues
 Independent variable categorical (dichotomous)
3. Paired Samples T- test
 Means comparison
 Variables continues
 compare means of one group before and after
intervention
4. One-Way ANOVA
 Means comparison
 1. Dependent variable continues
 2. Independent variable categorical (3 or more
categories)
5. Chi square test (X2)
 1. Dependent variable categorical
 2. Independent variable categorical
 We can’t apply chi square in the following two
situations
 1. Zero in one of the expected cells
 2. If the number in the expected cell is less than 5 in
more than 20% cells
 In both situations we go for Fisher’s Exact test
6. Correlation
 Correlation is a statistical method used to determine
whether a linear relationship between variables exists.
The purpose of Correlation and Regression is to answer
these questions statistically:
1. Are two or more variables linearly related?
2. If so, what is the strength of the relationship?
3. What type of relationship exists?
4. What kind of predictions can be made from the
relationship?
• Dependent and independent both variables are continues
• The correlation coefficient r measures the strength and direction of a linear relationship
between two variables on a scatterplot.
• The value of r is always between +1 and –1.
• R2 is Co-efficient of determination and we write it in %
R value +1 to -1
 r value between +1 to -1
 –1. A perfect downhill (negative) linear relationship
 –0.70. A strong downhill (negative) linear relationship
 –0.50. A moderate downhill (negative) relationship
 –0.30. A weak downhill (negative) linear relationship
 0. No linear relationship
 +0.30. A weak uphill (positive) linear relationship
 +0.50. A moderate uphill (positive) relationship
 +0.70. A strong uphill (positive) linear relationship
 +1. A perfect uphill (positive) linear relationship
Regression is a statistical method used to describe the
nature of the relationship between variables, that is,
positive or negative, linear or nonlinear.
A simple relationship analysis is called simple regression,
and there is one independent variable that is used to
predict the dependent variable.
multiple relationship, called multiple regression, two or
more independent variables are used to predict one
dependent variable.
 A positive relationship.
 negative relationship
7. Linear Regression
1. Dependent variable continues
2. Independent variable continues or categorical
Assumptions
• To present linear relationship b/w variables
• To adjust Confounders
• To predict one variable by knowing others
 Formula (Y = a + bx) (a = constant, b = co-efficient)
 Linear regression gives us
 1. a which is constant
 2. b which is coefficient
 3. P-value
 By putting values in formula we can predict one
variable by knowing others
8. Logistic regression
 1. Dependent variables categorical (dichotomous)
 2. Independent variable continues or categorical

Statistical testing.pptxstatisctics bachelors

  • 1.
    Prep by: Mr.Bashir Ullah BS Cardiac Perfusion Technology MS Epi & biostatic (continue) KMU-IPHSS Modified from Dr :Nauman Arif lecture
  • 2.
    Types of Variables 1.Categorical variables  For categorical variables we calculate frequencies & percentages  Bar graph & Pie chart 2. Continuous variables  For continues variables e calculate mean, median, mode, SD, range, quartile, min, max etc.  Histogram, Box plot, line graph, Scator plot
  • 3.
    Types of tests 1.Parametric tests: (Follow normal distribution)  One Sample T test  Independent Sample T test  Paired T test  One way ANOVA 2. Non parametric tests: (Don’t follow normal distribution)  ….  Mann whitney U test  Signed test  Wilcoxon matched pairs test, Friedman’s test  Kruskal wallis test
  • 4.
    Parametric tests Assumptions 1.One Sample T-test  Means comparison  Variable continues  Single variable mean to be compare with the standard one 2. Independent Samples T-test  Means comparison  Dependent variable continues  Independent variable categorical (dichotomous)
  • 5.
    3. Paired SamplesT- test  Means comparison  Variables continues  compare means of one group before and after intervention 4. One-Way ANOVA  Means comparison  1. Dependent variable continues  2. Independent variable categorical (3 or more categories)
  • 6.
    5. Chi squaretest (X2)  1. Dependent variable categorical  2. Independent variable categorical  We can’t apply chi square in the following two situations  1. Zero in one of the expected cells  2. If the number in the expected cell is less than 5 in more than 20% cells  In both situations we go for Fisher’s Exact test
  • 7.
    6. Correlation  Correlationis a statistical method used to determine whether a linear relationship between variables exists. The purpose of Correlation and Regression is to answer these questions statistically: 1. Are two or more variables linearly related? 2. If so, what is the strength of the relationship? 3. What type of relationship exists? 4. What kind of predictions can be made from the relationship?
  • 8.
    • Dependent andindependent both variables are continues • The correlation coefficient r measures the strength and direction of a linear relationship between two variables on a scatterplot. • The value of r is always between +1 and –1. • R2 is Co-efficient of determination and we write it in %
  • 9.
    R value +1to -1  r value between +1 to -1  –1. A perfect downhill (negative) linear relationship  –0.70. A strong downhill (negative) linear relationship  –0.50. A moderate downhill (negative) relationship  –0.30. A weak downhill (negative) linear relationship  0. No linear relationship  +0.30. A weak uphill (positive) linear relationship  +0.50. A moderate uphill (positive) relationship  +0.70. A strong uphill (positive) linear relationship  +1. A perfect uphill (positive) linear relationship
  • 10.
    Regression is astatistical method used to describe the nature of the relationship between variables, that is, positive or negative, linear or nonlinear. A simple relationship analysis is called simple regression, and there is one independent variable that is used to predict the dependent variable. multiple relationship, called multiple regression, two or more independent variables are used to predict one dependent variable.  A positive relationship.  negative relationship
  • 11.
    7. Linear Regression 1.Dependent variable continues 2. Independent variable continues or categorical Assumptions • To present linear relationship b/w variables • To adjust Confounders • To predict one variable by knowing others
  • 12.
     Formula (Y= a + bx) (a = constant, b = co-efficient)  Linear regression gives us  1. a which is constant  2. b which is coefficient  3. P-value  By putting values in formula we can predict one variable by knowing others
  • 13.
    8. Logistic regression 1. Dependent variables categorical (dichotomous)  2. Independent variable continues or categorical