Download as PDF, PPTX
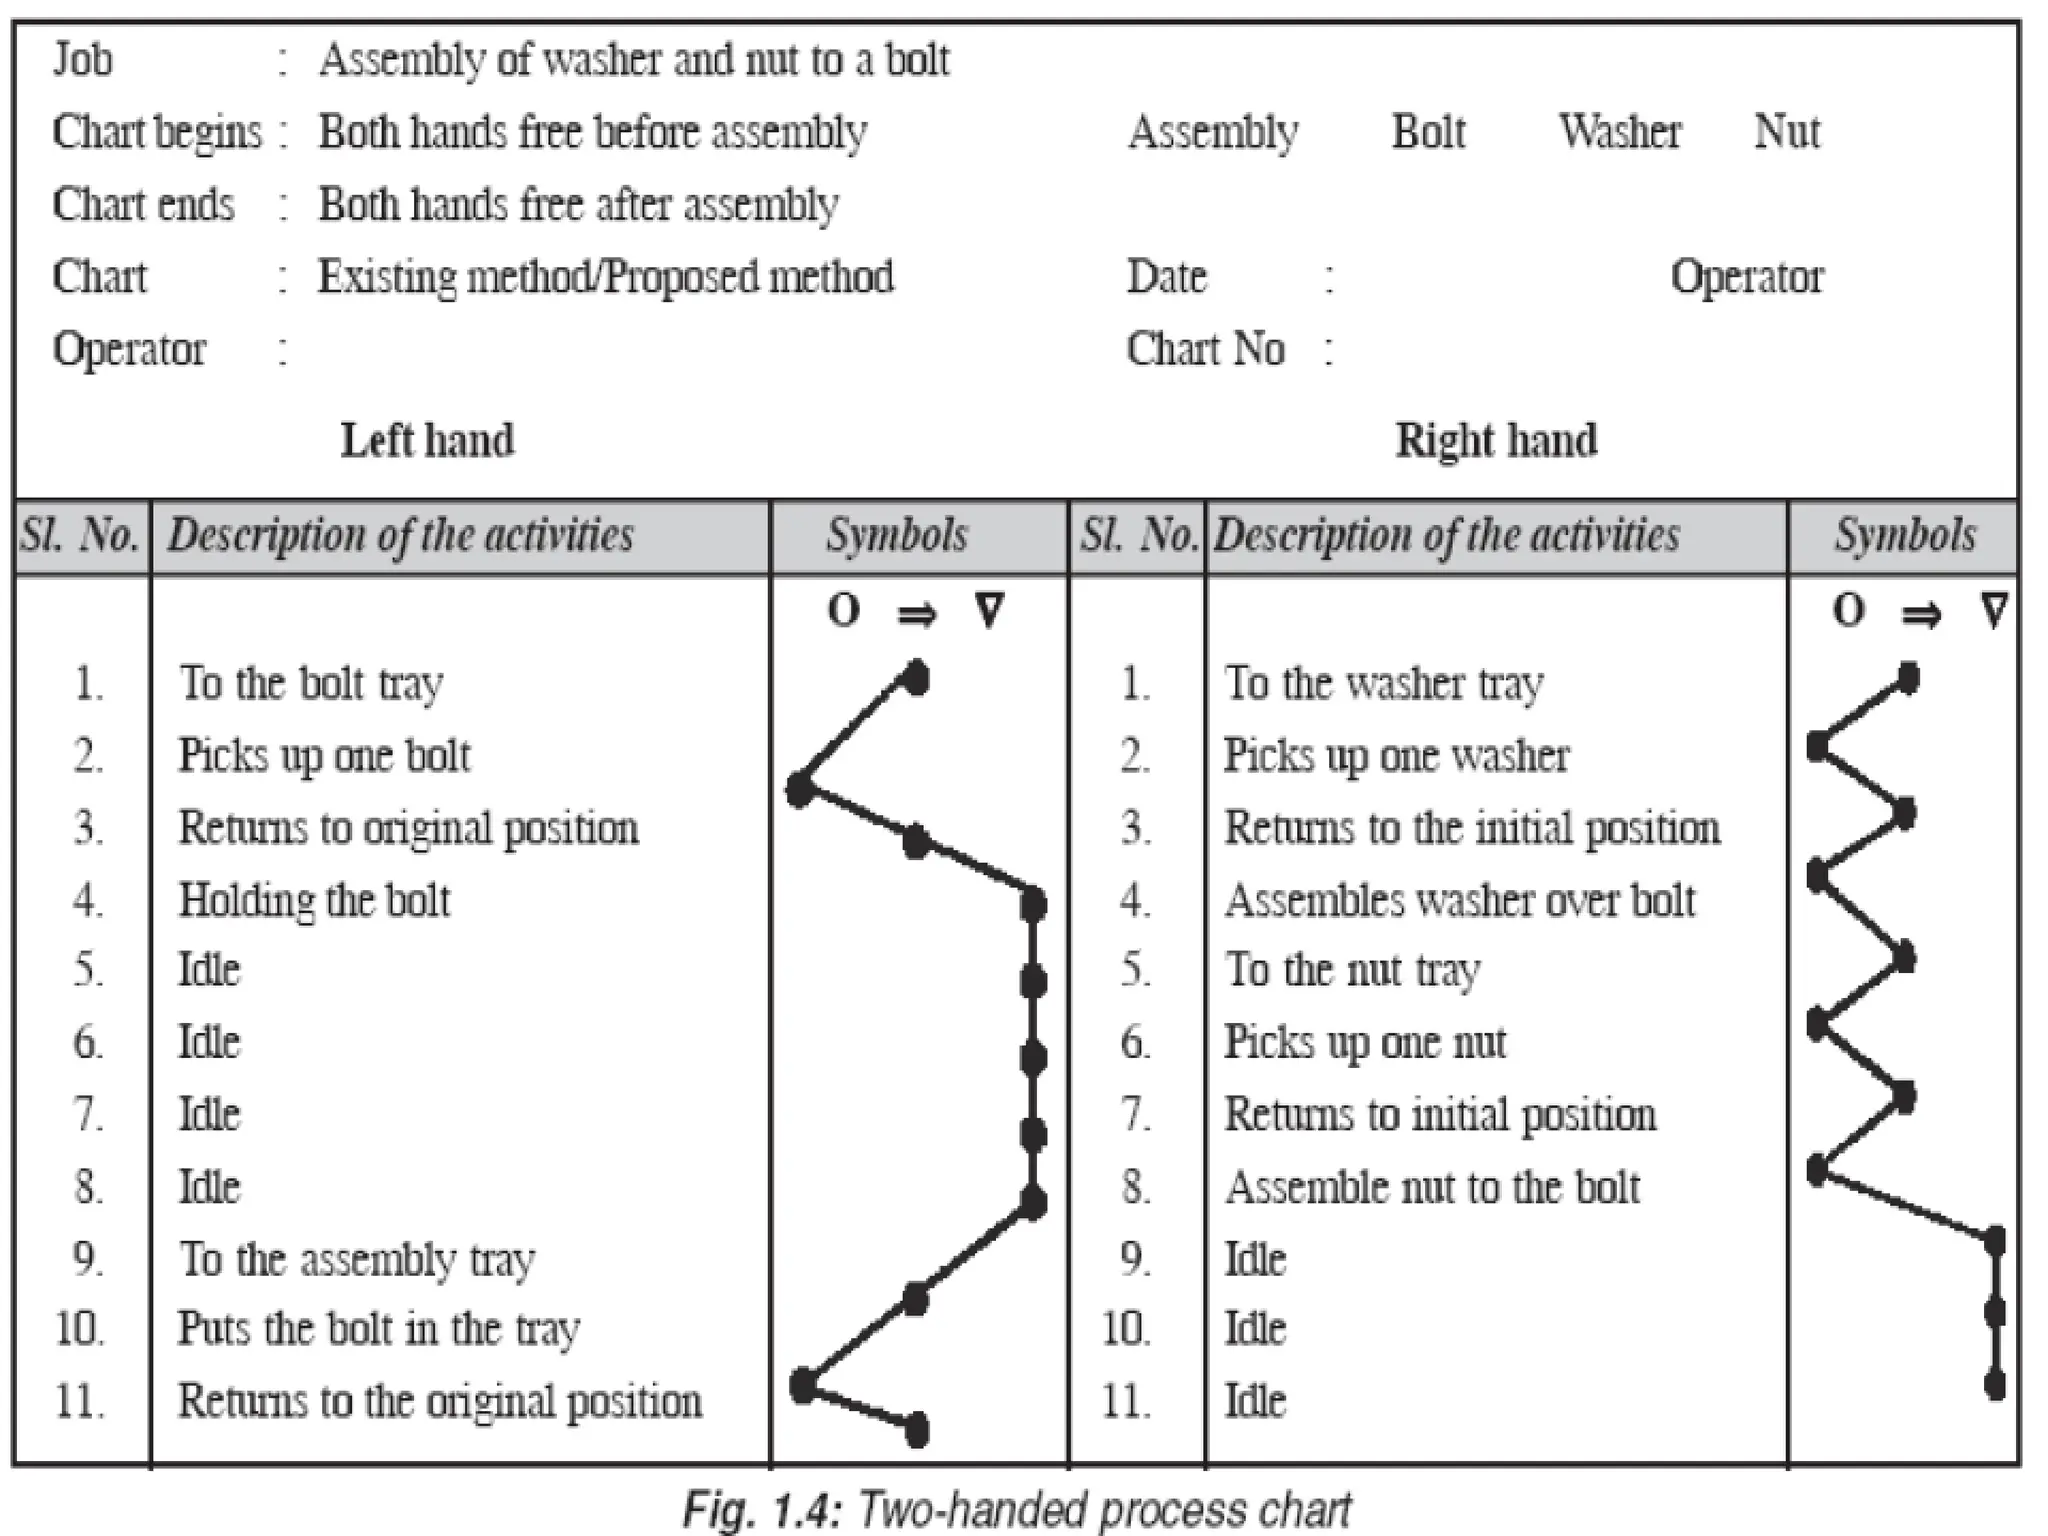

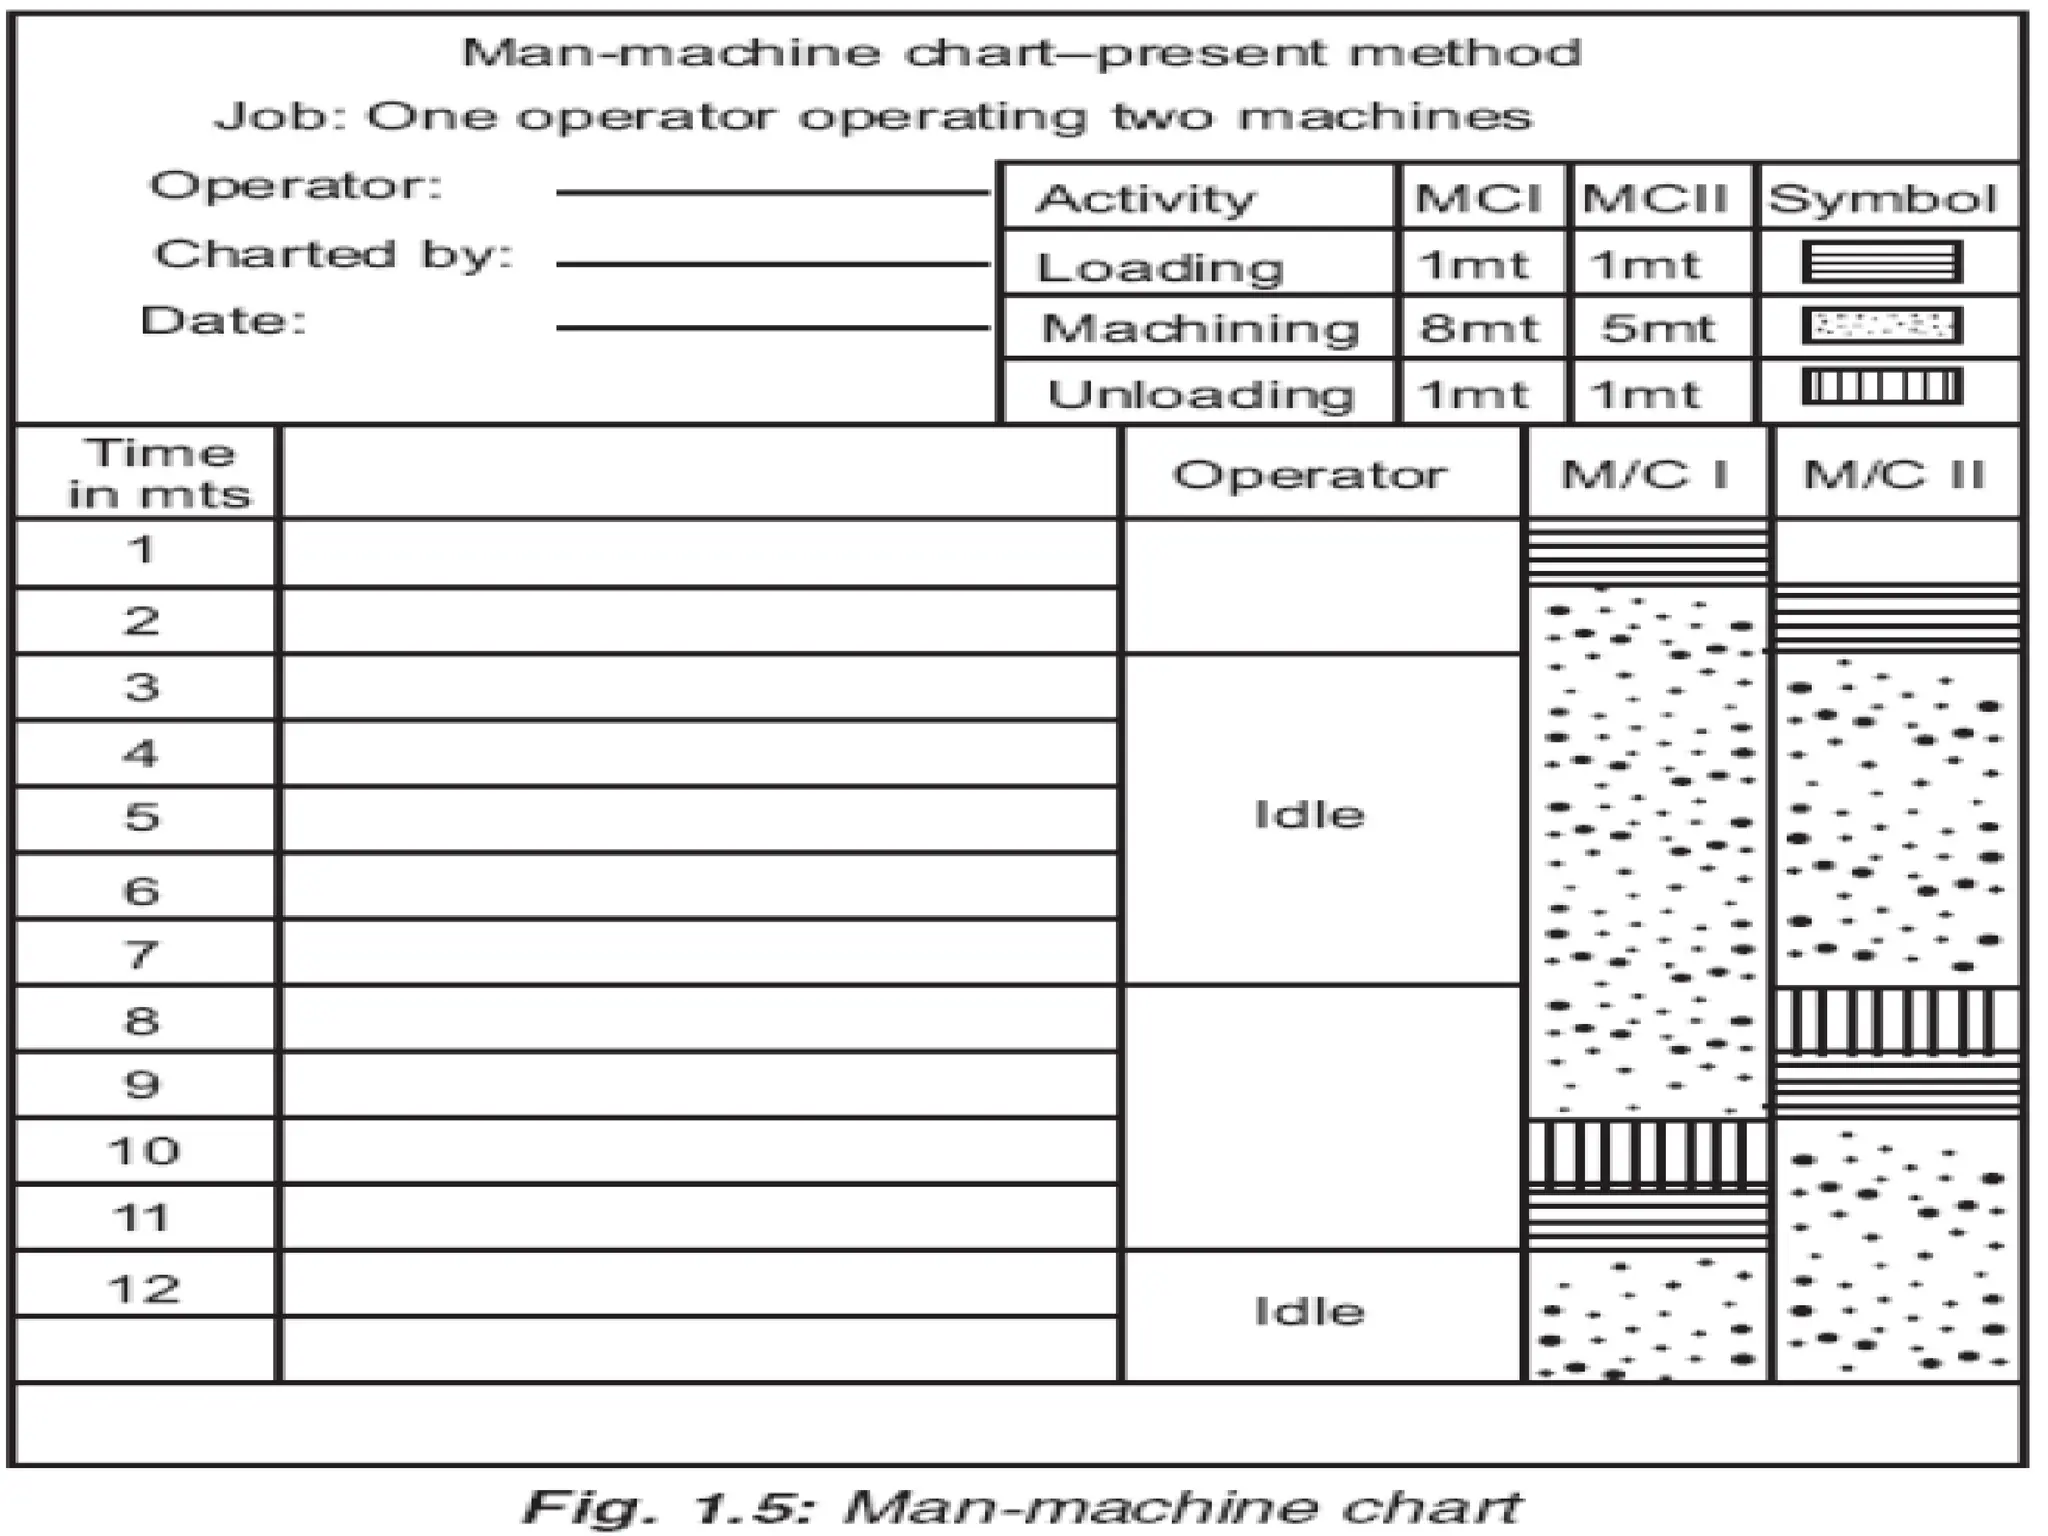
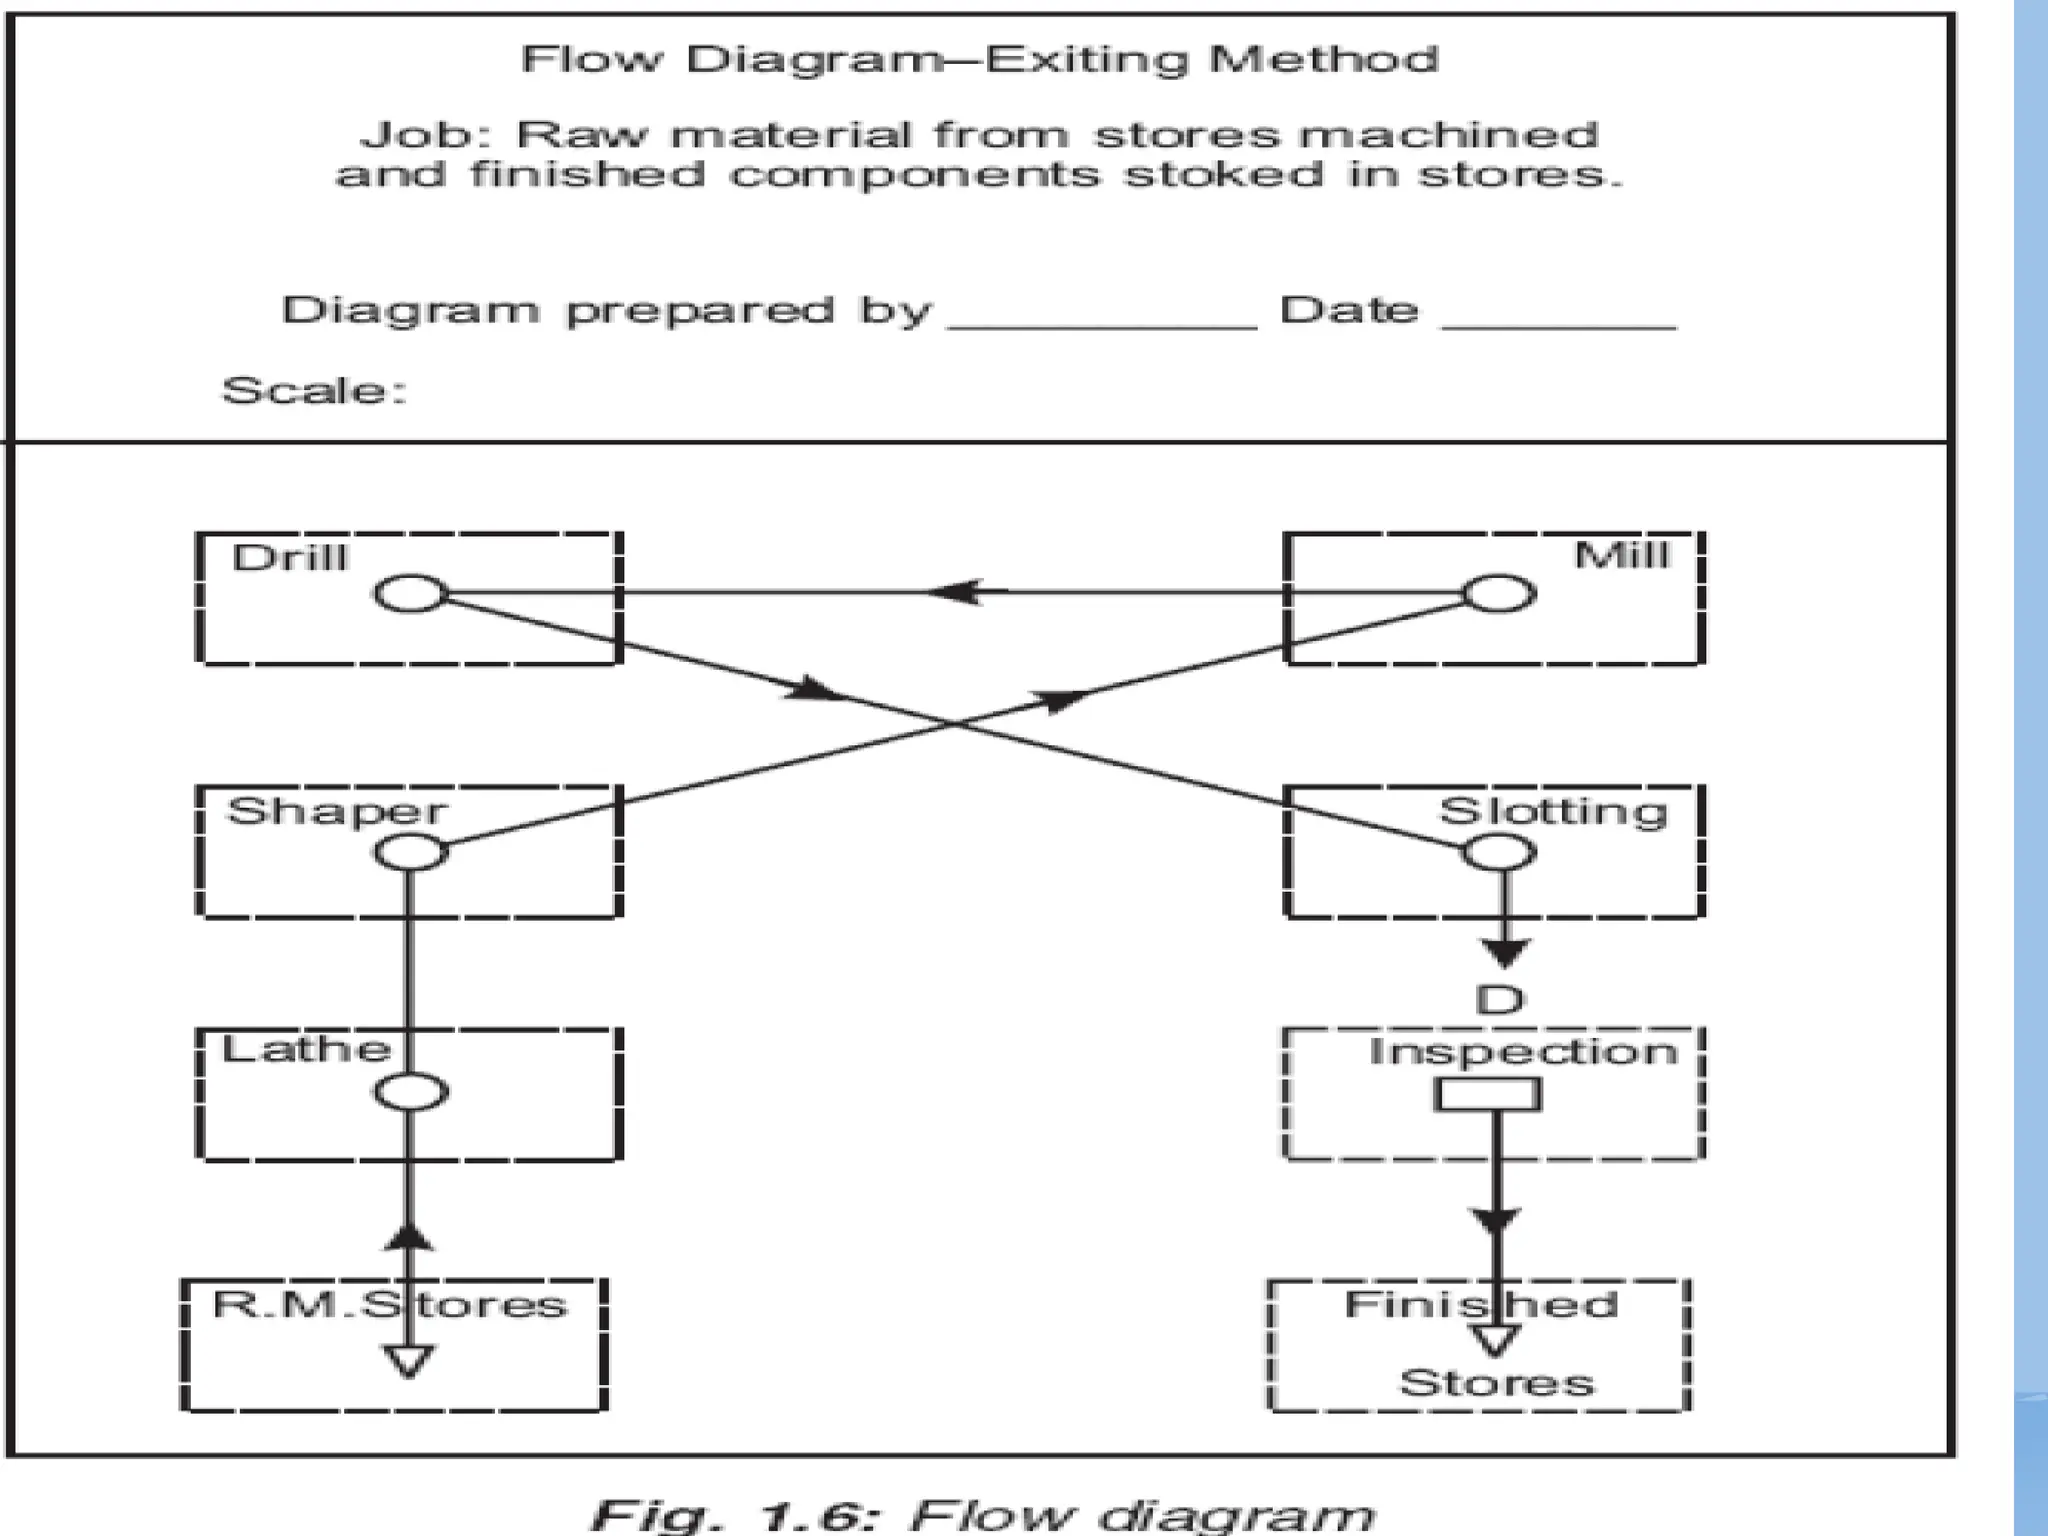


The document explains various types of process charts used in operations analysis, including flow process charts, two-handed process charts, man-machine charts, flow diagrams, and string diagrams. Each chart is designed to represent different aspects of workflows, such as activities performed by workers or machines, material handling, and workspace layout. Guidelines for creating these charts emphasize the importance of accurate observation, clear documentation, and practicality for future reference.