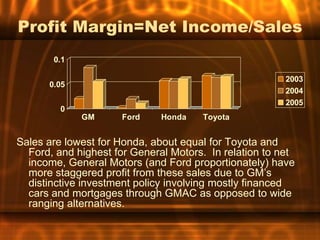
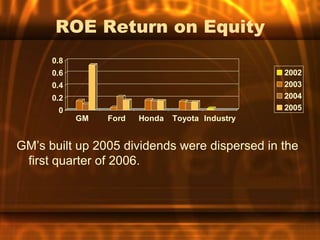
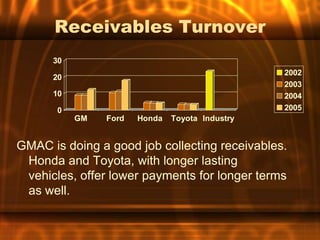
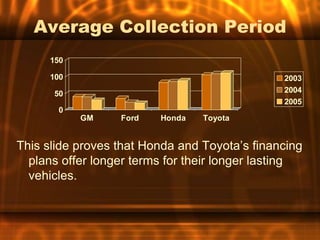
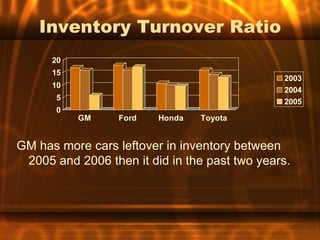
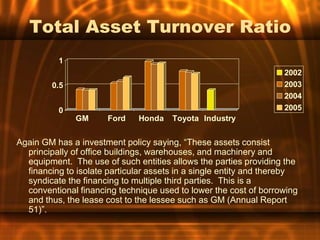
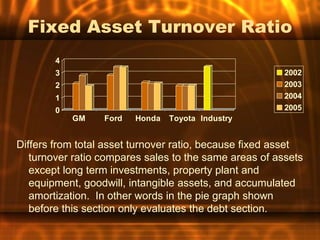
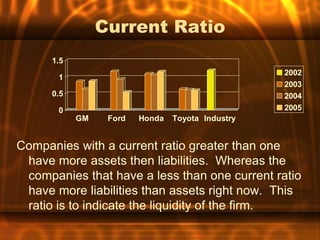
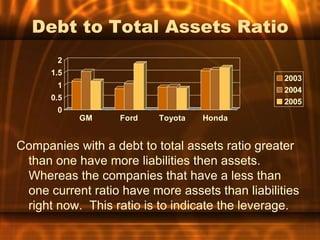
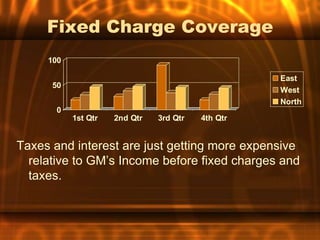
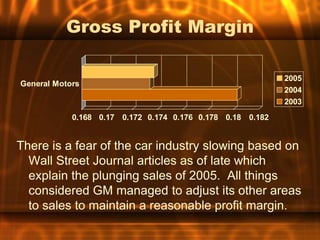
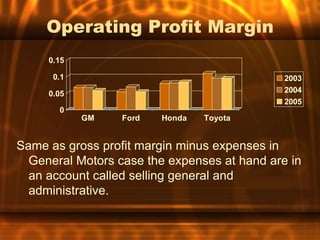
General Motors is a large automaker with over 335,000 employees. It produces vehicles under brands such as Buick, Cadillac, Chevrolet, and GMC. While GM's sales grew modestly in 2005, its employee numbers increased by 3.4%. The company has various subsidiaries and inventory holdings around the world. GM's profit margins have historically been lower than competitors like Toyota and Honda due to its large investments in financing operations through GMAC. Going forward, GM is seeking to improve its financial position by selling interests in GMAC and developing more hybrid vehicles.
In 2005, General Motors (GM) – the world's largest automotive manufacturer is now stepping to the point, where strategic thinking, planning and breakthrough are necessary. Three consecutive years of global market share declines, high pressure from world-class competitors, health care and retirement burdens, and rapid changes in consumer profile are the reason of that. How GM should minimize such threats and in the same time capture potential opportunities with its strengths is very interesting issue in term of strategic management and policy.
This presentation was composed to fulfill the requirement of my masters degree subject. The analysis and solution in this presentation were originated from a business case blended with my knowledge, research and idea. Even though, they may not 100% correct, or not reflect the current situation and solutions of GM, I still hope that this presentation would help those who is interested the situations occurred in 2005
General motors' exit from indian marketSagar Ghosh
After a long but unprofitable stint at India's automobile market, General Motors has finally decided to wind up its sales operations, as well as sell off one of its two manufacturing units. What led to this sudden decision? Who is at fault and for what reasons? Who all are affected? What will be the effect of this and who is going to suffer the most? View this brief presentation to find out !!!!
BOOK SUMMARY OF: Alfred Sloan\'s My Years With General Motorsrrsagar
You have seen the decline of GM. But are you familiar with its rise? General Motors was the company that invented the phrase \'professional management\'. The co on which Peter Drucker wrote his book on Corporations. The one book to be read on management, acc to Bill Gates. Now in a summary by Ravi Raj Sagar.
A half-billion vehicles over 106 years equals billions in commerce, payroll, investments and infrastructure in communities all over the world. For customers, these vehicles played roles in weddings, family vacations, graduations, new businesses and countless milestones along life’s journey.
General Motor Strategic Management AnalysisRashid Javed
Best report of Strategic Management . We apply these tools strategic formulation, implantation and evaluation on general motor very effectively. we hope u will got help from this report. .
A financial ratio (or accounting ratio) is a relative magnitude of two selected numerical values taken from an enterprise's financial statements. Often used in accounting, there are many standard ratios used to try to evaluate the overall financial condition of a corporation or other organization. Financial ratios may be used by managers within a firm, by current and potential shareholders (owners) of a firm, and by a firm's creditors. Financial analysts use financial ratios to compare the strengths and weaknesses in various companies.[1] If shares in a company are traded in a financial market, the market price of the shares is used in certain financial ratios.
Ratios can be expressed as a decimal value, such as 0.10, or given as an equivalent percent value, such as 10%. Some ratios are usually quoted as percentages, especially ratios that are usually or always less than 1, such as earnings yield, while others are usually quoted as decimal numbers, especially ratios that are usually more than 1, such as P/E ratio; these latter are also called multiples. Given any ratio, one can take its reciprocal; if the ratio was above 1, the reciprocal will be below 1, and conversely. The reciprocal expresses the same information, but may be more understandable: for instance, the earnings yield can be compared with bond yields, while the P/E ratio cannot be: for example, a P/E ratio of 20 corresponds to an earnings yield of 5%.
Values used in calculating financial ratios are taken from the balance sheet, income statement, statement of cash flows or (sometimes) the statement of retained earnings. These comprise the firm's "accounting statements" or financial statements. The statements' data is based on the accounting method and accounting standards used by the organization.
Ratios
Profitability ratios
Liquidity ratios
Activity ratios (Efficiency Ratios)
Debt ratios (leveraging ratios)
Market ratios
Capital budgeting ratios
Financial ratios quantify many aspects of a business and are an integral part of the financial statement analysis. Financial ratios are categorized according to the financial aspect of the business which the ratio measures. Liquidity ratios measure the availability of cash to pay debt.[2] Activity ratios measure how quickly a firm converts non-cash assets to cash assets.[3] Debt ratios measure the firm's ability to repay long-term debt.[4] Profitability ratios measure the firm's use of its assets and control of its expenses to generate an acceptable rate of return.[5] Market ratios measure investor response to owning a company's stock and also the cost of issuing stock.[6] These are concerned with the return on investment for shareholders, and with the relationship between return and the value of an investment in company’s shares.
Financial ratios allow for comparisons
between companies
between industries
between different time periods for one company
between a single company and its industry average
This particular project is based on ratio analysis of Coca-Cola International. I have analyzed two years financial performance of Coke i.e. from 2011 to 2012. I hope my this effort will help other interested students.
Ford and GM A Comparison of 2 Fortune 500 CompaniesLeo de Sousa
This paper compares and contrasts two top ten Fortune 500 automotive companies: Ford Motor Company (Ford) and General Motors Corporation (GM). Through a series of strategic decisions and initiatives, Ford was able to survive the 2008-2009 global economic crisis. General Motors had similar opportunities to make strategic changes but remained entrenched in their approaches and strategy. The result was General Motors filed for bankruptcy, and had to ask the US and Canadian governments for loans in order to restart business.
I need a paragraph of information added in the appropriate place to .docxursabrooks36447
I need a paragraph of information added in the appropriate place to my paper with in-text citing along with citing the source. The source has to be from Securities Exchange Commission (SEC). The PAPER is located below.
Comprehensive Analysis of Ford Motor Company
Bigfella15
Institution
Abstract
Since its beginning in 1903, the Ford Motor company has gone through some phases to enable it to reach its current market position. The Ford Motor Company possesses a good supply chain management status that enables it to receive raw materials and sell its products to the domestic and international market. Its possession of 90 plants and more than 213,000 employees in three major regions of the world makes it manufacture $5 million vehicles yearly, generating approximately $100 billion. The market is highly demanding and possesses dynamic changes that affect automobile companies such as Ford Motor. The market also comprises of some challenging factors such as fluctuating prices of oil and petroleum, competition, and political instability among others that affect the operations of Ford Motor Company. The SWOT Analysis of Ford Motor Company influences the company to adapt effective strategies that save it from falling in the market. Developing the right approaches in the company’s operations makes it easy for the company to beat the competition and remain relevant.
Comprehensive Analysis of Ford Motor Company
Introduction
The paper discusses the Ford Motor Company through an extensive and conclusive research. It uses the available public information about the company and its operations. It carries out an analysis of its products and services, and how it relates to the market. The paper discusses the relationship between Ford’s operations and the stakeholders found in its market (external and internal stakeholders). The stakeholders have a significant status in its operations as they affect the business operations launched by the company on them. Ford Motor Company is also affected by both its internal and external operational environment. The paper discusses the external and internal factors that affect its performance through SWOT (Strength, weakness, opportunities, and threats) Analysis.
The paper also has a key focuses on the corporate strategy provided by Ford Motor Company to survive in the market. Ford Motor Company has come through a period of financial challenges to reach where it is today. The company has employed some strategies that have influenced continuous survival in the market about the competitors. The paper focuses on the corporate strategies that the managers employ to beat the competition and remain relevant in the market. The conclusion session develops a summary of the content of study and gives recommendations to create a clear understanding of the topic of study.
Background Information on Ford Motor Company
Henry Ford, a prolific engineer, born by immigrant farmers, established Ford Motor Company in .
Biological screening of herbal drugs: Introduction and Need for
Phyto-Pharmacological Screening, New Strategies for evaluating
Natural Products, In vitro evaluation techniques for Antioxidants, Antimicrobial and Anticancer drugs. In vivo evaluation techniques
for Anti-inflammatory, Antiulcer, Anticancer, Wound healing, Antidiabetic, Hepatoprotective, Cardio protective, Diuretics and
Antifertility, Toxicity studies as per OECD guidelines
A Strategic Approach: GenAI in EducationPeter Windle
Artificial Intelligence (AI) technologies such as Generative AI, Image Generators and Large Language Models have had a dramatic impact on teaching, learning and assessment over the past 18 months. The most immediate threat AI posed was to Academic Integrity with Higher Education Institutes (HEIs) focusing their efforts on combating the use of GenAI in assessment. Guidelines were developed for staff and students, policies put in place too. Innovative educators have forged paths in the use of Generative AI for teaching, learning and assessments leading to pockets of transformation springing up across HEIs, often with little or no top-down guidance, support or direction.
This Gasta posits a strategic approach to integrating AI into HEIs to prepare staff, students and the curriculum for an evolving world and workplace. We will highlight the advantages of working with these technologies beyond the realm of teaching, learning and assessment by considering prompt engineering skills, industry impact, curriculum changes, and the need for staff upskilling. In contrast, not engaging strategically with Generative AI poses risks, including falling behind peers, missed opportunities and failing to ensure our graduates remain employable. The rapid evolution of AI technologies necessitates a proactive and strategic approach if we are to remain relevant.
Operation “Blue Star” is the only event in the history of Independent India where the state went into war with its own people. Even after about 40 years it is not clear if it was culmination of states anger over people of the region, a political game of power or start of dictatorial chapter in the democratic setup.
The people of Punjab felt alienated from main stream due to denial of their just demands during a long democratic struggle since independence. As it happen all over the word, it led to militant struggle with great loss of lives of military, police and civilian personnel. Killing of Indira Gandhi and massacre of innocent Sikhs in Delhi and other India cities was also associated with this movement.
Macroeconomics- Movie Location
This will be used as part of your Personal Professional Portfolio once graded.
Objective:
Prepare a presentation or a paper using research, basic comparative analysis, data organization and application of economic information. You will make an informed assessment of an economic climate outside of the United States to accomplish an entertainment industry objective.
Unit 8 - Information and Communication Technology (Paper I).pdfThiyagu K
This slides describes the basic concepts of ICT, basics of Email, Emerging Technology and Digital Initiatives in Education. This presentations aligns with the UGC Paper I syllabus.
June 3, 2024 Anti-Semitism Letter Sent to MIT President Kornbluth and MIT Cor...Levi Shapiro
Letter from the Congress of the United States regarding Anti-Semitism sent June 3rd to MIT President Sally Kornbluth, MIT Corp Chair, Mark Gorenberg
Dear Dr. Kornbluth and Mr. Gorenberg,
The US House of Representatives is deeply concerned by ongoing and pervasive acts of antisemitic
harassment and intimidation at the Massachusetts Institute of Technology (MIT). Failing to act decisively to ensure a safe learning environment for all students would be a grave dereliction of your responsibilities as President of MIT and Chair of the MIT Corporation.
This Congress will not stand idly by and allow an environment hostile to Jewish students to persist. The House believes that your institution is in violation of Title VI of the Civil Rights Act, and the inability or
unwillingness to rectify this violation through action requires accountability.
Postsecondary education is a unique opportunity for students to learn and have their ideas and beliefs challenged. However, universities receiving hundreds of millions of federal funds annually have denied
students that opportunity and have been hijacked to become venues for the promotion of terrorism, antisemitic harassment and intimidation, unlawful encampments, and in some cases, assaults and riots.
The House of Representatives will not countenance the use of federal funds to indoctrinate students into hateful, antisemitic, anti-American supporters of terrorism. Investigations into campus antisemitism by the Committee on Education and the Workforce and the Committee on Ways and Means have been expanded into a Congress-wide probe across all relevant jurisdictions to address this national crisis. The undersigned Committees will conduct oversight into the use of federal funds at MIT and its learning environment under authorities granted to each Committee.
• The Committee on Education and the Workforce has been investigating your institution since December 7, 2023. The Committee has broad jurisdiction over postsecondary education, including its compliance with Title VI of the Civil Rights Act, campus safety concerns over disruptions to the learning environment, and the awarding of federal student aid under the Higher Education Act.
• The Committee on Oversight and Accountability is investigating the sources of funding and other support flowing to groups espousing pro-Hamas propaganda and engaged in antisemitic harassment and intimidation of students. The Committee on Oversight and Accountability is the principal oversight committee of the US House of Representatives and has broad authority to investigate “any matter” at “any time” under House Rule X.
• The Committee on Ways and Means has been investigating several universities since November 15, 2023, when the Committee held a hearing entitled From Ivory Towers to Dark Corners: Investigating the Nexus Between Antisemitism, Tax-Exempt Universities, and Terror Financing. The Committee followed the hearing with letters to those institutions on January 10, 202
TESDA TM1 REVIEWER FOR NATIONAL ASSESSMENT WRITTEN AND ORAL QUESTIONS WITH A...
General motors corporation2
1. GENERAL MOTORS
CORPORATION
Erika L. LaMarch
Finance 362
Professor Fitzwater
2. Executives
• G. Richard (Rick) Wagoner Jr.
Chairman
CEO
• Frederick A. (Fritz) Henderson
Vice Chairman
CFO
• Ralph J. Szygenda
Group VP
Information Systems and Services
CIO
4. #1 Producer
• Buick
• Cadillac
• Chevrolet
• GMC
• Pontiac
• Saab
• Saturn
5. Investments
• Inventory Subsidiaries • GMAC Finances
– Holden – Suzuki Motor
– Opel – GM Daewoo Auto&
– Vauxhall Technology
– CAMI Automotive, Inc. – Fiat
GM of Canada Limited – Fuji Heavy Industries
– Allison Transmission (Subaru)
– Locomotive
Manufacturing
6. Profit Margin=Net Income/Sales
0.1
2003
0.05
2004
2005
0
GM Ford Honda Toyota
Sales are lowest for Honda, about equal for Toyota and
Ford, and highest for General Motors. In relation to net
income, General Motors (and Ford proportionately) have
more staggered profit from these sales due to GM’s
distinctive investment policy involving mostly financed
cars and mortgages through GMAC as opposed to wide
ranging alternatives.
7. Debt Make-Up Projections
Debt (See Investments Slide)
Capital Lease Obligations
Operating Lease Obligations
Contractual Commitments for Capital Expenditures
Post Retirement Benefits
2006-2007 Debt Breakdown
2005 Debt Breakdown
2008-2009 Debt Breakdown 2010+ Debt Breakdown
Assess deviation of investments for different years, and influence of financed assets.
8. ROA Return on Assets
0.4
0.3 2002
0.2 2003
0.1 2004
0 2005
GM Ford Honda Toyota Industry
Again the financing of cars and mortgages in
deviating amounts and mystifying patterns
causes GM to show a staggered in the area of
overall assets’ benefits.
9. ROE Return on Equity
0.8
0.6 2002
0.4 2003
0.2 2004
0 2005
GM Ford Honda Toyota Industry
GM’s built up 2005 dividends were dispersed in the
first quarter of 2006.
10. Receivables Turnover
30
2002
20
2003
10 2004
0 2005
GM Ford Honda Toyota Industry
GMAC is doing a good job collecting receivables.
Honda and Toyota, with longer lasting
vehicles, offer lower payments for longer terms
as well.
11. Average Collection Period
150
100 2003
50 2004
2005
0
GM Ford Honda Toyota
This slide proves that Honda and Toyota’s financing
plans offer longer terms for their longer lasting
vehicles.
12. Inventory Turnover Ratio
20
15
2003
10
2004
5 2005
0
GM Ford Honda Toyota
GM has more cars leftover in inventory between
2005 and 2006 then it did in the past two years.
13. Total Asset Turnover Ratio
1
2002
0.5 2003
2004
0 2005
GM Ford Honda Toyota Industry
Again GM has a investment policy saying, “These assets consist
principally of office buildings, warehouses, and machinery and
equipment. The use of such entities allows the parties providing the
financing to isolate particular assets in a single entity and thereby
syndicate the financing to multiple third parties. This is a
conventional financing technique used to lower the cost of borrowing
and thus, the lease cost to the lessee such as GM (Annual Report
51)”.
14. Fixed Asset Turnover Ratio
4
3 2002
2 2003
1 2004
0 2005
GM Ford Honda Toyota Industry
Differs from total asset turnover ratio, because fixed asset
turnover ratio compares sales to the same areas of assets
except long term investments, property plant and
equipment, goodwill, intangible assets, and accumulated
amortization. In other words in the pie graph shown
before this section only evaluates the debt section.
15. Current Ratio
1.5
2002
1
2003
0.5 2004
0 2005
GM Ford Honda Toyota Industry
Companies with a current ratio greater than one
have more assets then liabilities. Whereas the
companies that have a less than one current ratio
have more liabilities than assets right now. This
ratio is to indicate the liquidity of the firm.
16. Quick Ratio
1
2002
0.5 2003
2004
0 2005
1st Qtr 2nd Qtr 3rd Qtr 4th Qtr Industry
Since inventory is meant for sale its function in the
current ratio can be taken away to offer the quick
ratio which measures all of the assets versus
liabilities in the absence of inventory.
17. Debt to Total Assets Ratio
2
1.5
2003
1
2004
0.5 2005
0
GM Ford Toyota Honda
Companies with a debt to total assets ratio greater
than one have more liabilities then assets.
Whereas the companies that have a less than
one current ratio have more assets than liabilities
right now. This ratio is to indicate the leverage.
18. Debt to Equity Ratio
8
6
2003
4
2004
2 2005
0
GM Ford Honda Toyota
Companies with a debt to total assets ratio greater
than one have more equity then liability.
Whereas the companies that have a less than
one current ratio have more liability than equity
right now. This ratio is to indicate the leverage.
19. Times Interest Earned
2
1.5 2002
1 2003
0.5 2004
0 2005
GM Ford Industry
• Cultural value differences cause Honda and
Toyota to have much higher Times Interest
Earned. So severe was the difference that I
removed these columns.
20. Fixed Charge Coverage
100
East
50
West
North
0
1st Qtr 2nd Qtr 3rd Qtr 4th Qtr
Taxes and interest are just getting more expensive
relative to GM’s Income before fixed charges and
taxes.
21. Gross Profit Margin
2005
General Motors
2004
2003
0.168 0.17 0.172 0.174 0.176 0.178 0.18 0.182
There is a fear of the car industry slowing based on
Wall Street Journal articles as of late which
explain the plunging sales of 2005. All things
considered GM managed to adjust its other areas
to sales to maintain a reasonable profit margin.
22. Operating Profit Margin
0.15
0.1 2003
0.05 2004
2005
0
GM Ford Honda Toyota
Same as gross profit margin minus expenses in
General Motors case the expenses at hand are in
an account called selling general and
administrative.
23. Debt Repayment in Millions
30000
25000
20000
2006
15000 2007
2008
10000 2009
5000 2010+
0
Long-Term Debt
Payable
24. Future Endeavors
• Need Liquid
– Selling Controlling Interest in
GMAC
– 4 Adjusted Cadillac Body Styles
in China
– Developing Hybrids
– 2007 Line Price Increase
• Acquired AT&T’s Controller
• Sponsoring On-Demand
• Improving Accessories
25. Suggested Future Endeavors
• Merger with Honda or Toyota
– Gain Money
– Improve Consistency of Financial Analysis &Planning
– Take Advantage of Market Surge
• Acquire Cultural Advantage
• Increase Sales from Increased Product Line
• Do NOT pay Dividends Until Stock Value Rises
– Lowering Value encourages stockholders to sell
– Stockholders will sell if they don’t expect dividend
payout