Downloaded 258 times
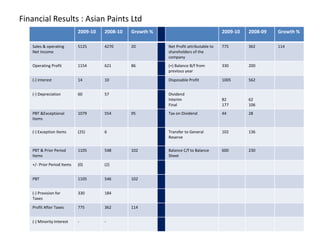
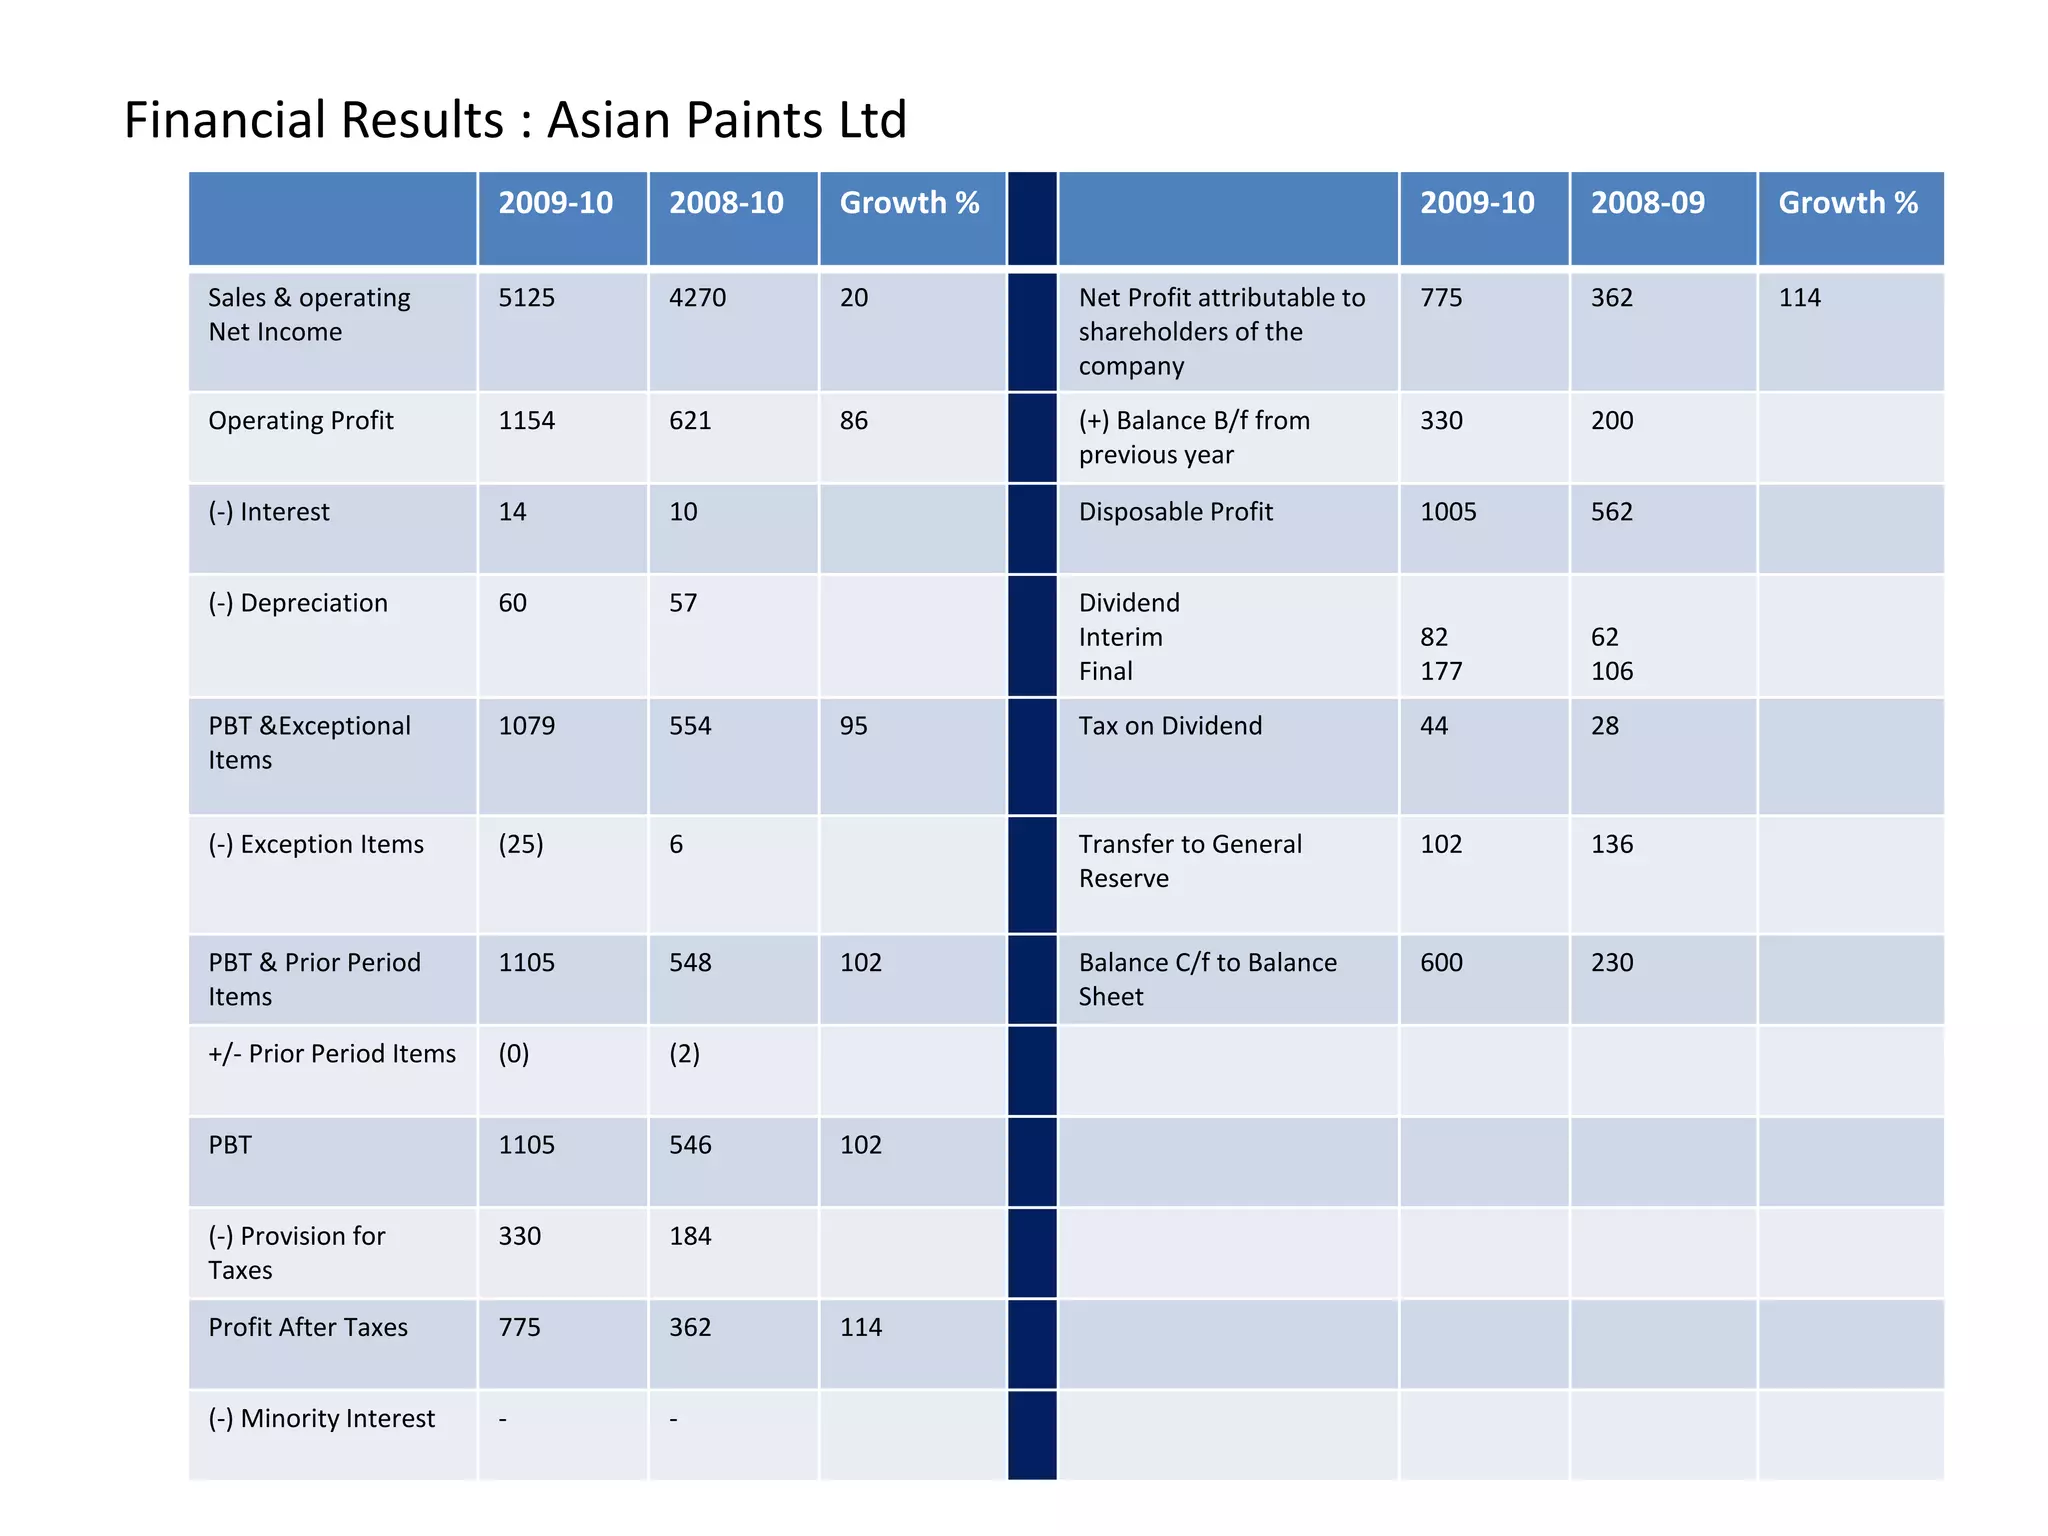
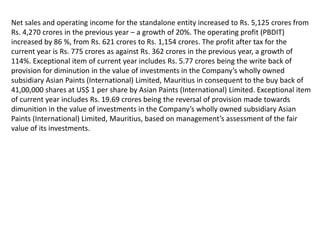
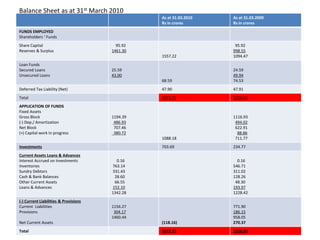
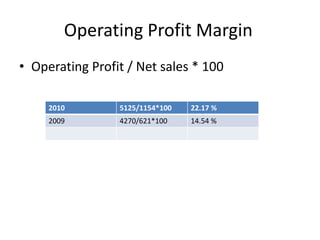
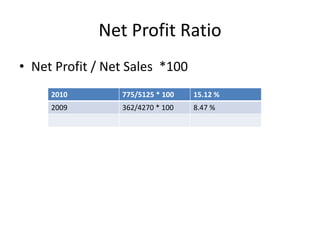
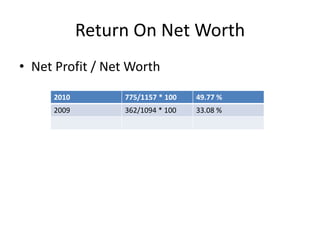
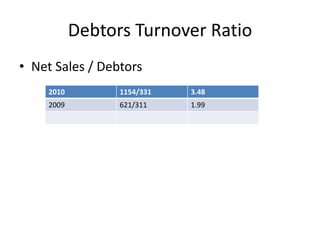
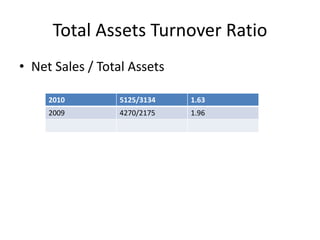
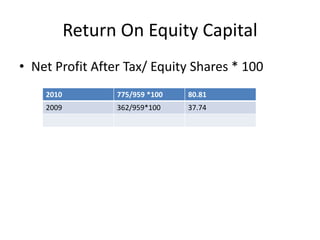
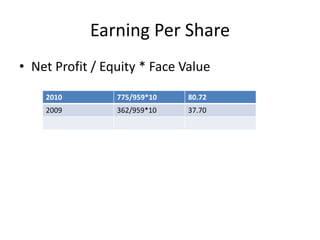

- Net sales and operating income increased 20% to Rs. 5,125 crores from Rs. 4,270 crores previously. Operating profit increased 86% to Rs. 1,154 crores from Rs. 621 crores. - Profit after tax for the current year was Rs. 775 crores, a growth of 114% from Rs. 362 crores in the previous year. - Exceptional items for the current year included a write back of Rs. 25.46 crores from the diminution in value of investments in a subsidiary.


![Getting Started with Apache Spark: Big Data Made Simple [Free Meetup]](https://cdn.slidesharecdn.com/ss_thumbnails/apachesparkgettingstarted-260203175547-8361bcc3-thumbnail.jpg?width=640&height=640&fit=bounds)


