Download to read offline


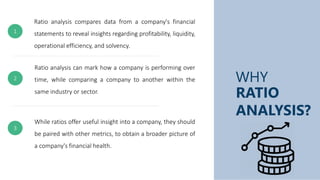


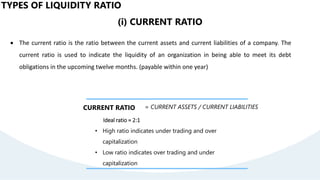


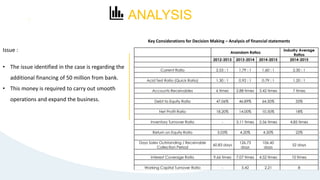

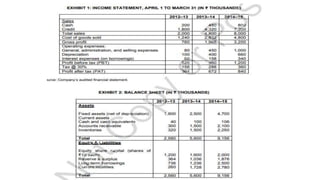


The document provides an overview of ratio analysis, including definitions, purposes, types of ratios, and calculations. Specifically, it discusses: - Ratio analysis involves calculating and interpreting financial ratios to gain insight into a company's profitability, liquidity, operational efficiency, and solvency. - Key types of ratios covered include liquidity ratios, profitability ratios, solvency ratios, and turnover ratios. Specific ratios defined include current ratio, quick ratio, debt-to-equity ratio, return on equity, inventory turnover ratio, and accounts receivable turnover ratio. - Calculations and interpretations of various ratios are presented, along with what higher or lower ratios may indicate about the company's financial health.


