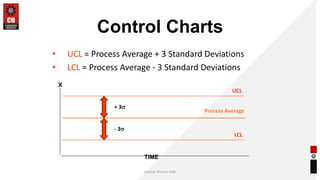
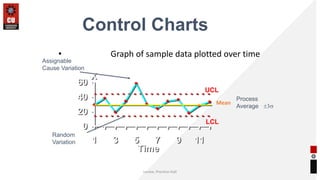
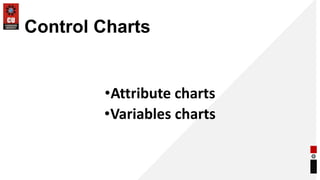
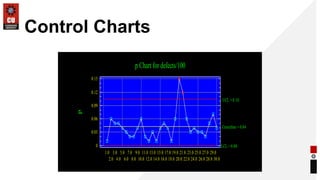
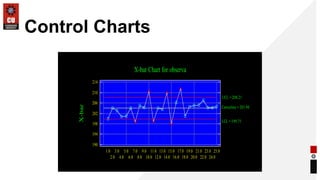
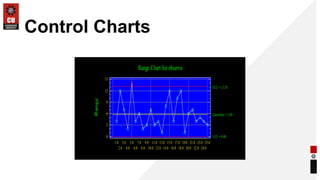
The document discusses control charts, which are statistical quality control tools used to monitor variation in processes. Control charts were originally developed by Walter Shewhart and focus on measuring variability over time. There are two main types of control charts - attributes charts for categorical data and variables charts for continuous data. Attributes charts include c-charts for counts and p-charts for proportions. Variables charts typically include x-bar and R charts, with the x-bar chart monitoring the process average and the R chart monitoring variation. Control charts can be used to study past performance, evaluate current conditions, and identify sources of variation to help improve processes.


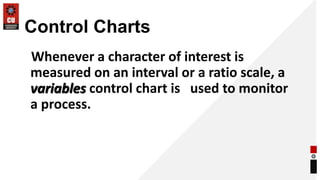
![Control Charts
Charts may
be used for
categorical
variables.
[i.e.: attributes]](https://image.slidesharecdn.com/lecture-5controlcharts-1-231029074428-81c950c4/85/Lecture-5-Control-Charts-1-pptx-13-320.jpg)
![Control Charts
•Attributes Control Charts
counts [c-chart]
proportion [p-charts]](https://image.slidesharecdn.com/lecture-5controlcharts-1-231029074428-81c950c4/85/Lecture-5-Control-Charts-1-pptx-15-320.jpg)
![Control Charts
•Attributes Control Charts
when sample size are not constant
and/or are unknown
use counts charts
[c-charts]](https://image.slidesharecdn.com/lecture-5controlcharts-1-231029074428-81c950c4/85/Lecture-5-Control-Charts-1-pptx-16-320.jpg)

![Control Charts
•Attributes Control Charts
when sample size are constant and are known
use proportion charts
[p-charts]](https://image.slidesharecdn.com/lecture-5controlcharts-1-231029074428-81c950c4/85/Lecture-5-Control-Charts-1-pptx-18-320.jpg)
![Control Charts
Charts may
be used for
interval or
ratio data [i.e.:
variables ]](https://image.slidesharecdn.com/lecture-5controlcharts-1-231029074428-81c950c4/85/Lecture-5-Control-Charts-1-pptx-20-320.jpg)
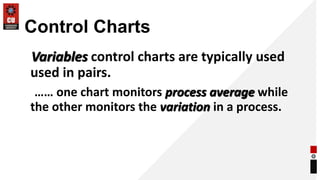
![Control Charts
•Variables Control Charts
Mean and Range charts
[x-bar & R charts]](https://image.slidesharecdn.com/lecture-5controlcharts-1-231029074428-81c950c4/85/Lecture-5-Control-Charts-1-pptx-22-320.jpg)


![Control charts[1]](https://cdn.slidesharecdn.com/ss_thumbnails/controlcharts1-100924110931-phpapp01-thumbnail.jpg?width=640&height=640&fit=bounds)
![Control Charts[1]](https://cdn.slidesharecdn.com/ss_thumbnails/controlcharts1-1226961283054520-8-thumbnail.jpg?width=640&height=640&fit=bounds)
![Control Charts[1]](https://cdn.slidesharecdn.com/ss_thumbnails/controlcharts1-1226081330857138-9-thumbnail.jpg?width=640&height=640&fit=bounds)