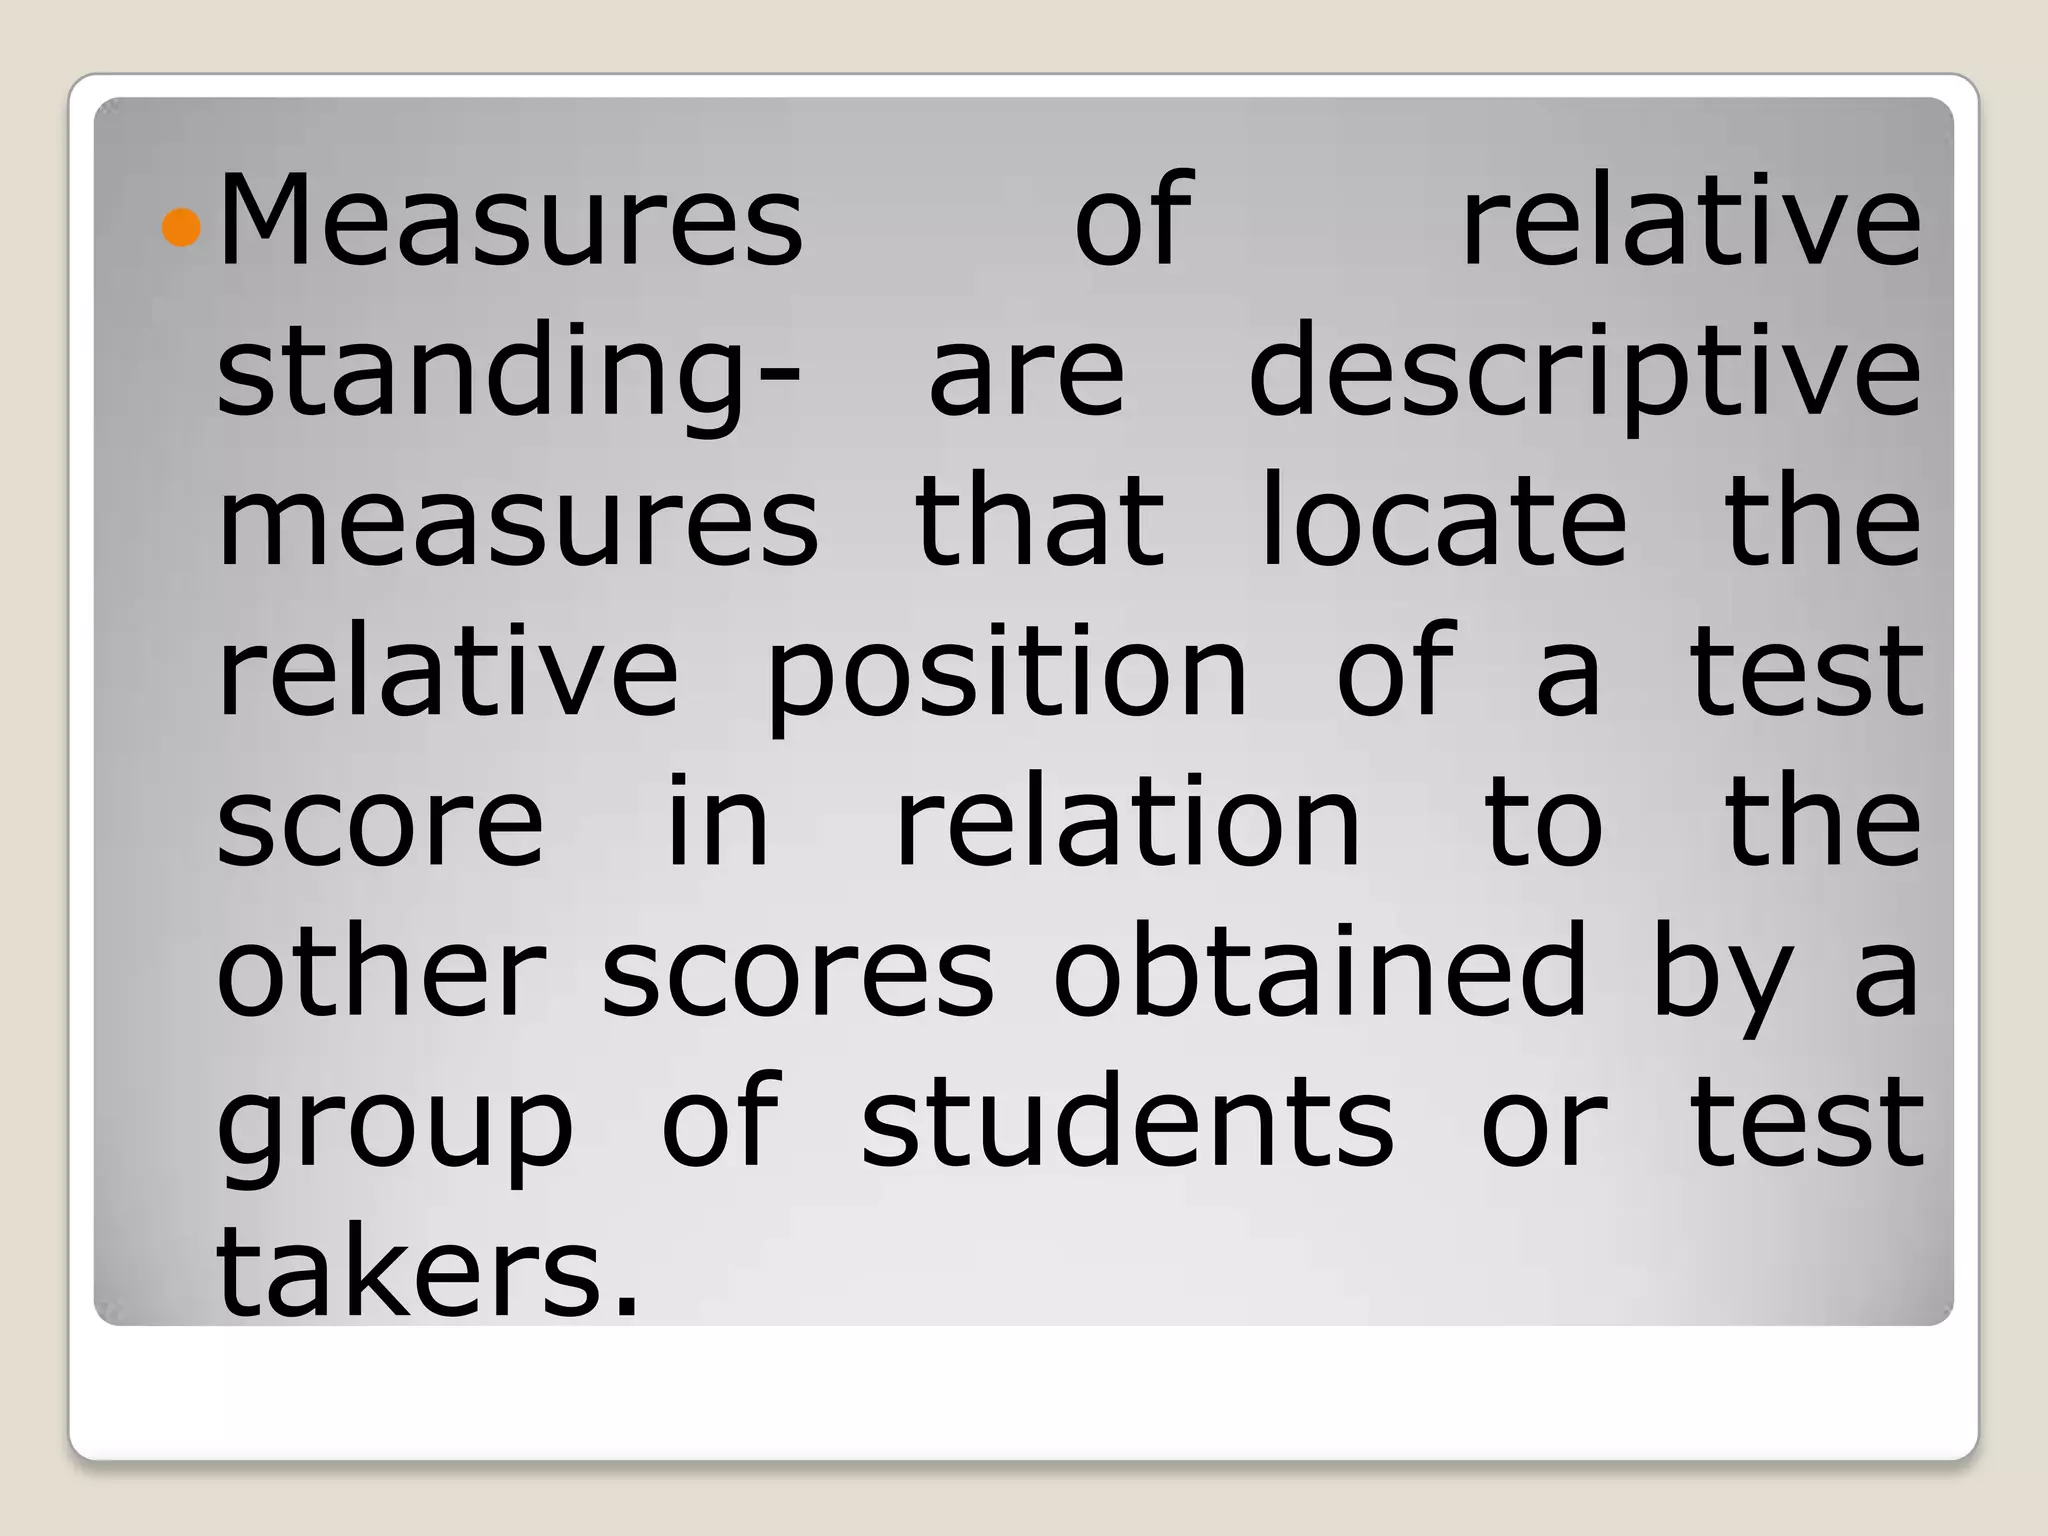
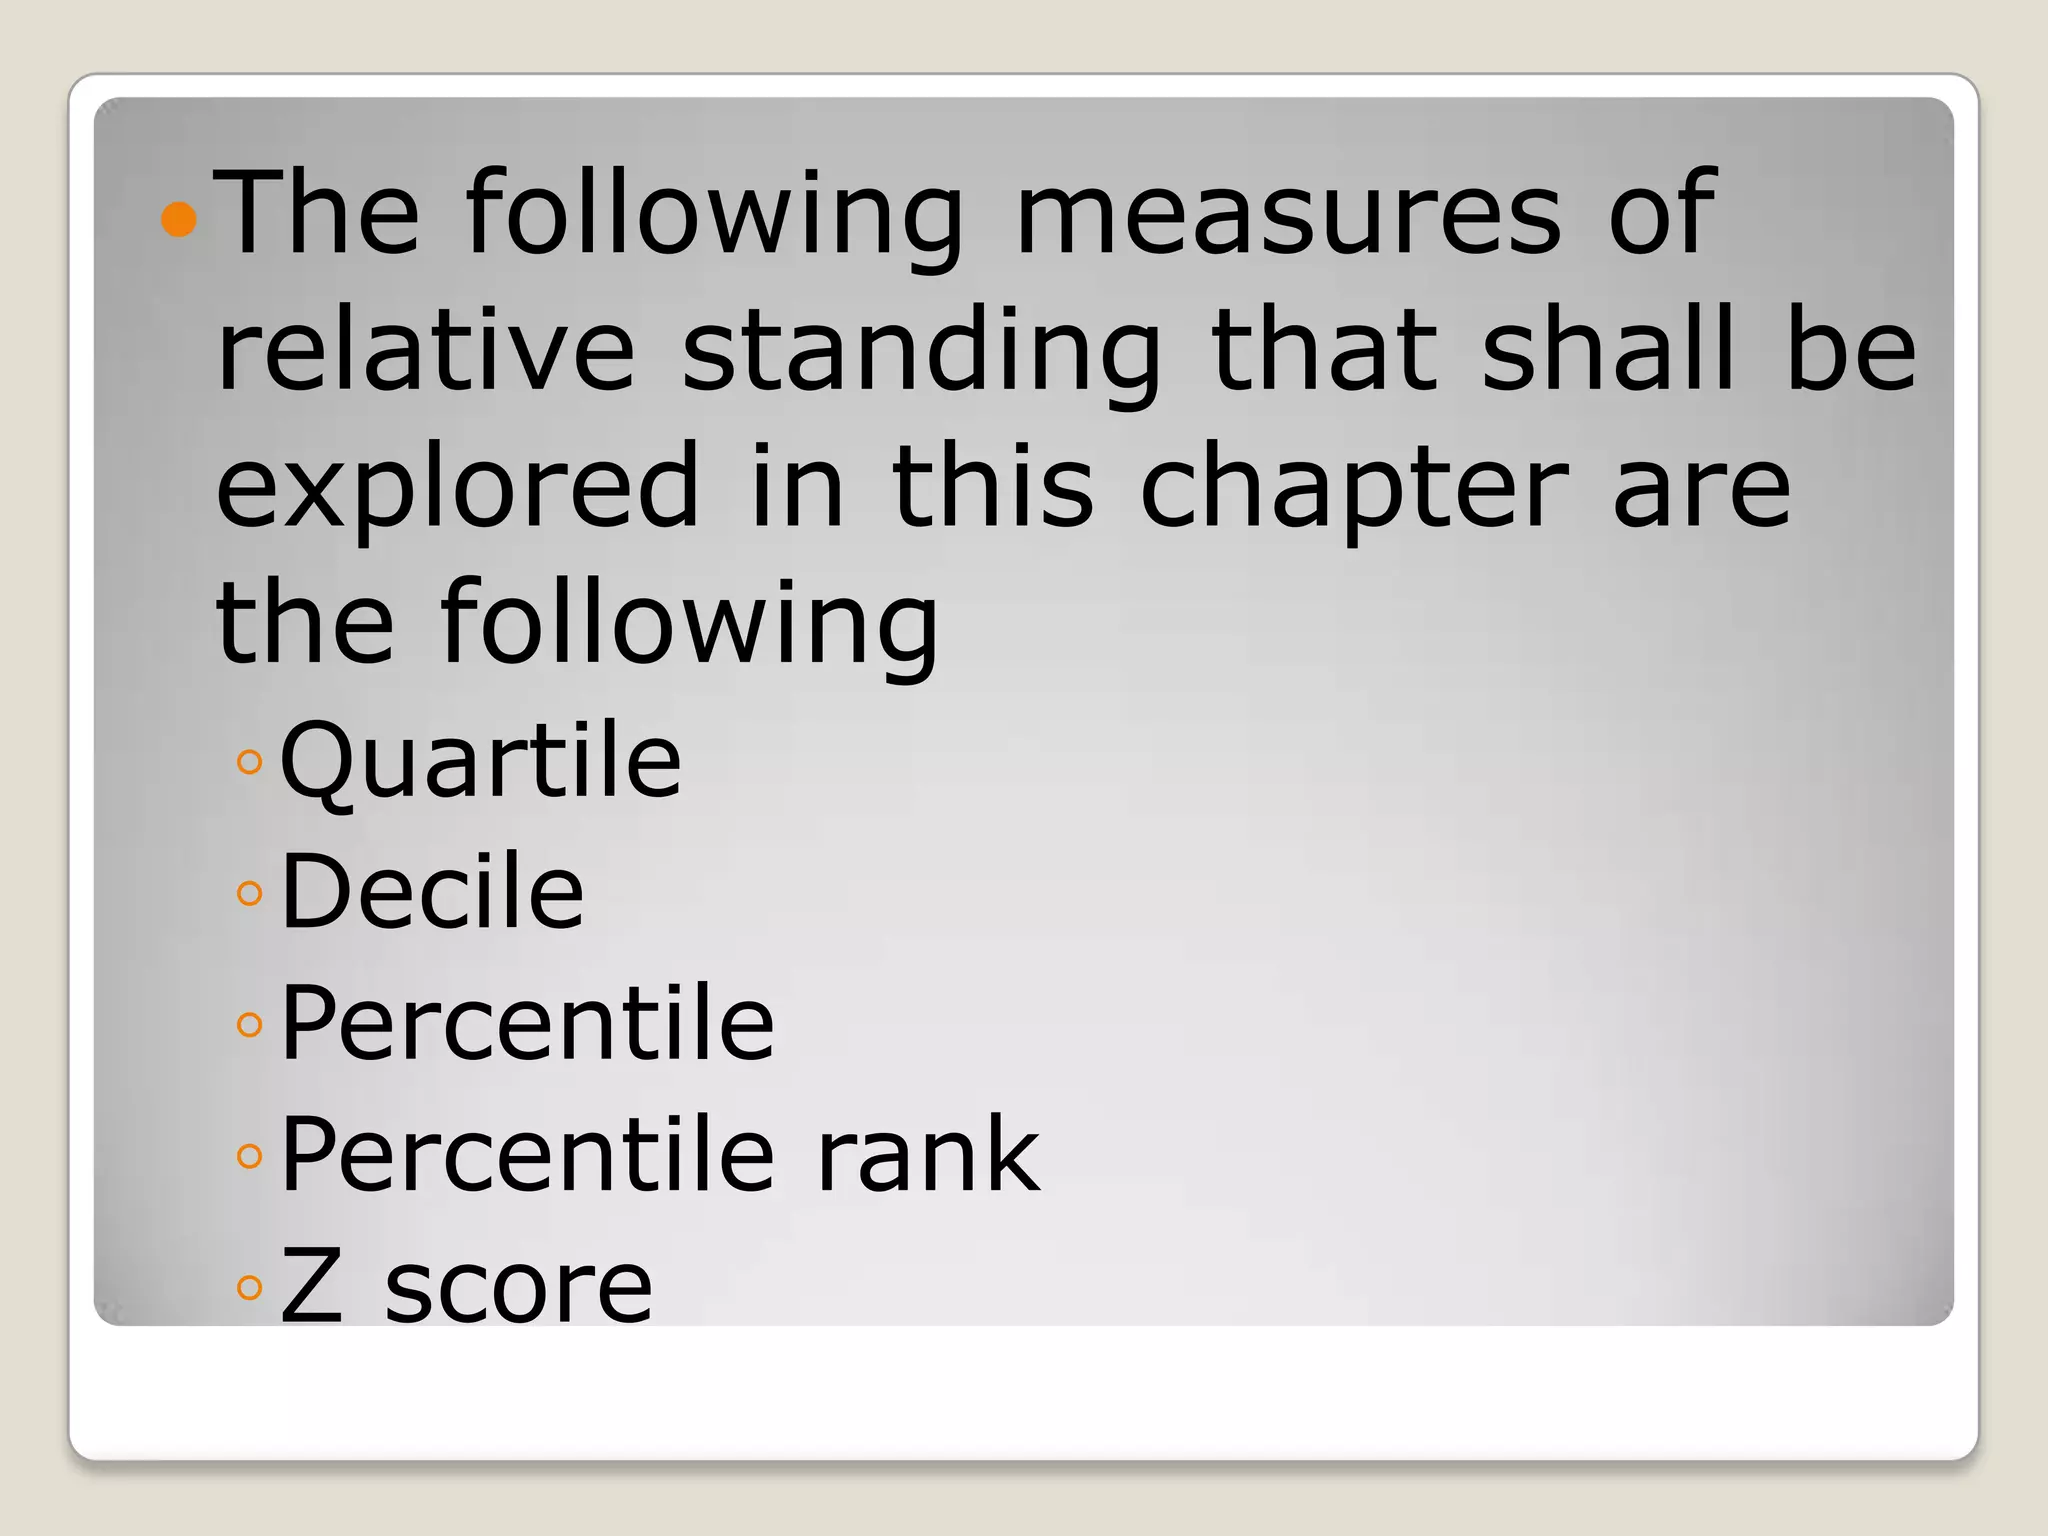
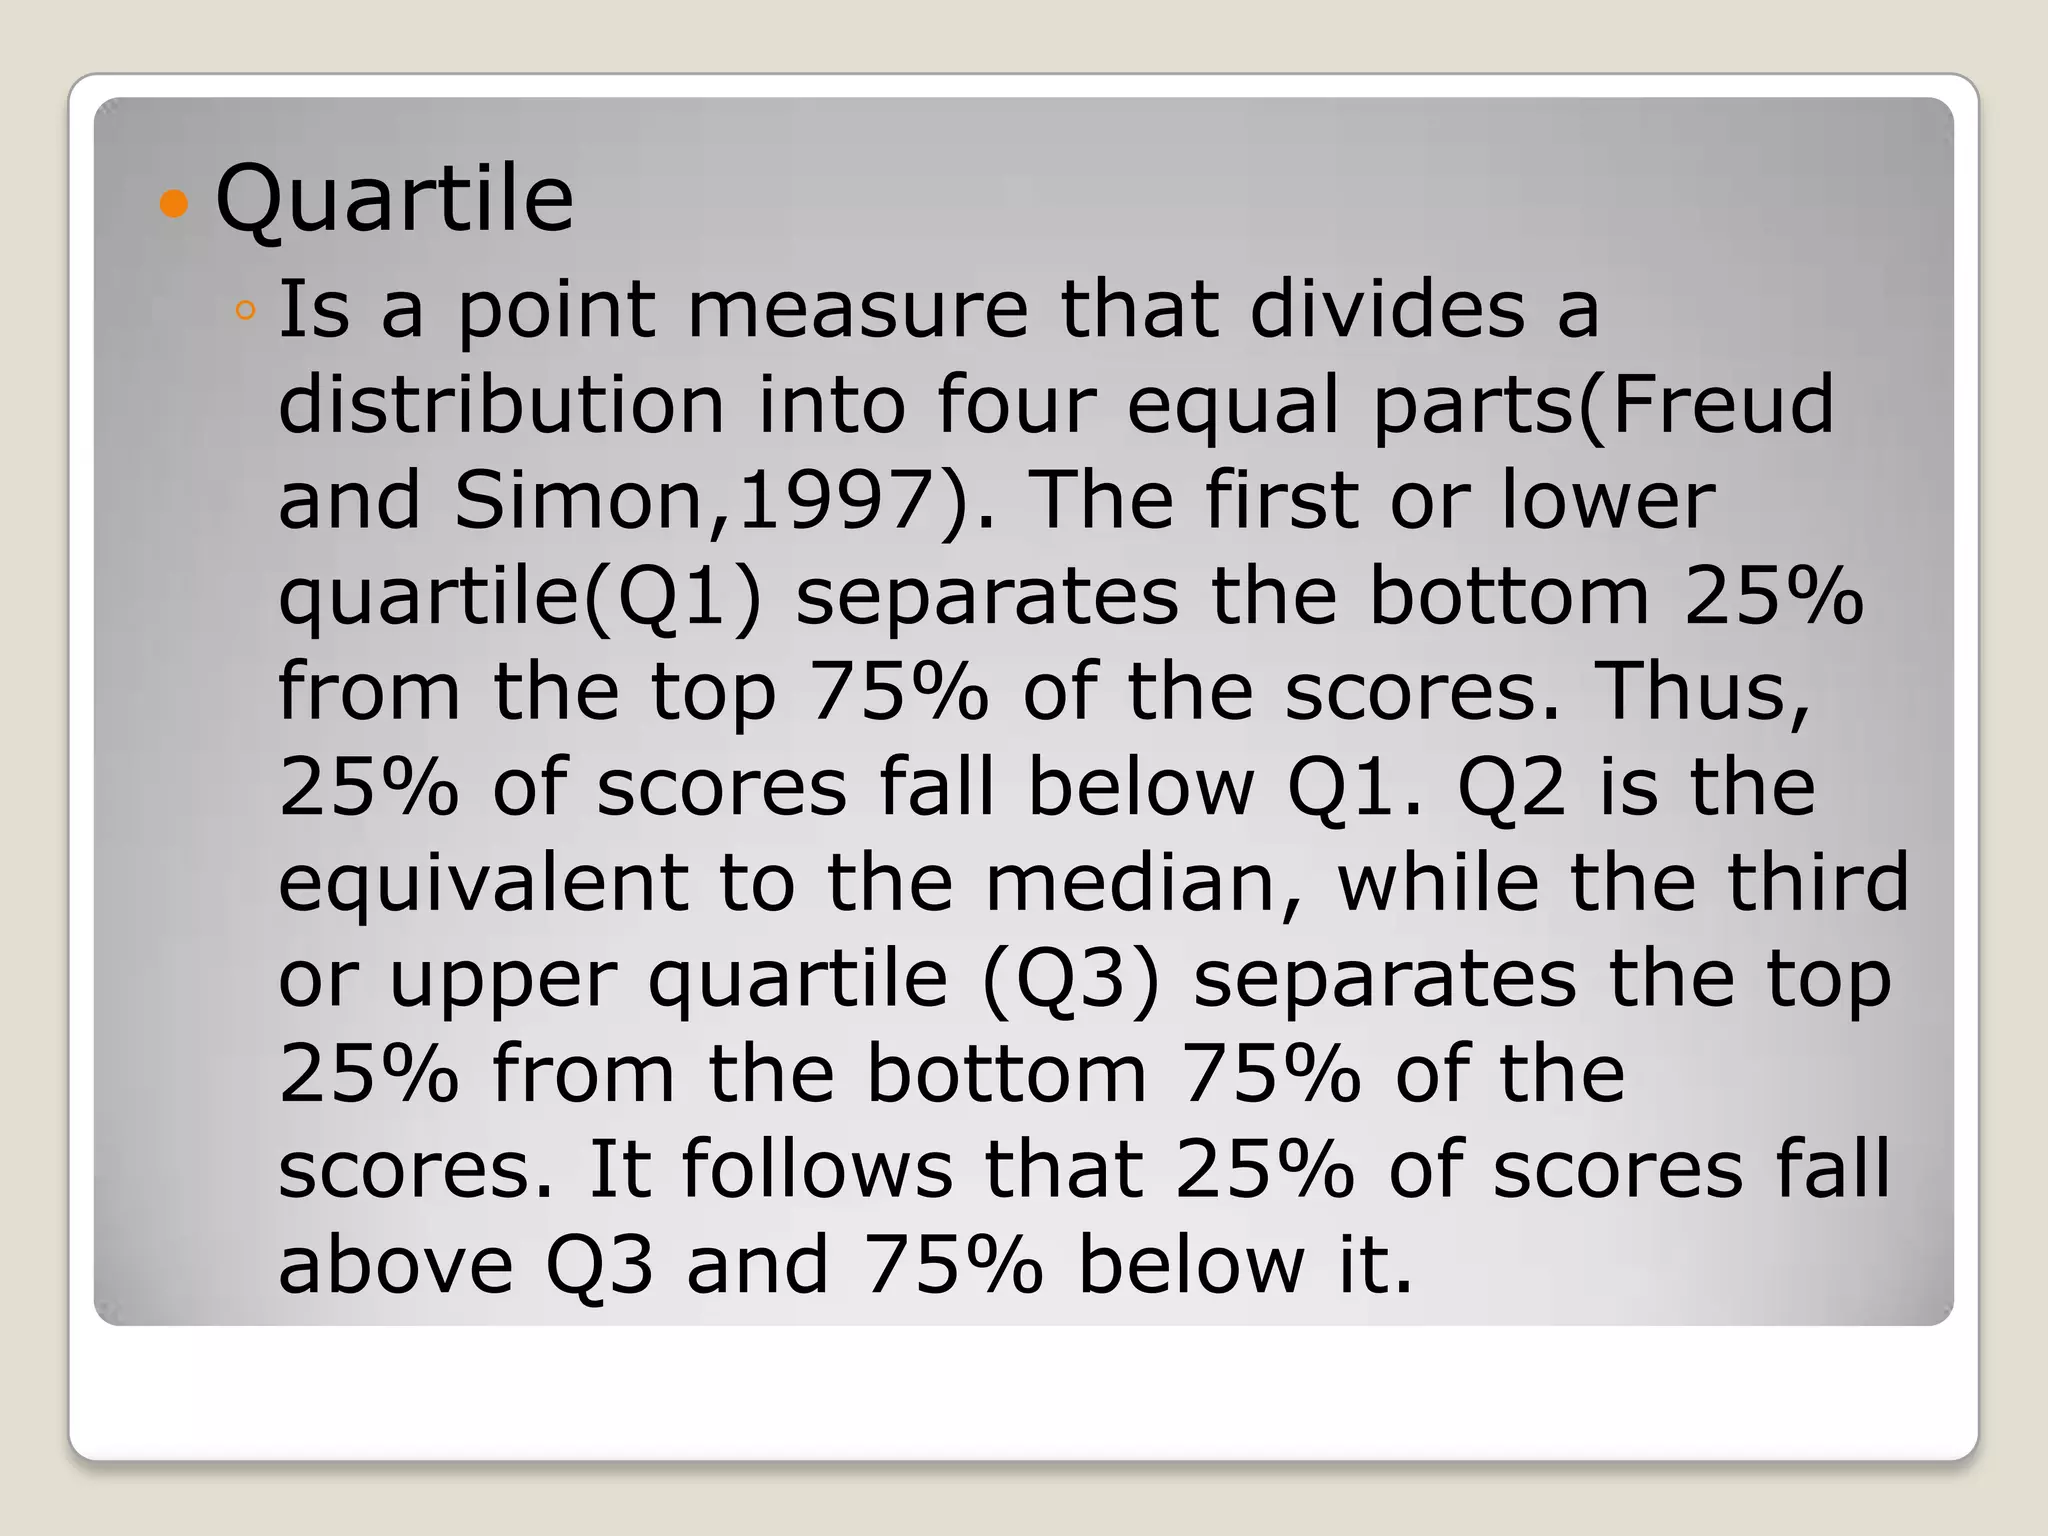
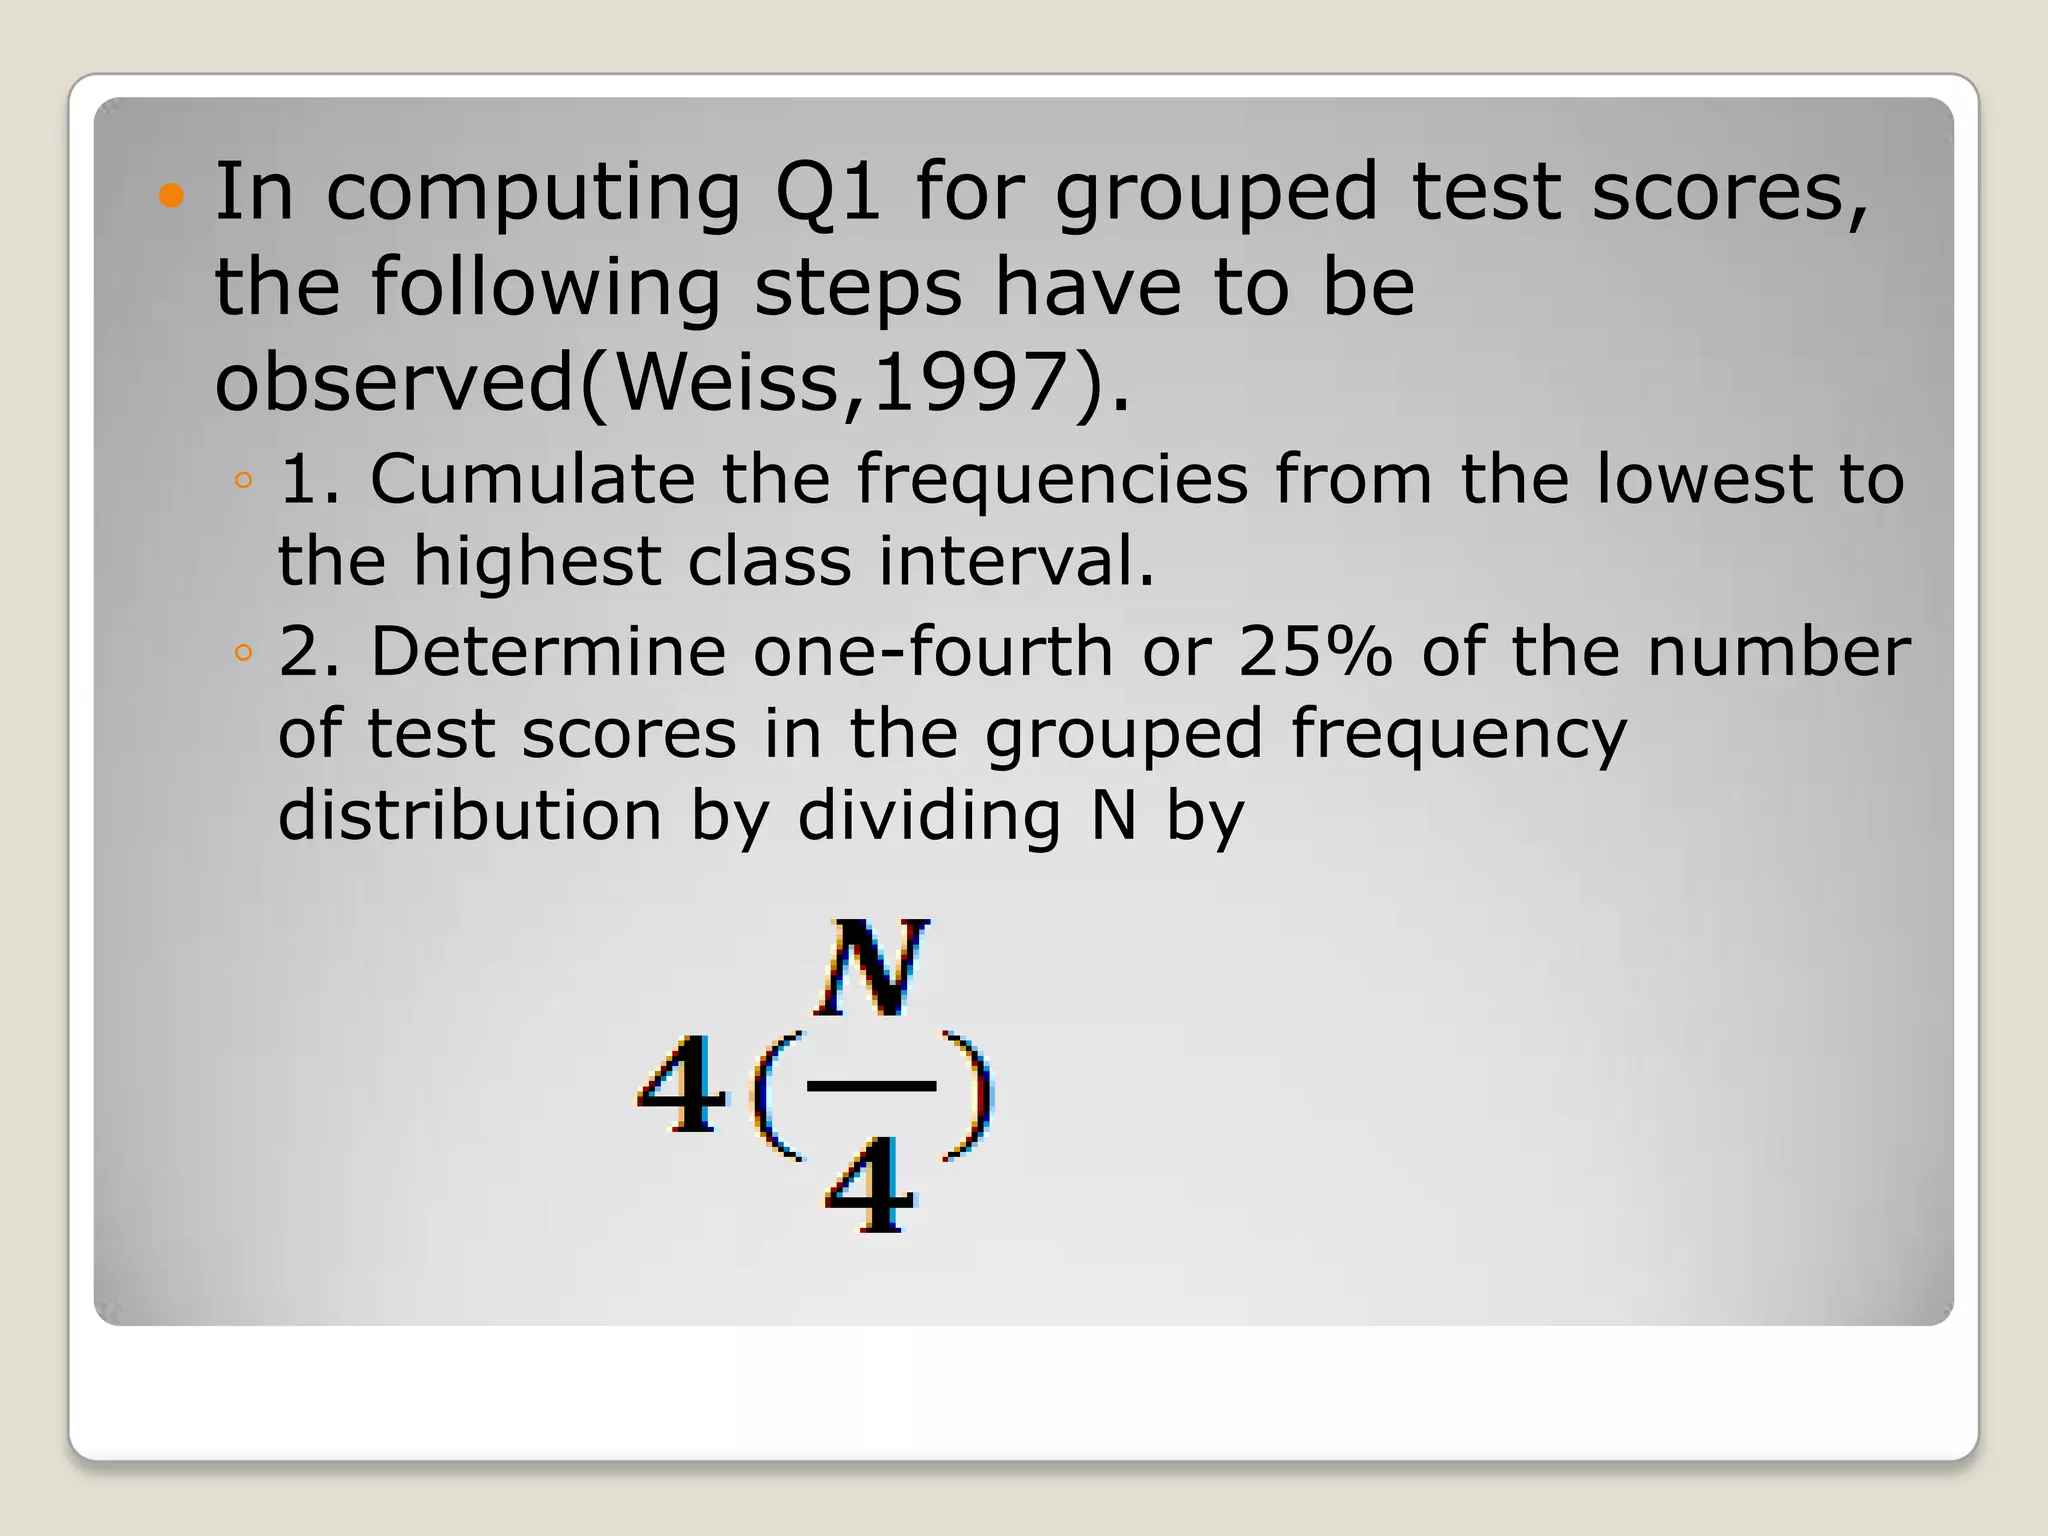
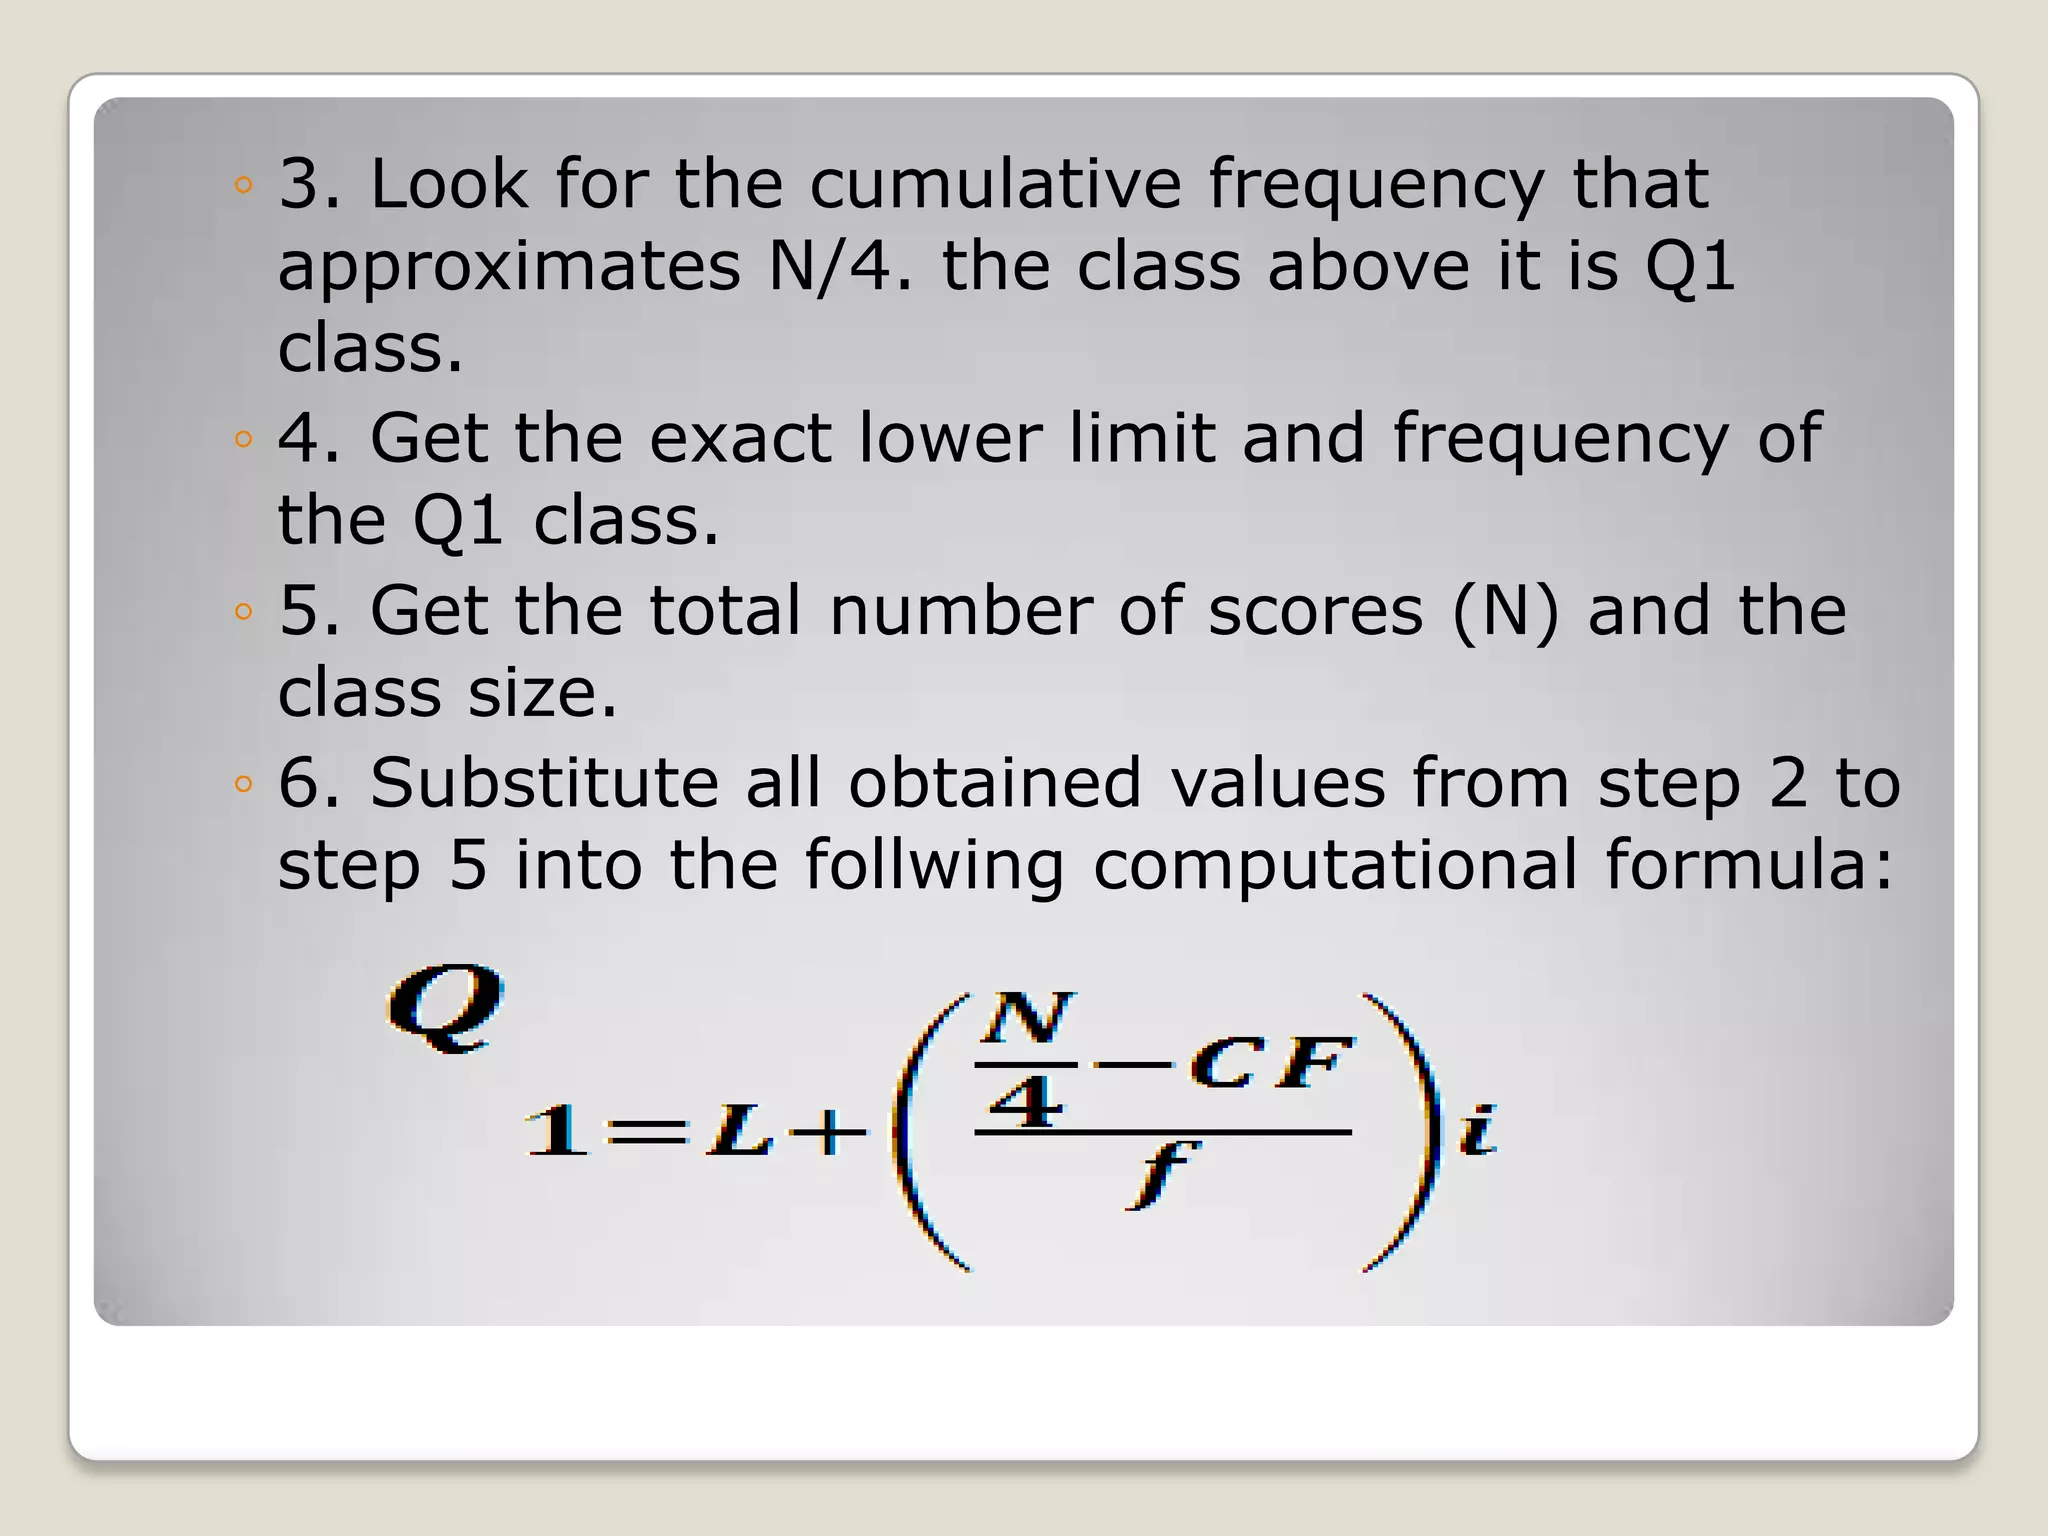
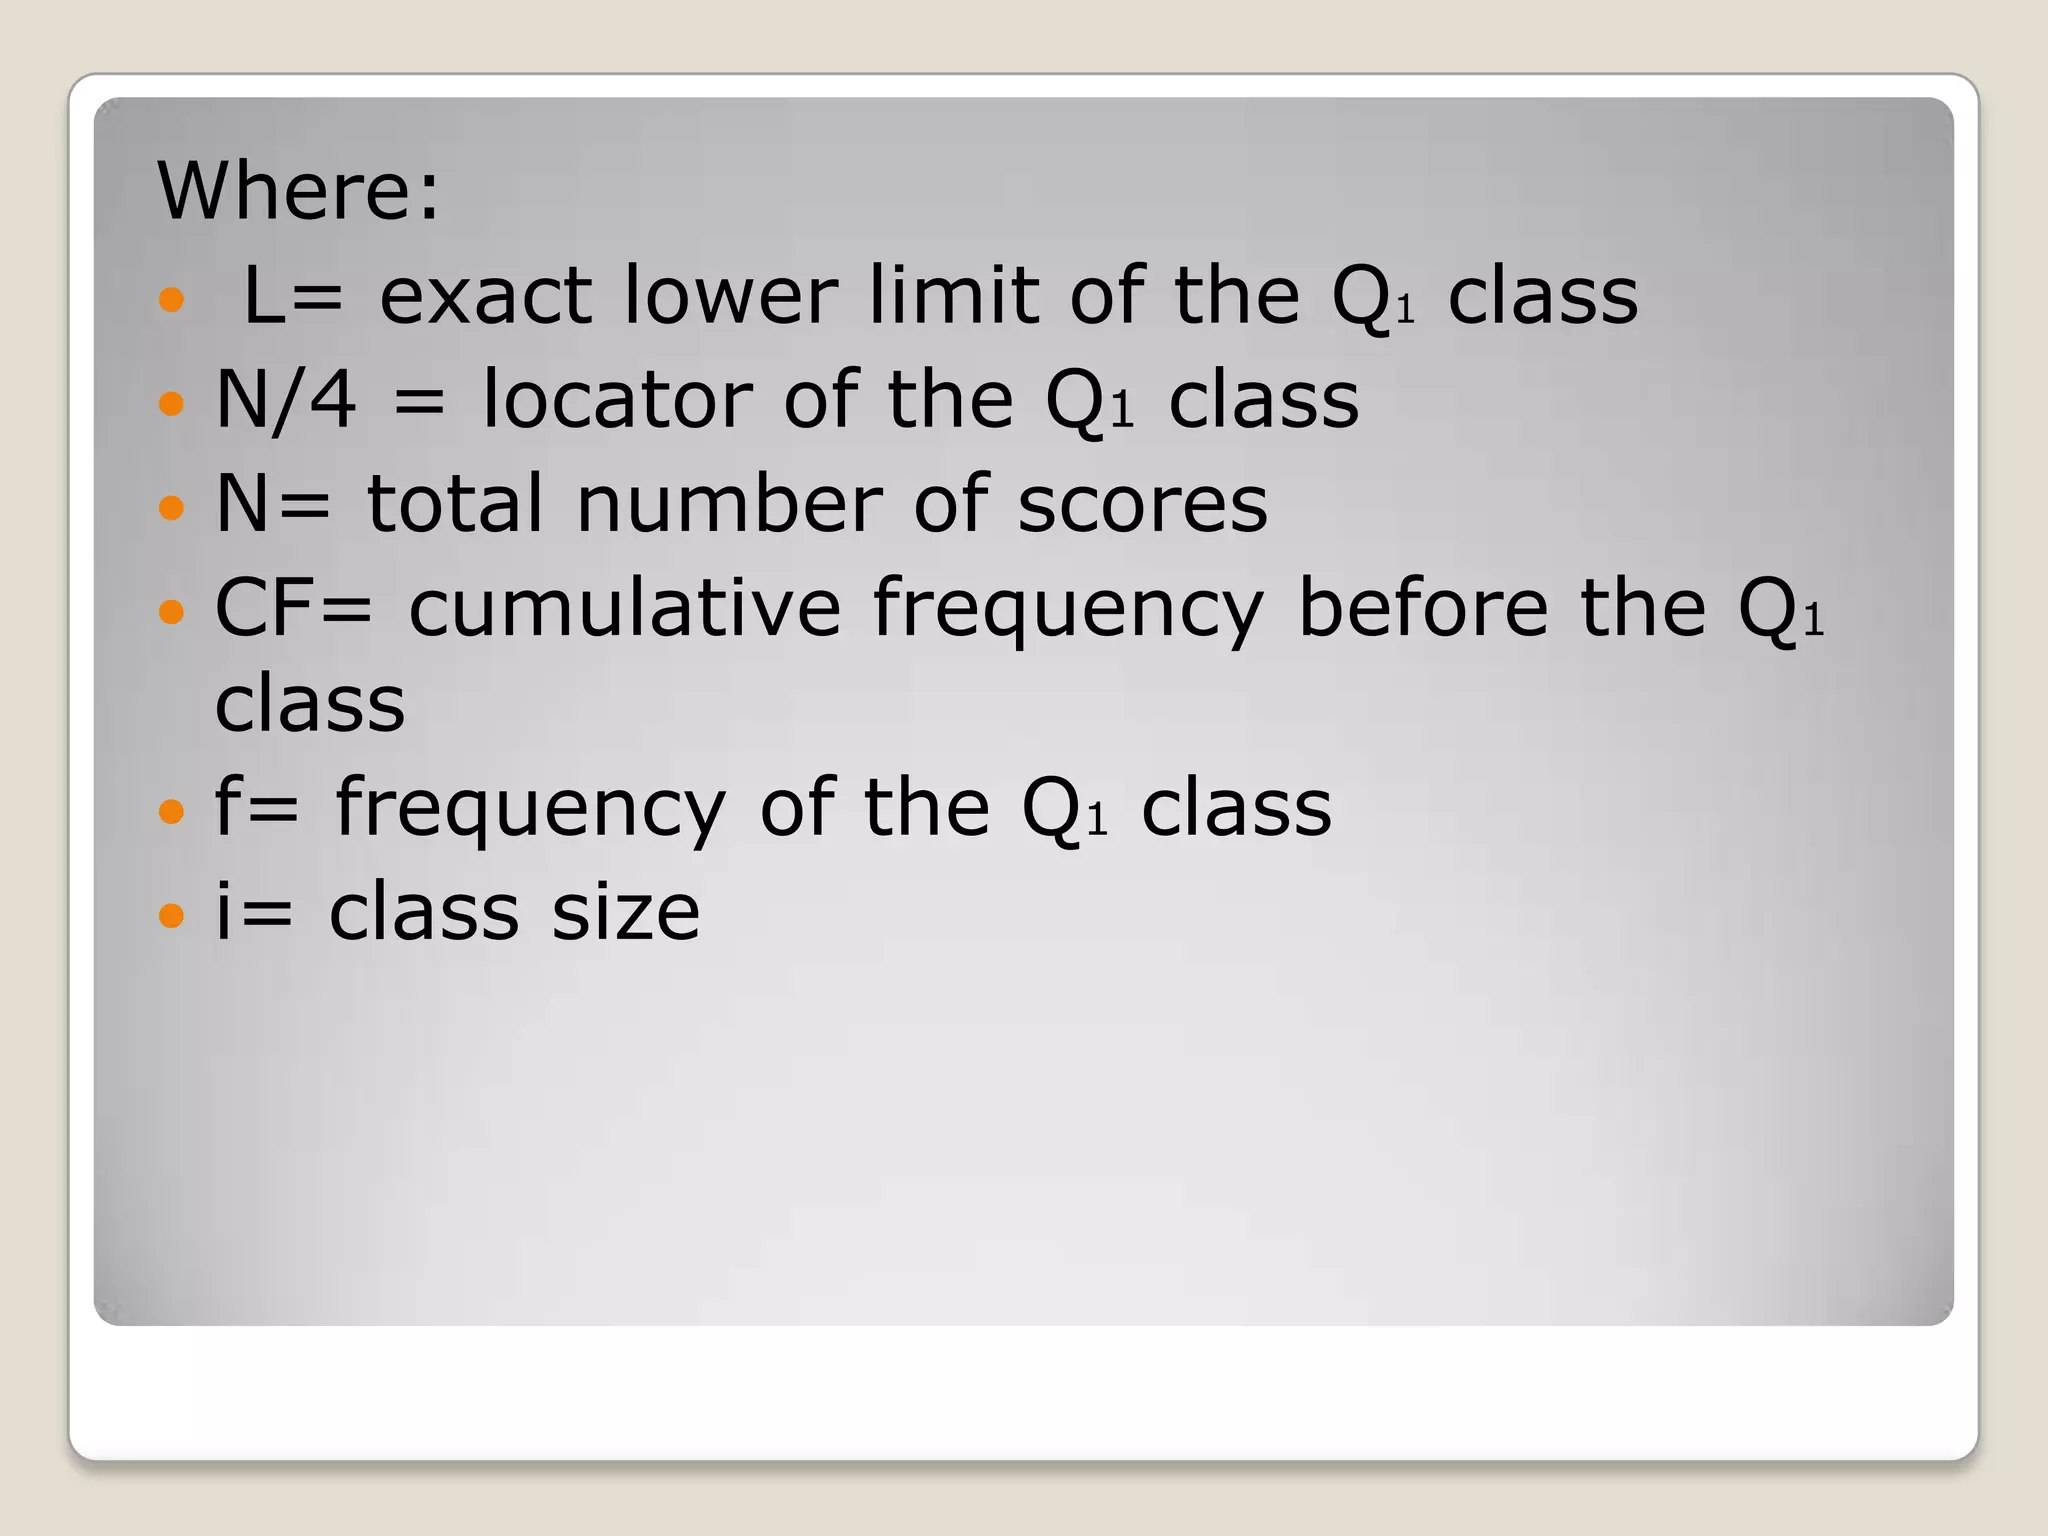
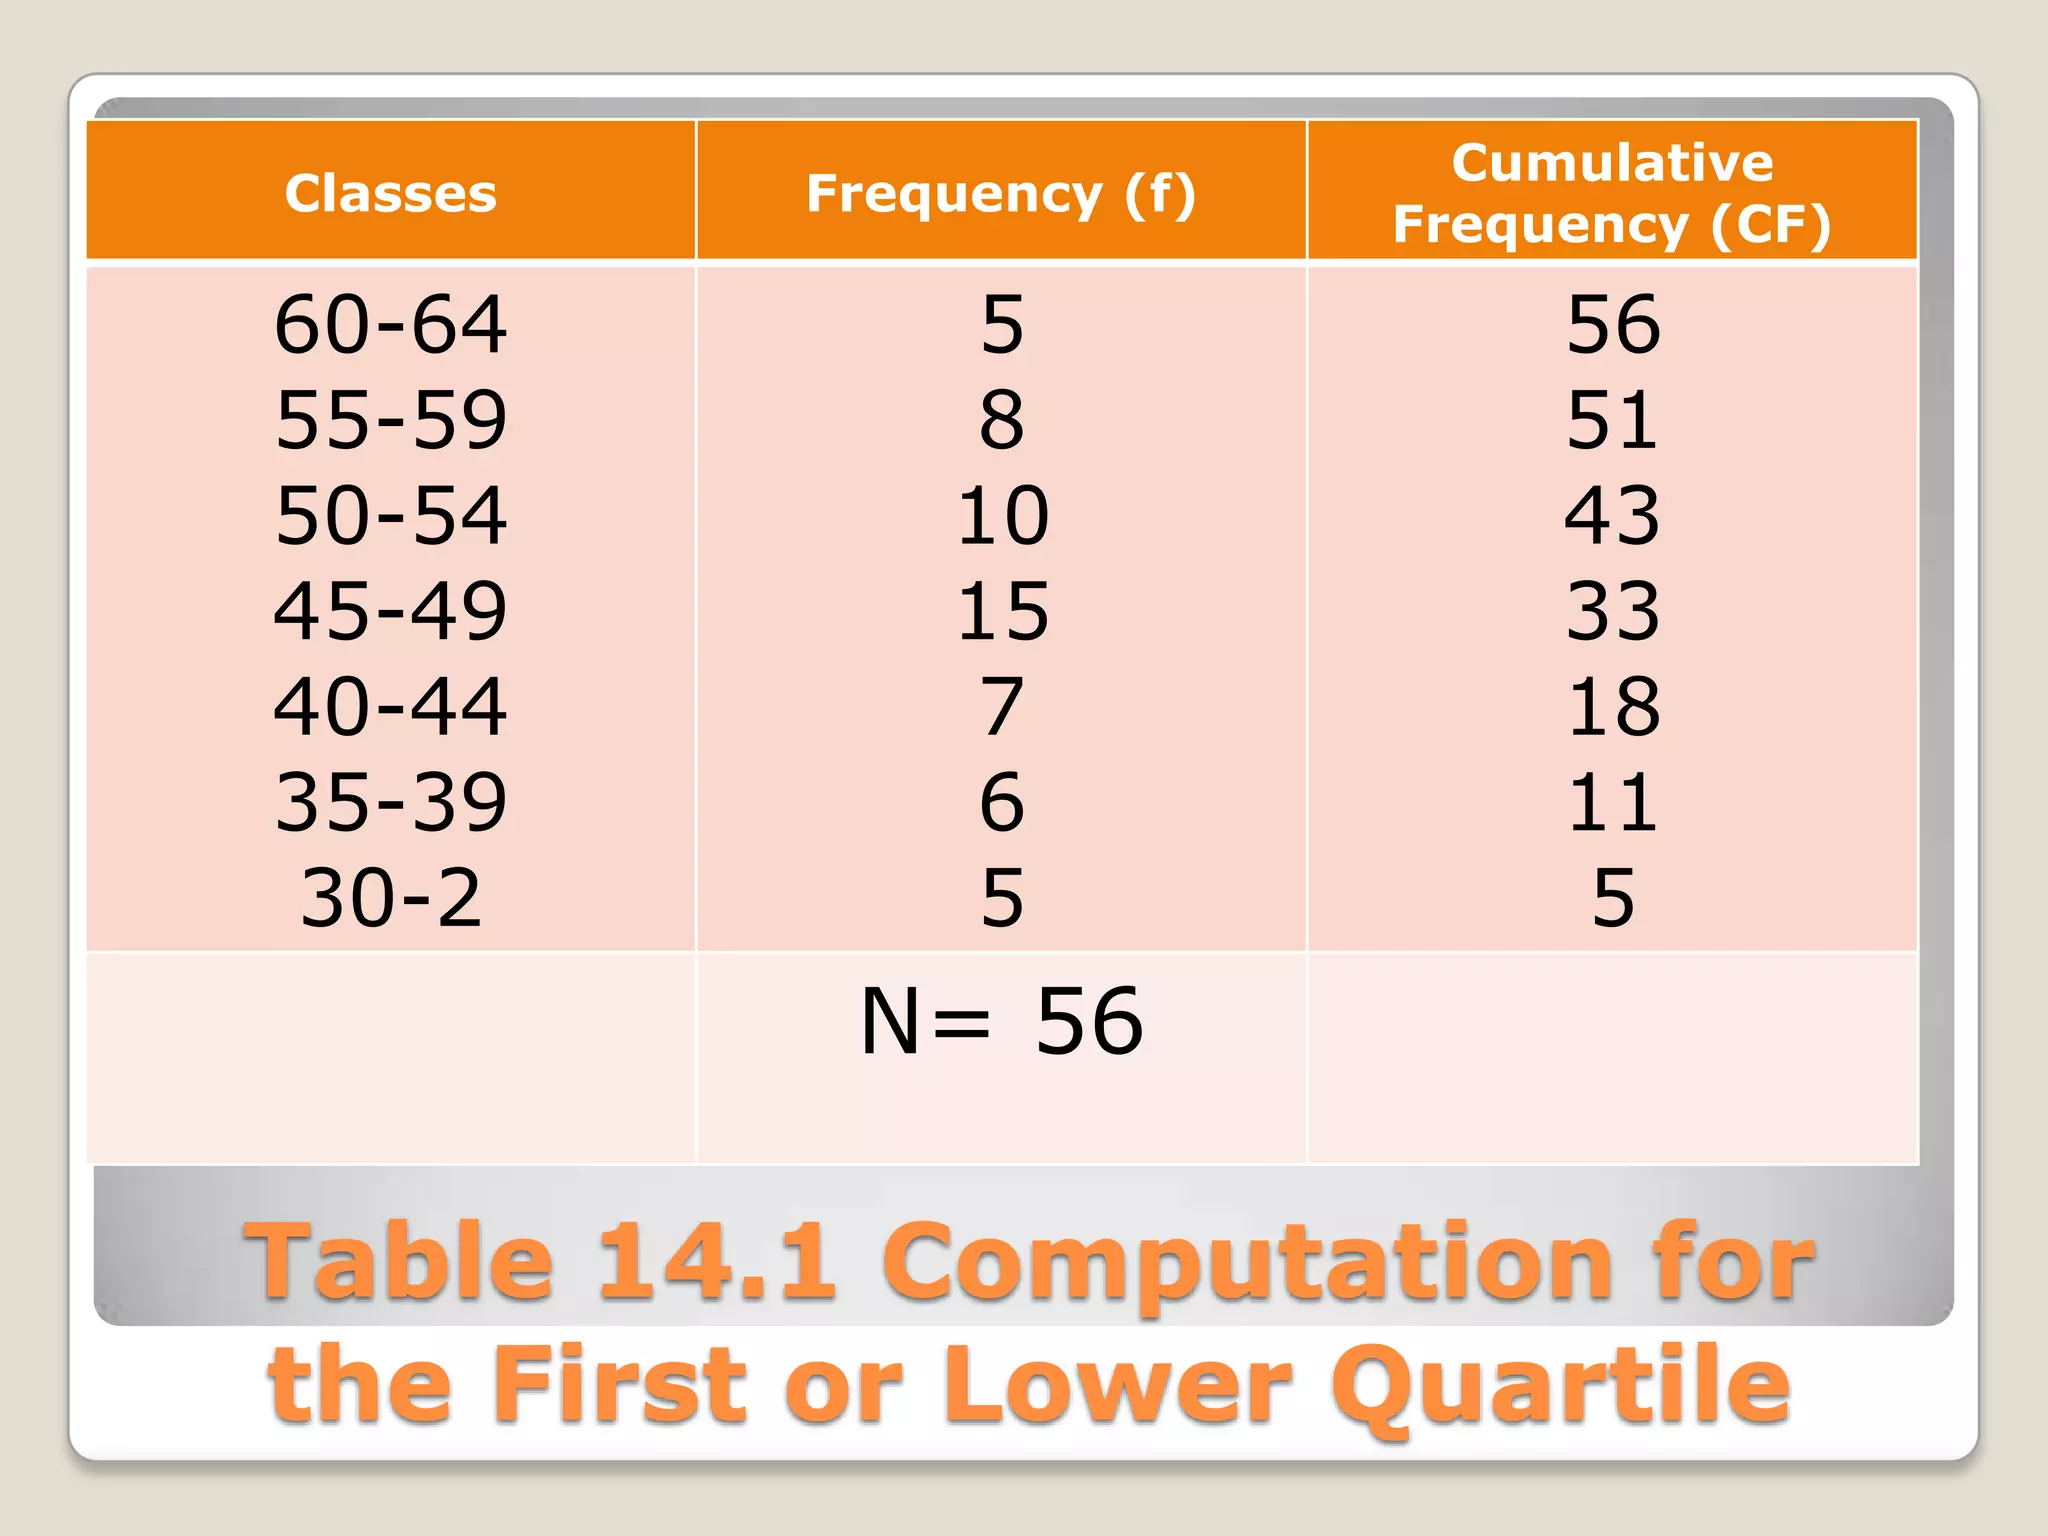
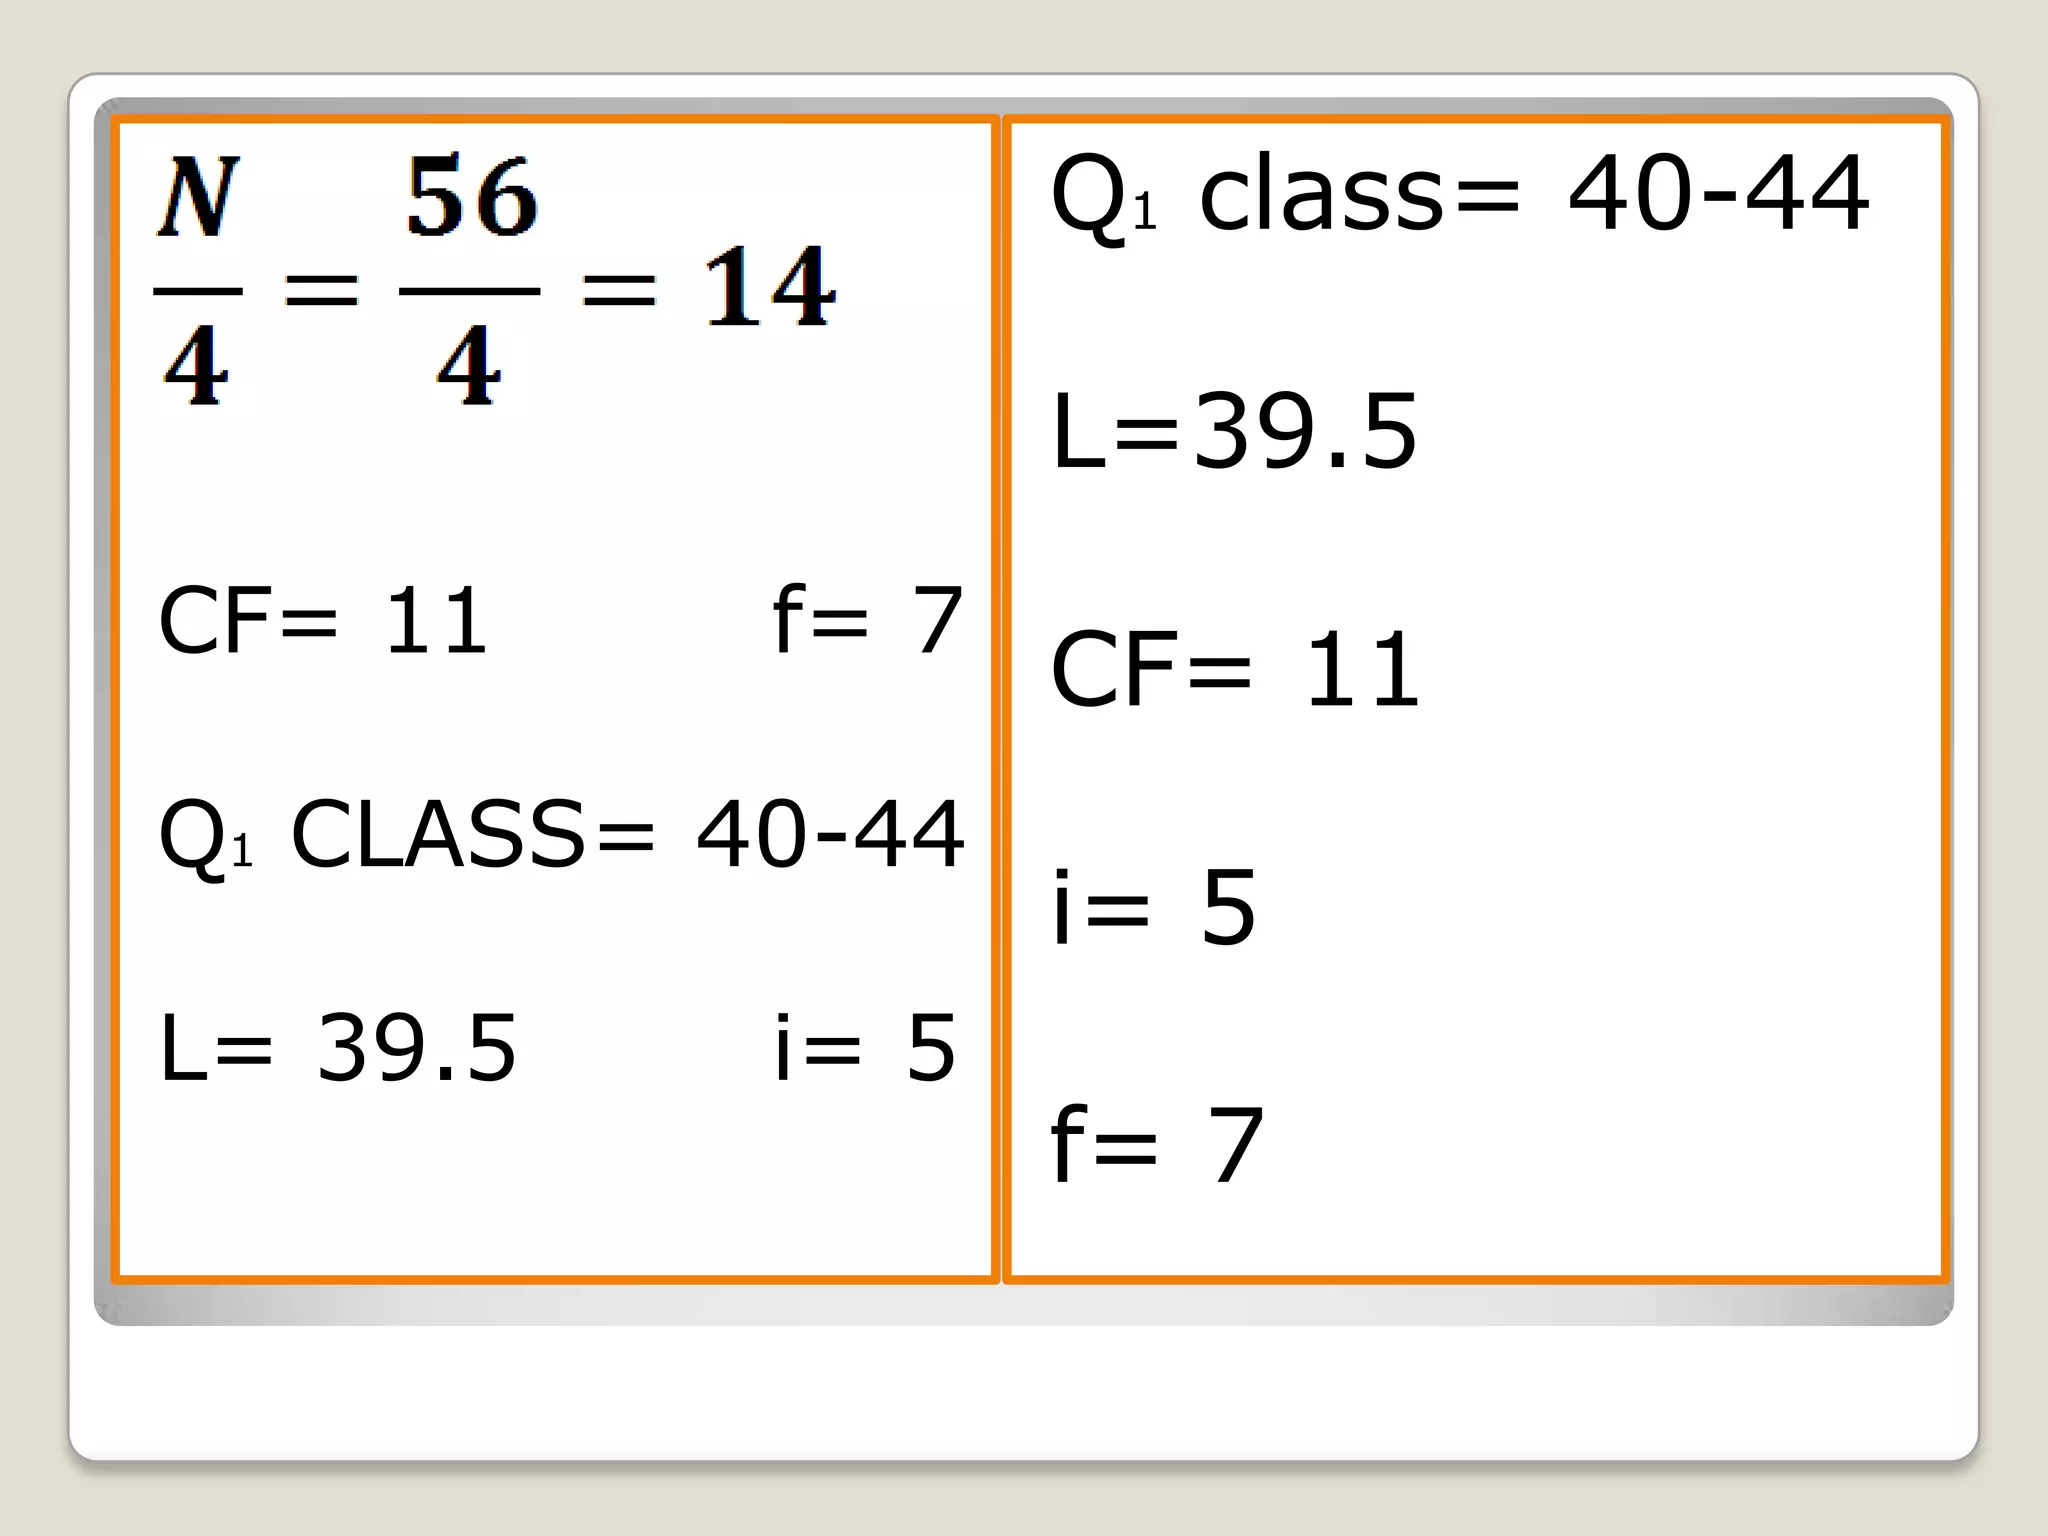
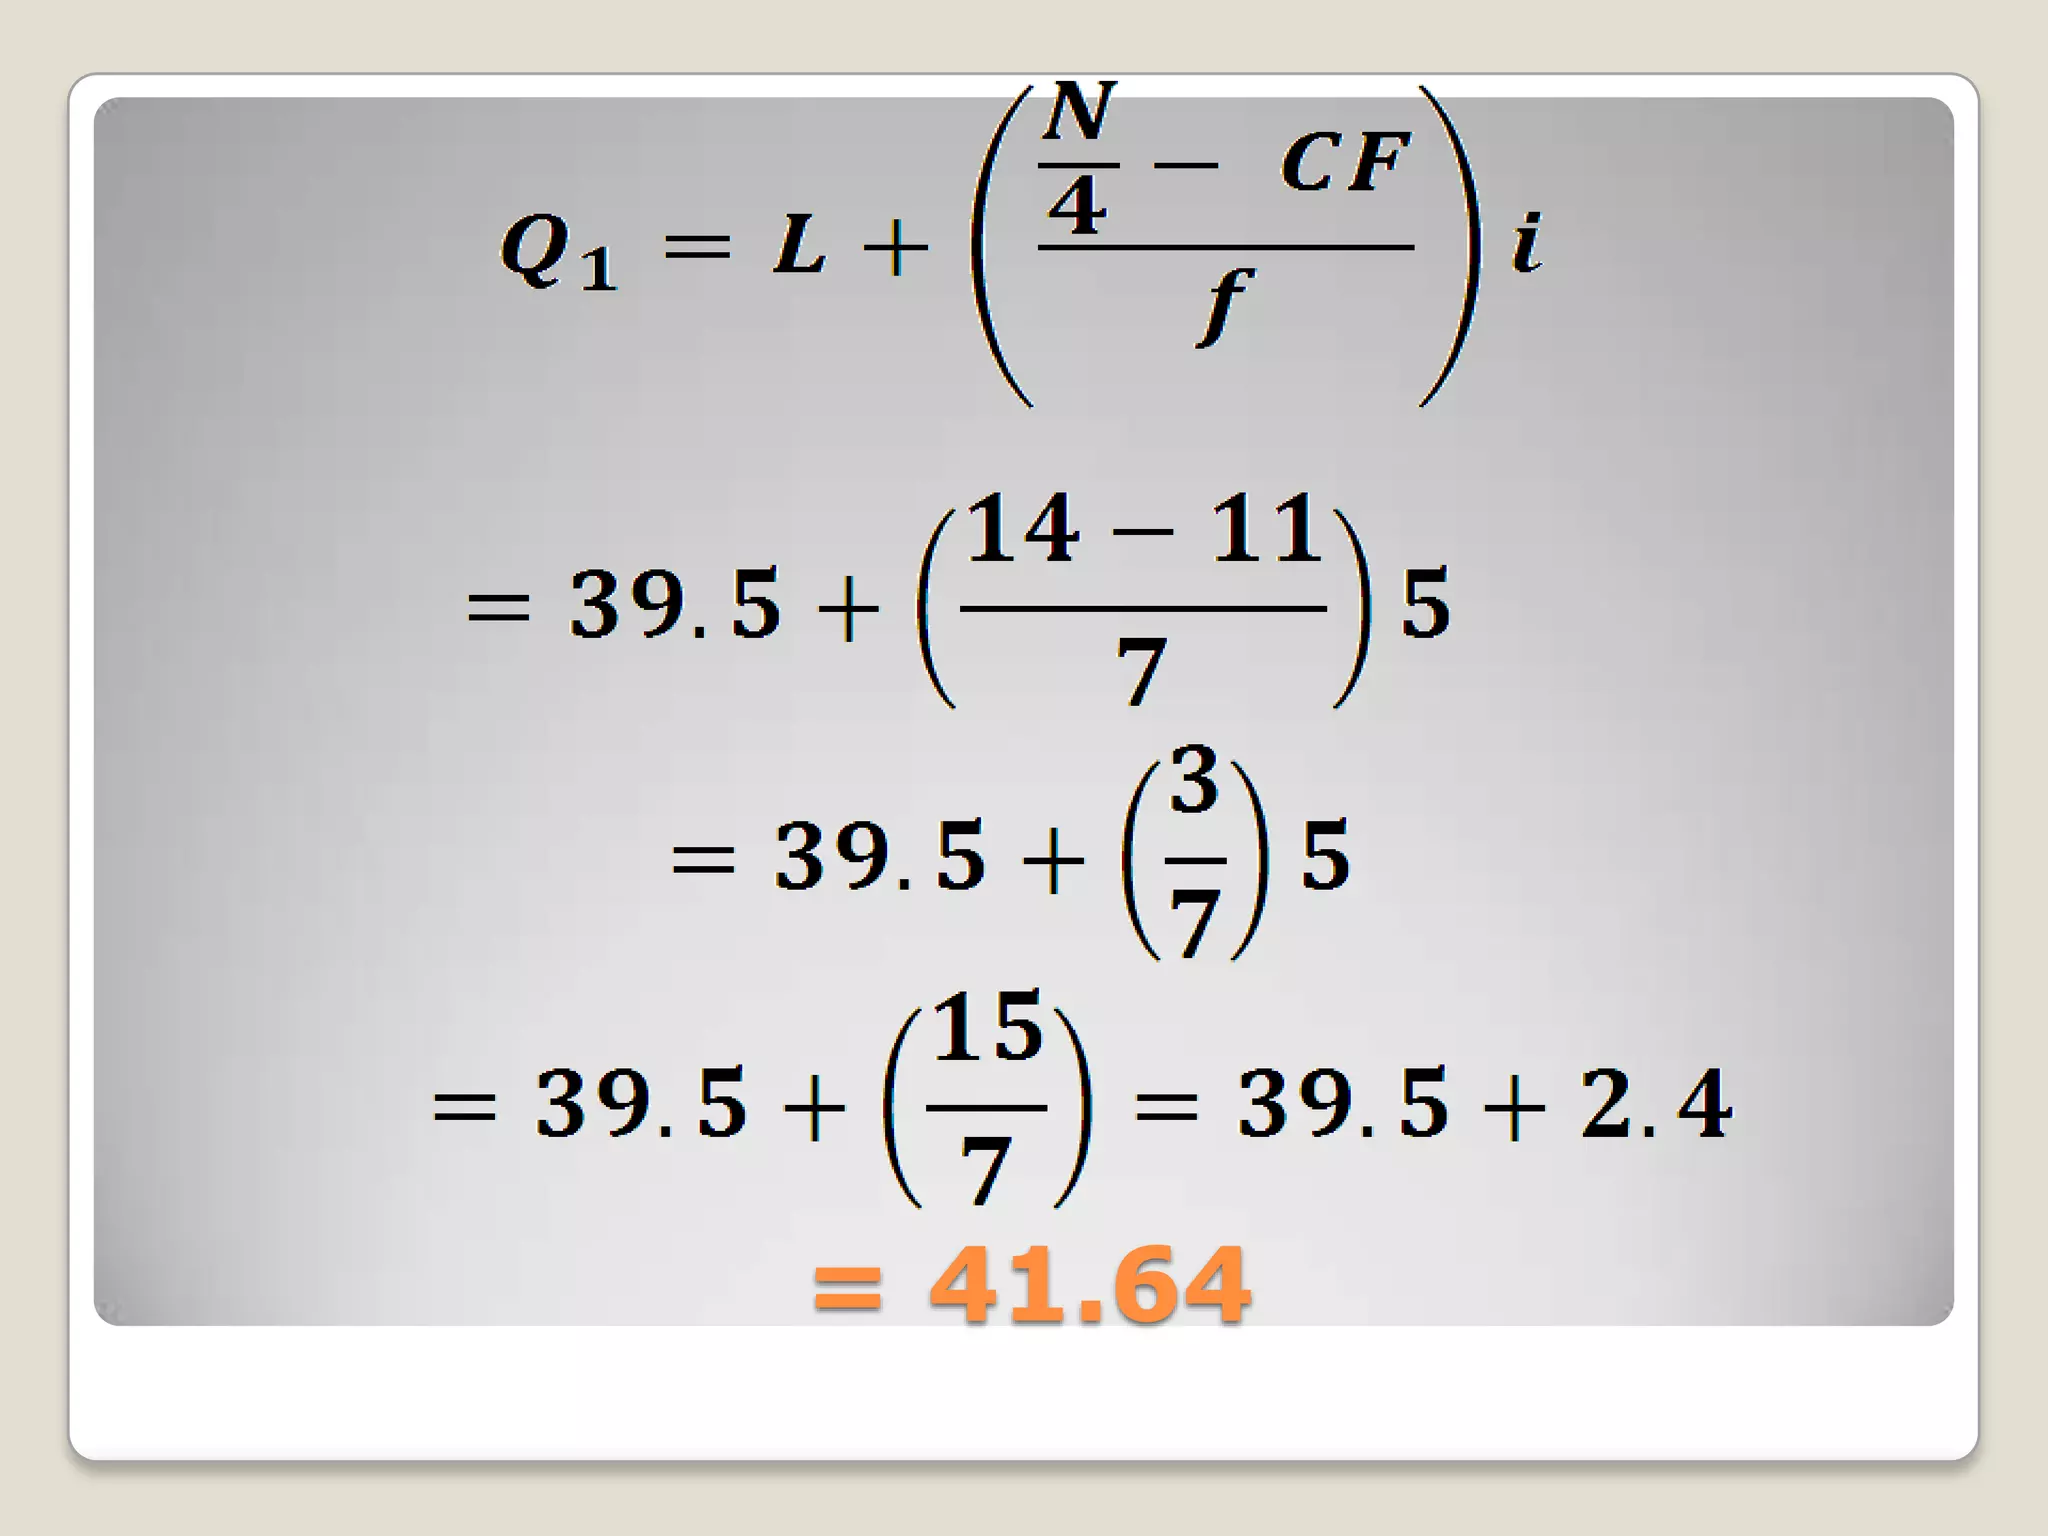
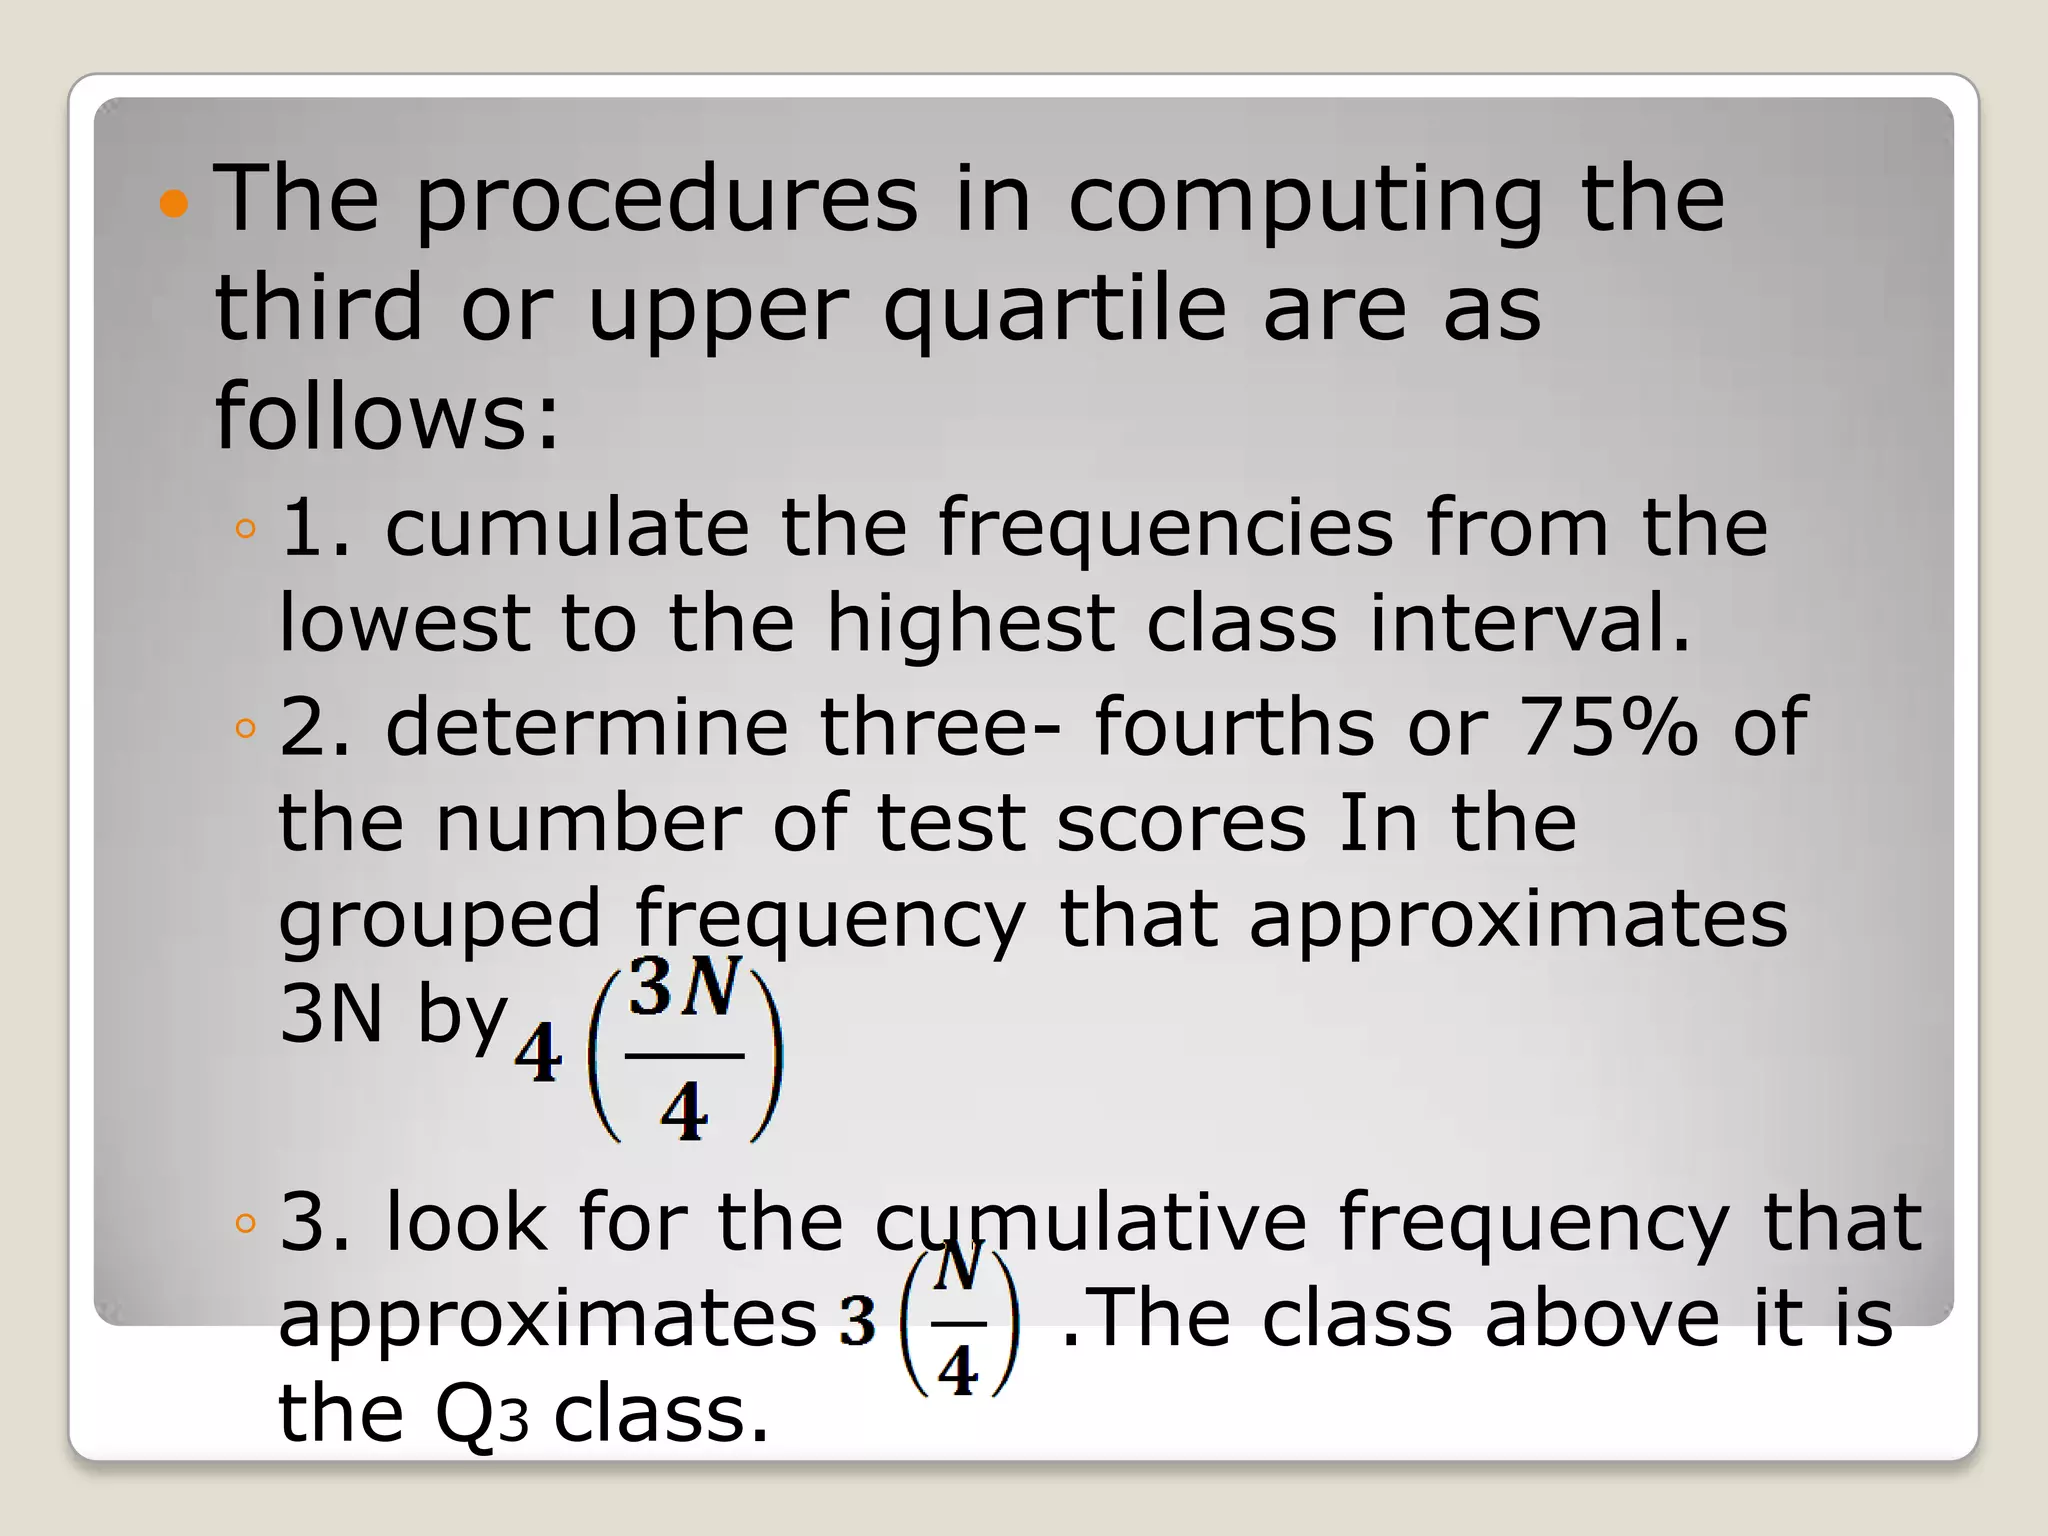
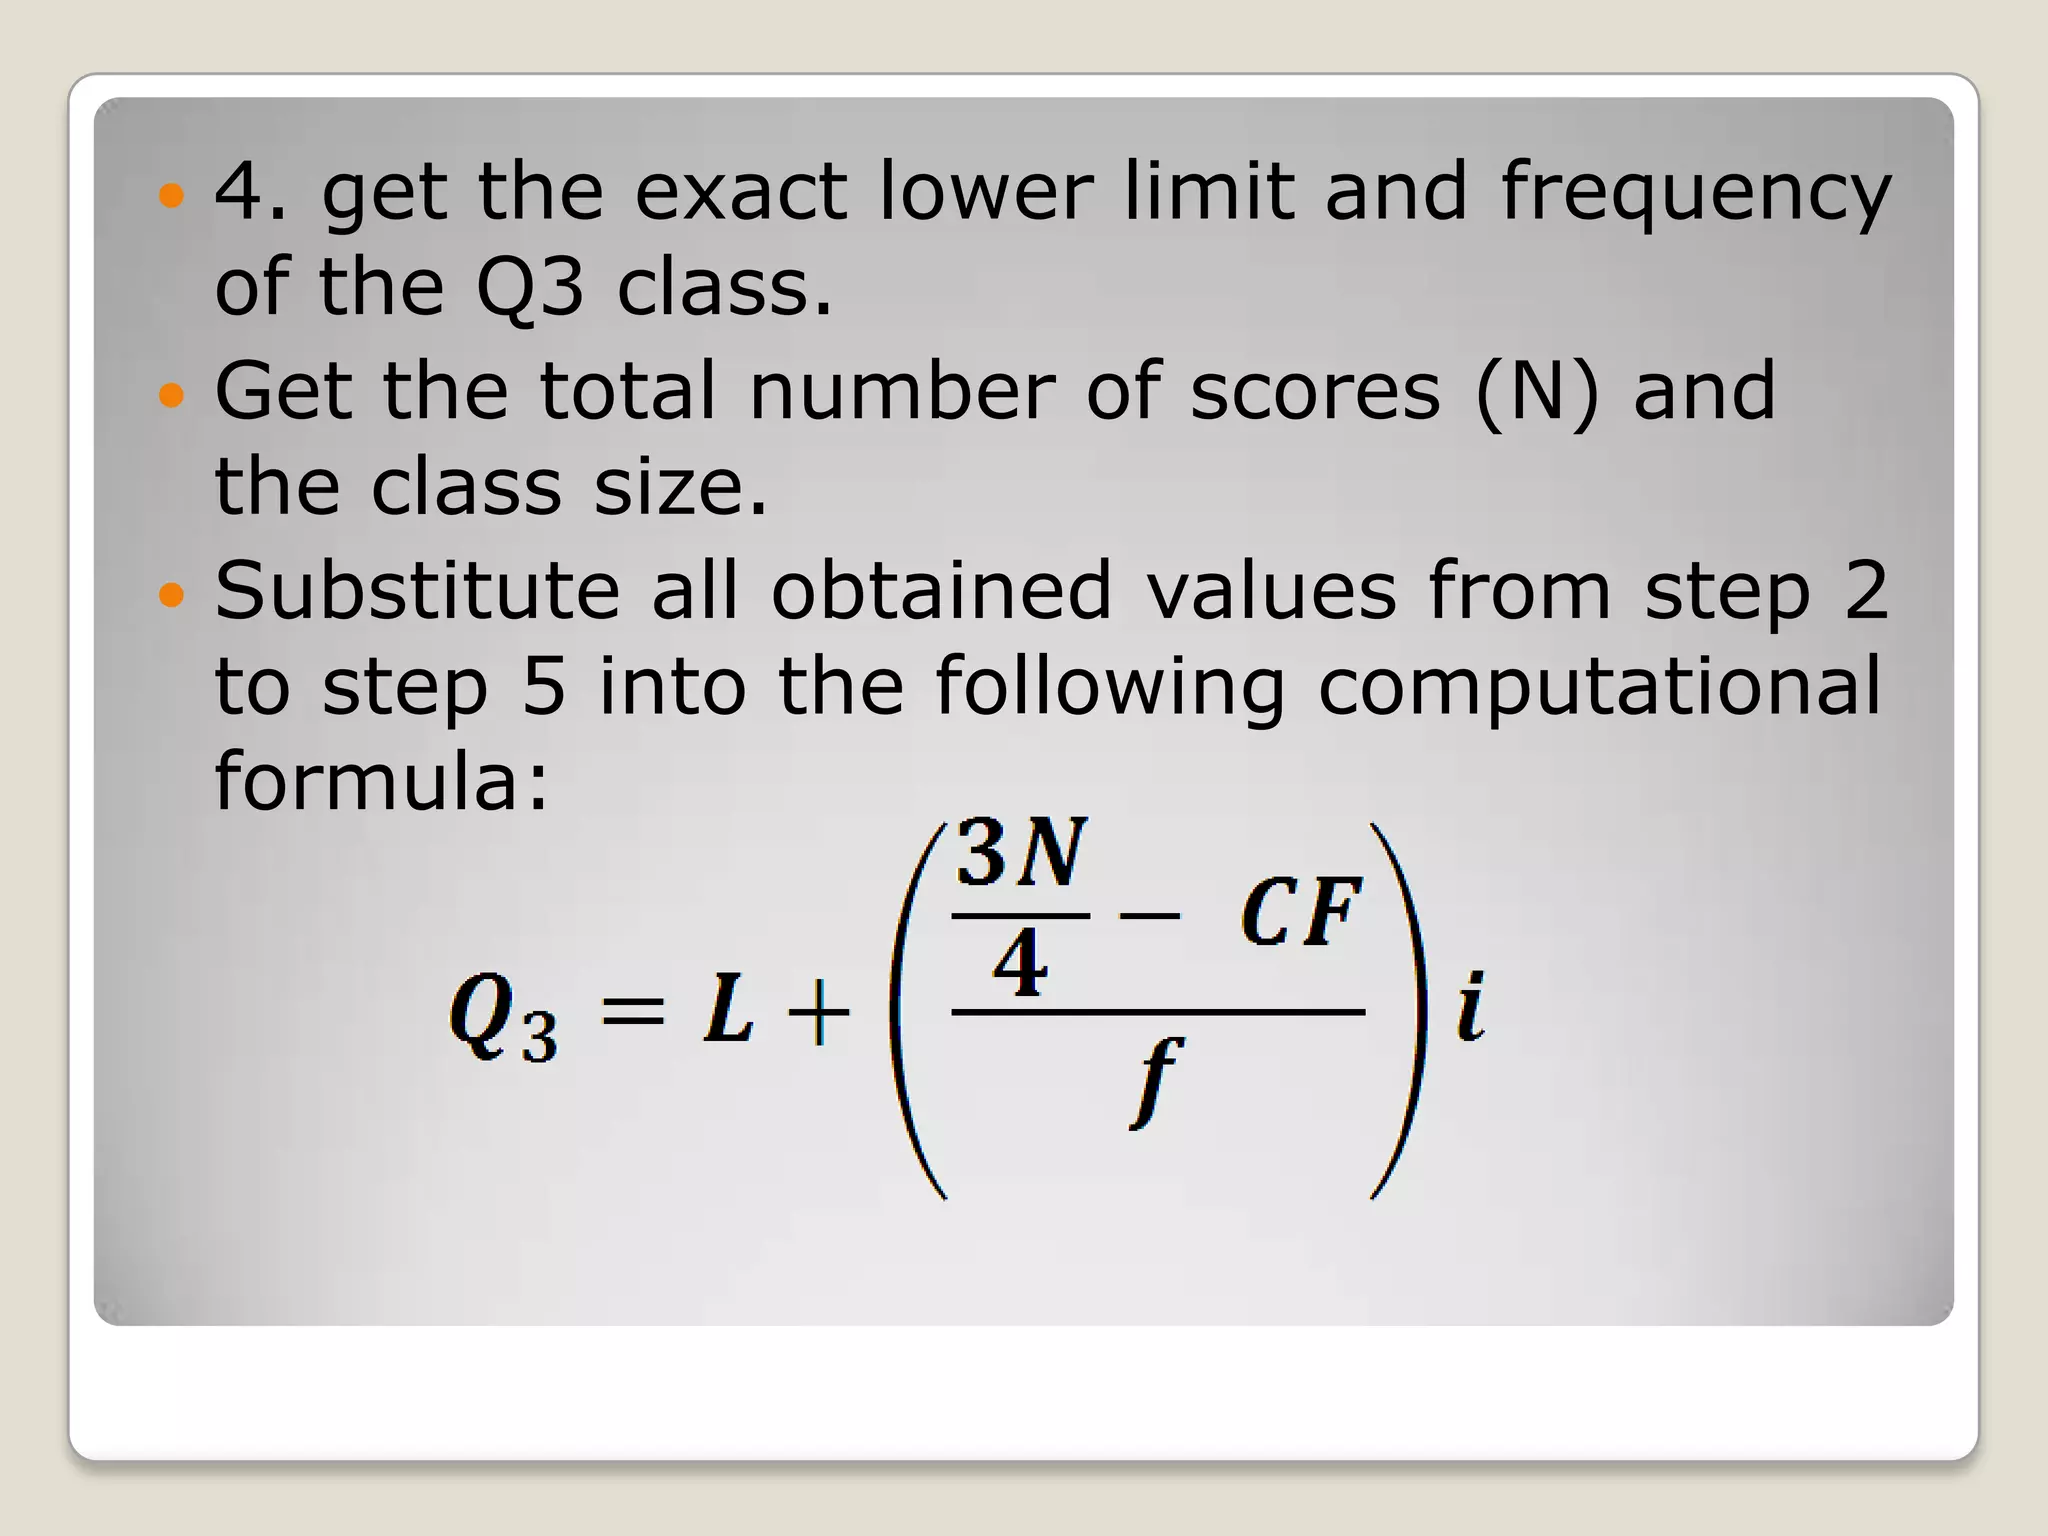
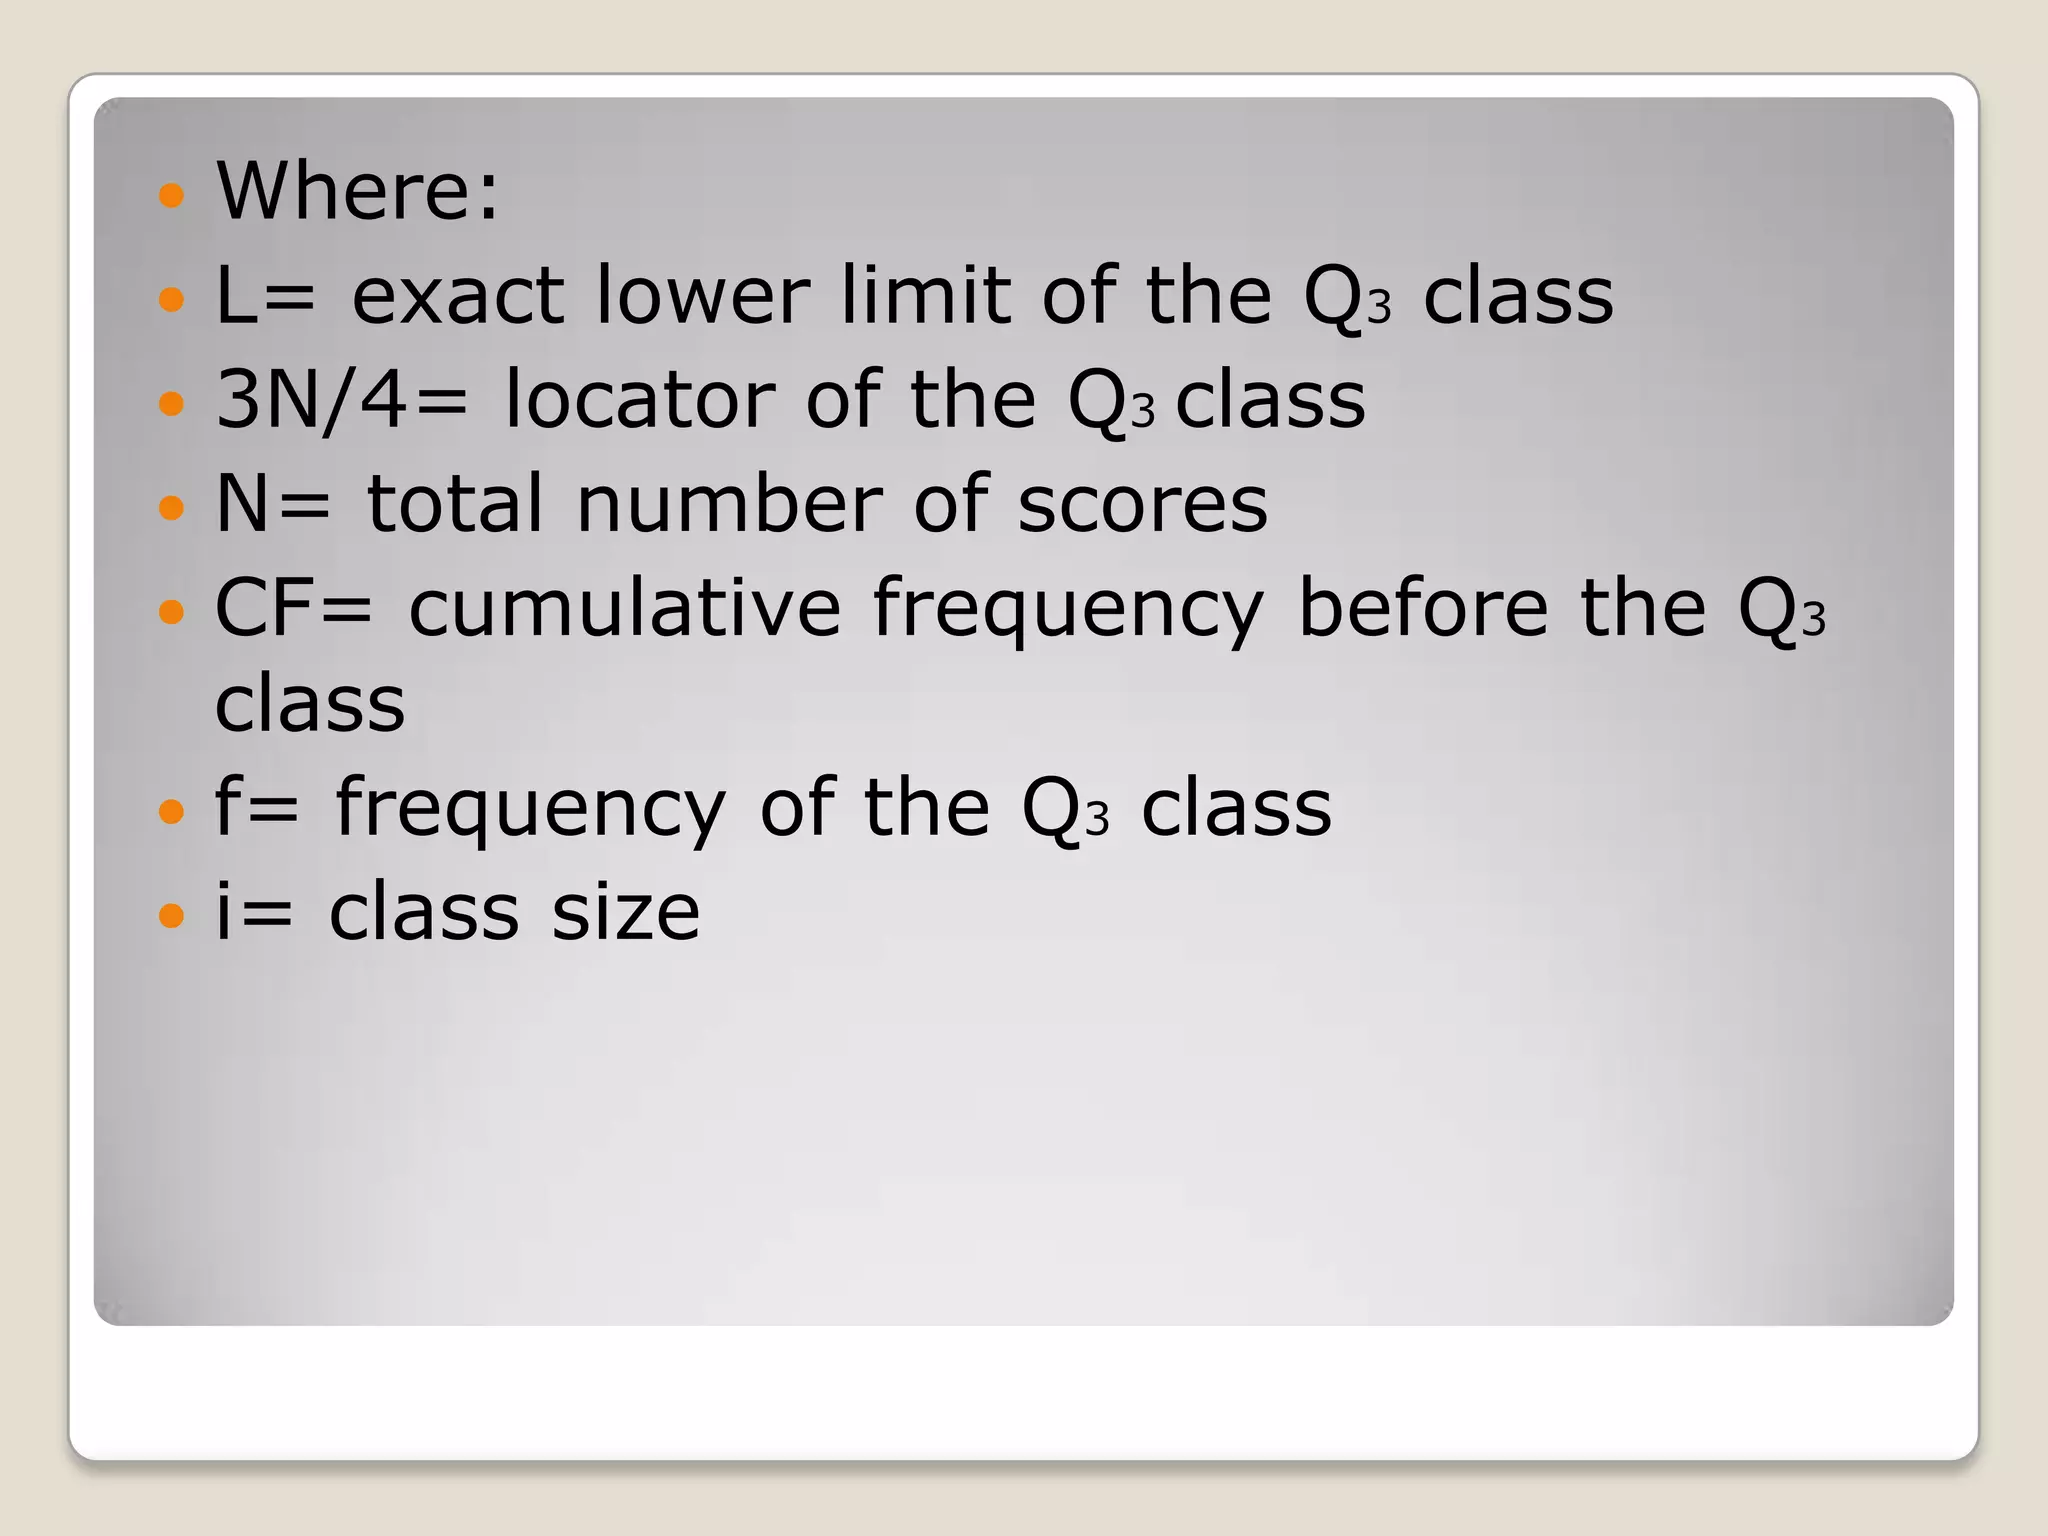
CHAPTER 14
SUMMARIZING TEST
SCORES: MEASURES OF
RELATIVE STANDING
There vare occasions when
teachers are interested in
describing the relative
position of student’s score
in relation to scores
obtained by the whole
class.
Measures of relative
standing- are descriptive
measures that locate the
relative position of a test
score in relation to the
other scores obtained by a
group of students or test
takers.
The following measures of
relative standing that shall be
explored in this chapter are
the following
◦Quartile
◦Decile
◦Percentile
◦Percentile rank
◦Z score
 Quartile
◦ Is a point measure that divides a
distribution into four equal parts(Freud
and Simon,1997). The first or lower
quartile(Q1) separates the bottom 25%
from the top 75% of the scores. Thus,
25% of scores fall below Q1. Q2 is the
equivalent to the median, while the third
or upper quartile (Q3) separates the top
25% from the bottom 75% of the
scores. It follows that 25% of scores fall
above Q3 and 75% below it.
 In computing Q1 for grouped test scores,
the following steps have to be
observed(Weiss,1997).
◦ 1. Cumulate the frequencies from the lowest to
the highest class interval.
◦ 2. Determine one-fourth or 25% of the number
of test scores in the grouped frequency
distribution by dividing N by
◦ 3. Look for the cumulative frequency that
approximates N/4. the class above it is Q1
class.
◦ 4. Get the exact lower limit and frequency of
the Q1 class.
◦ 5. Get the total number of scores (N) and the
class size.
◦ 6. Substitute all obtained values from step 2 to
step 5 into the follwing computational formula:
Where:
 L= exact lower limit of the Q1 class
 N/4 = locator of the Q1 class
 N= total number of scores
 CF= cumulative frequency before the Q1
class
 f= frequency of the Q1 class
 i= class size
Table 14.1 Computation for
the First or Lower Quartile
Classes Frequency (f)
Cumulative
Frequency (CF)
60-64
55-59
50-54
45-49
40-44
35-39
30-2
5
8
10
15
7
6
5
56
51
43
33
18
11
5
N= 56
CF= 11 f= 7
Q1 CLASS= 40-44
L= 39.5 i= 5
Q1 class= 40-44
L=39.5
CF= 11
i= 5
f= 7
= 41.64
 The procedures in computing the
third or upper quartile are as
follows:
◦ 1. cumulate the frequencies from the
lowest to the highest class interval.
◦ 2. determine three- fourths or 75% of
the number of test scores In the
grouped frequency that approximates
3N by
◦ 3. look for the cumulative frequency that
approximates .The class above it is
the Q3 class.
 4. get the exact lower limit and frequency
of the Q3 class.
 Get the total number of scores (N) and
the class size.
 Substitute all obtained values from step 2
to step 5 into the following computational
formula:
 Where:
 L= exact lower limit of the Q3 class
 3N/4= locator of the Q3 class
 N= total number of scores
 CF= cumulative frequency before the Q3
class
 f= frequency of the Q3 class
 i= class size

Chapter 14

  • 1.
    CHAPTER 14 SUMMARIZING TEST SCORES:MEASURES OF RELATIVE STANDING
  • 2.
    There vare occasionswhen teachers are interested in describing the relative position of student’s score in relation to scores obtained by the whole class.
  • 3.
    Measures of relative standing-are descriptive measures that locate the relative position of a test score in relation to the other scores obtained by a group of students or test takers.
  • 4.
    The following measuresof relative standing that shall be explored in this chapter are the following ◦Quartile ◦Decile ◦Percentile ◦Percentile rank ◦Z score
  • 5.
     Quartile ◦ Isa point measure that divides a distribution into four equal parts(Freud and Simon,1997). The first or lower quartile(Q1) separates the bottom 25% from the top 75% of the scores. Thus, 25% of scores fall below Q1. Q2 is the equivalent to the median, while the third or upper quartile (Q3) separates the top 25% from the bottom 75% of the scores. It follows that 25% of scores fall above Q3 and 75% below it.
  • 6.
     In computingQ1 for grouped test scores, the following steps have to be observed(Weiss,1997). ◦ 1. Cumulate the frequencies from the lowest to the highest class interval. ◦ 2. Determine one-fourth or 25% of the number of test scores in the grouped frequency distribution by dividing N by
  • 7.
    ◦ 3. Lookfor the cumulative frequency that approximates N/4. the class above it is Q1 class. ◦ 4. Get the exact lower limit and frequency of the Q1 class. ◦ 5. Get the total number of scores (N) and the class size. ◦ 6. Substitute all obtained values from step 2 to step 5 into the follwing computational formula:
  • 8.
    Where:  L= exactlower limit of the Q1 class  N/4 = locator of the Q1 class  N= total number of scores  CF= cumulative frequency before the Q1 class  f= frequency of the Q1 class  i= class size
  • 9.
    Table 14.1 Computationfor the First or Lower Quartile Classes Frequency (f) Cumulative Frequency (CF) 60-64 55-59 50-54 45-49 40-44 35-39 30-2 5 8 10 15 7 6 5 56 51 43 33 18 11 5 N= 56
  • 10.
    CF= 11 f=7 Q1 CLASS= 40-44 L= 39.5 i= 5 Q1 class= 40-44 L=39.5 CF= 11 i= 5 f= 7
  • 11.
  • 12.
     The proceduresin computing the third or upper quartile are as follows: ◦ 1. cumulate the frequencies from the lowest to the highest class interval. ◦ 2. determine three- fourths or 75% of the number of test scores In the grouped frequency that approximates 3N by ◦ 3. look for the cumulative frequency that approximates .The class above it is the Q3 class.
  • 13.
     4. getthe exact lower limit and frequency of the Q3 class.  Get the total number of scores (N) and the class size.  Substitute all obtained values from step 2 to step 5 into the following computational formula:
  • 14.
     Where:  L=exact lower limit of the Q3 class  3N/4= locator of the Q3 class  N= total number of scores  CF= cumulative frequency before the Q3 class  f= frequency of the Q3 class  i= class size