Downloaded 164 times
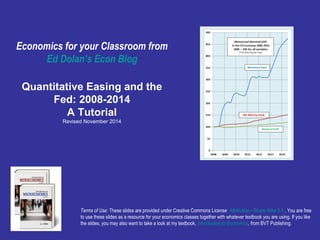

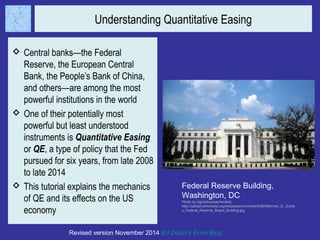
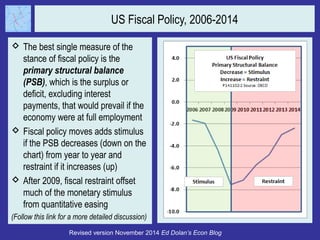
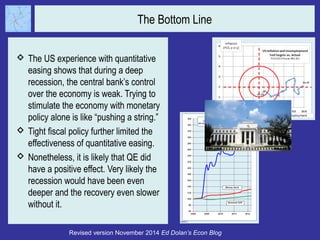

This tutorial explains the mechanics and effects of quantitative easing (QE) conducted by central banks, particularly the Federal Reserve from 2008 to 2014. It outlines how QE operates through open market purchases, which increase bank reserves and the monetary base but may have varying effects on the economy, including challenges in linking monetary policy to economic recovery. Despite its limitations, the document suggests that QE likely mitigated recession impacts and facilitated some degree of economic recovery.