Download to read offline
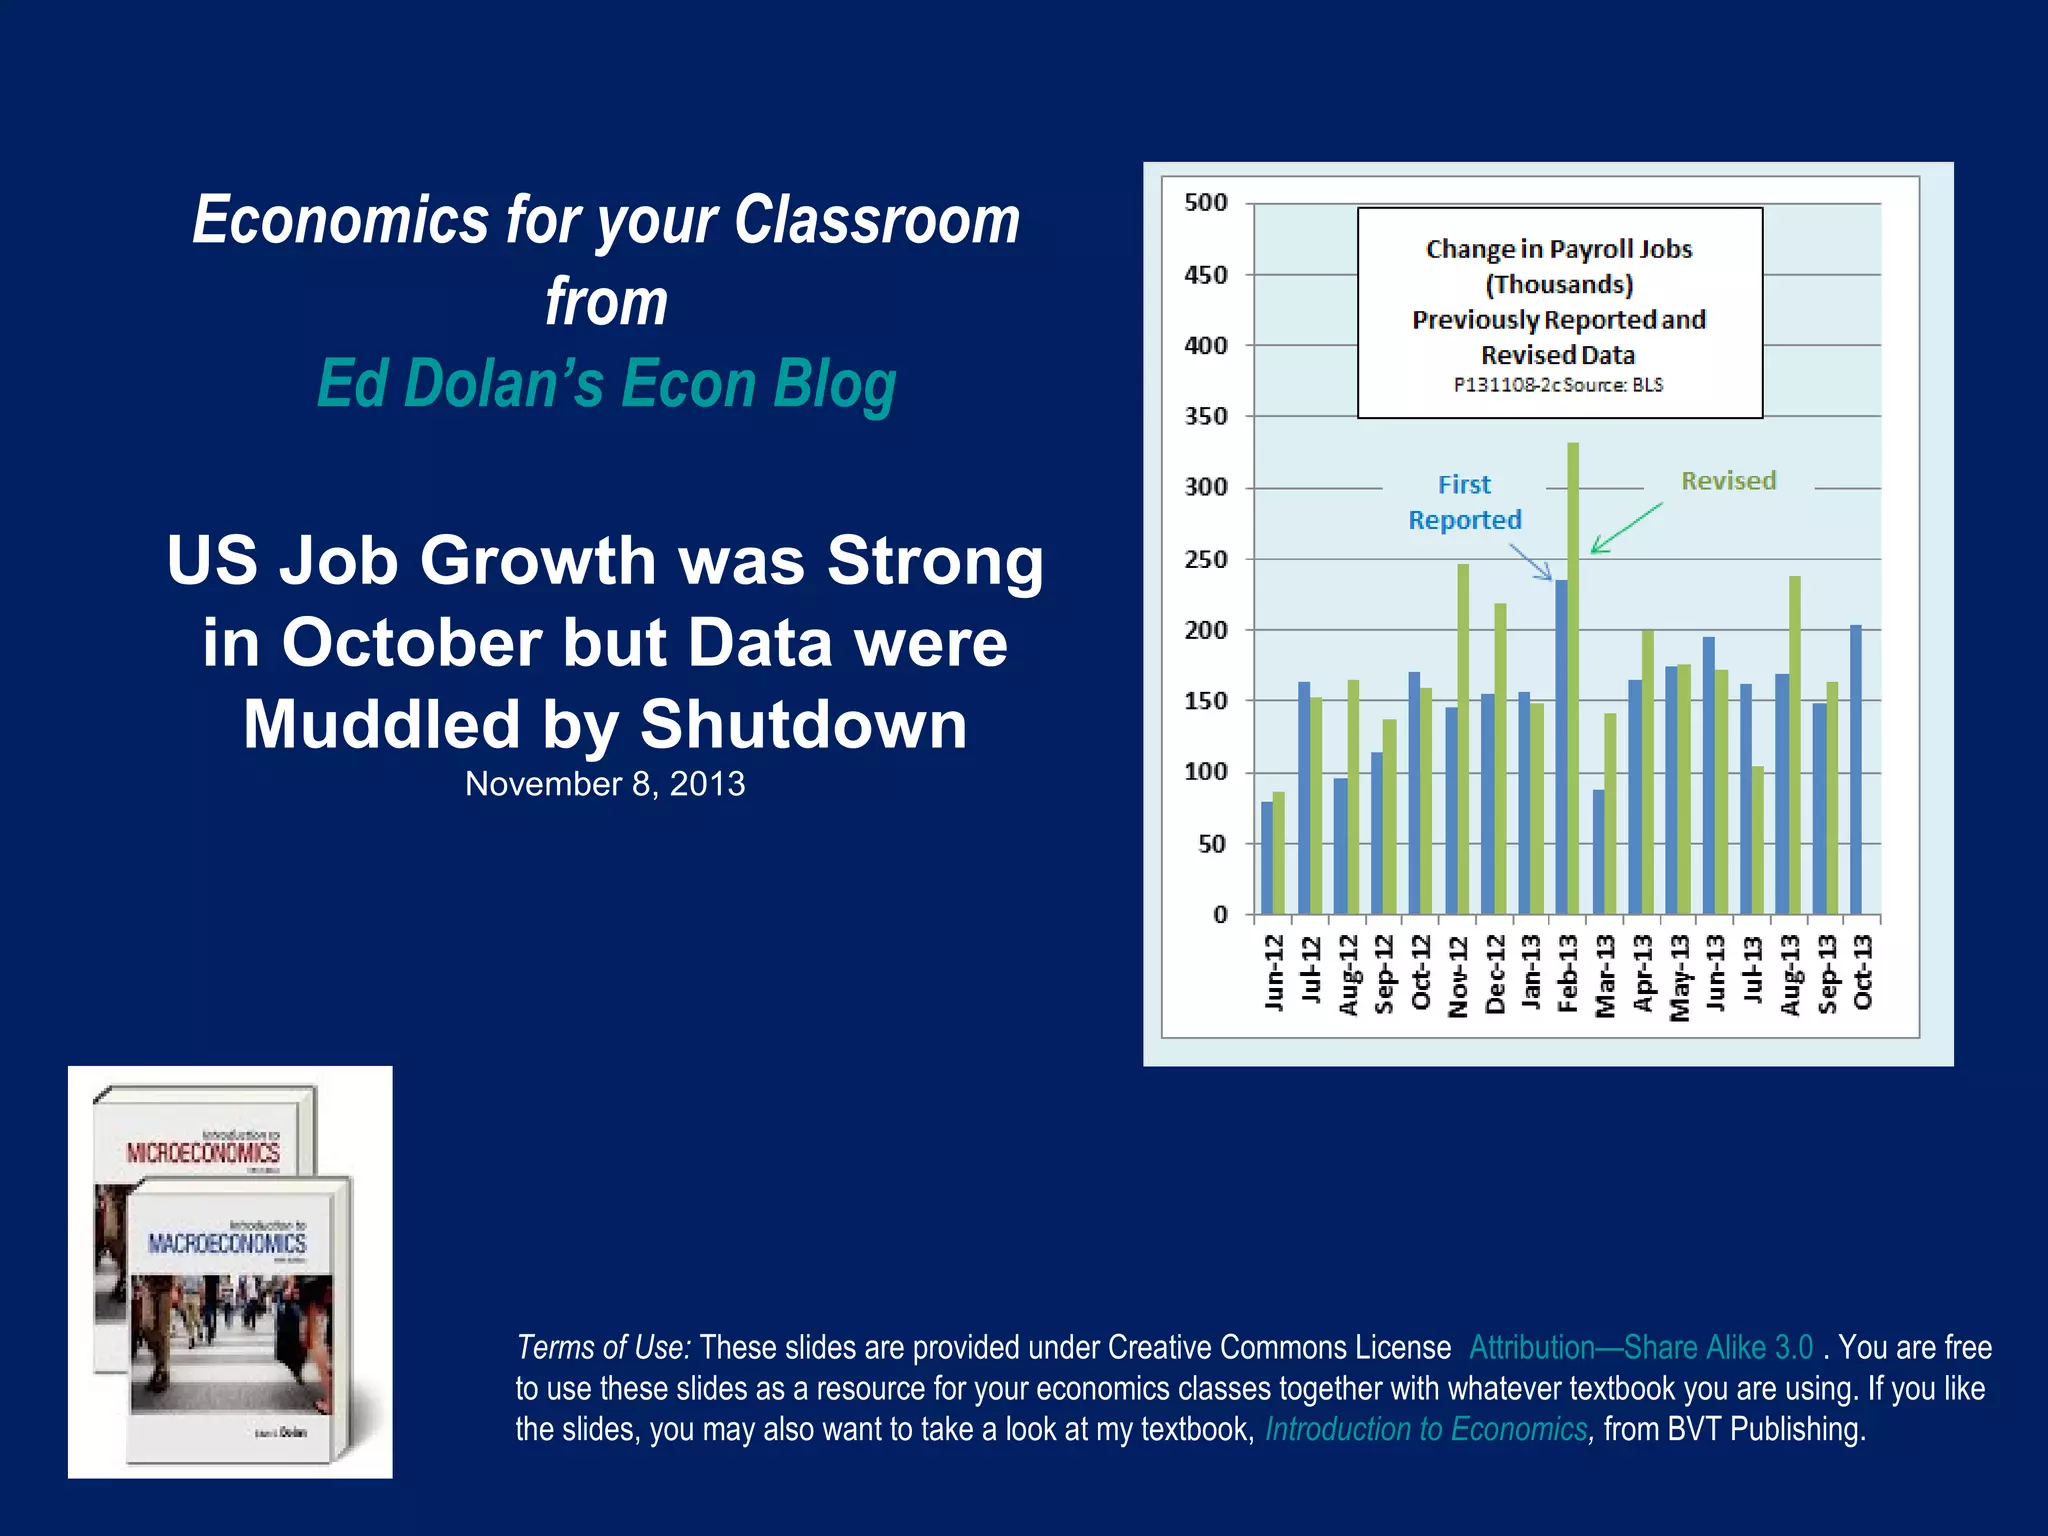
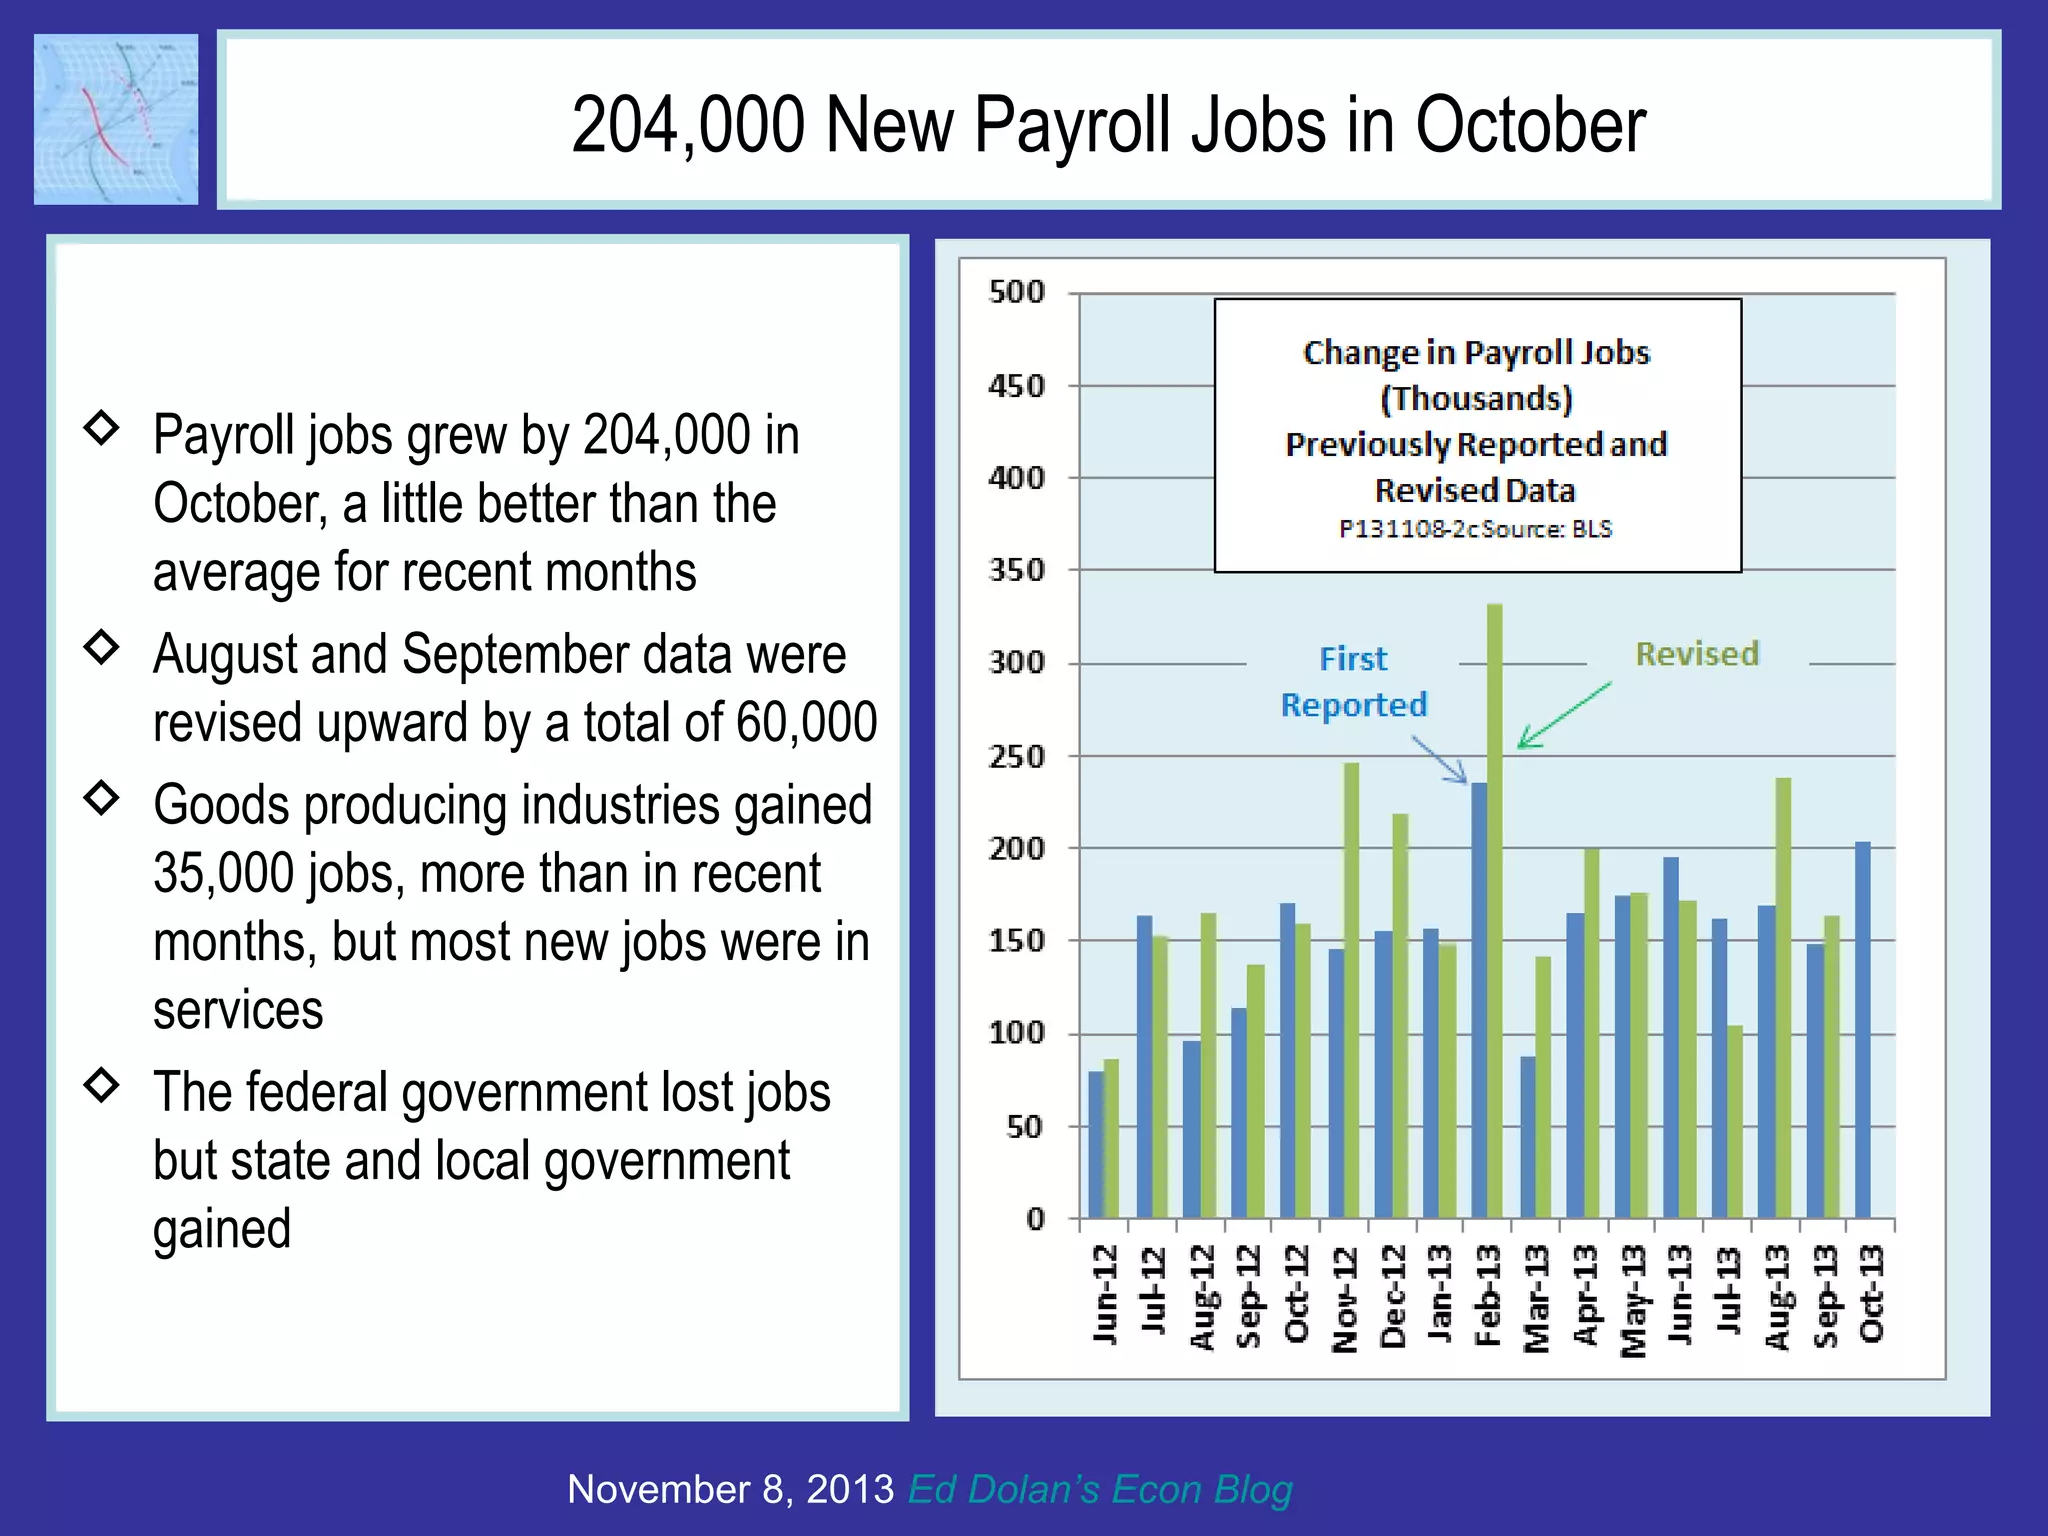
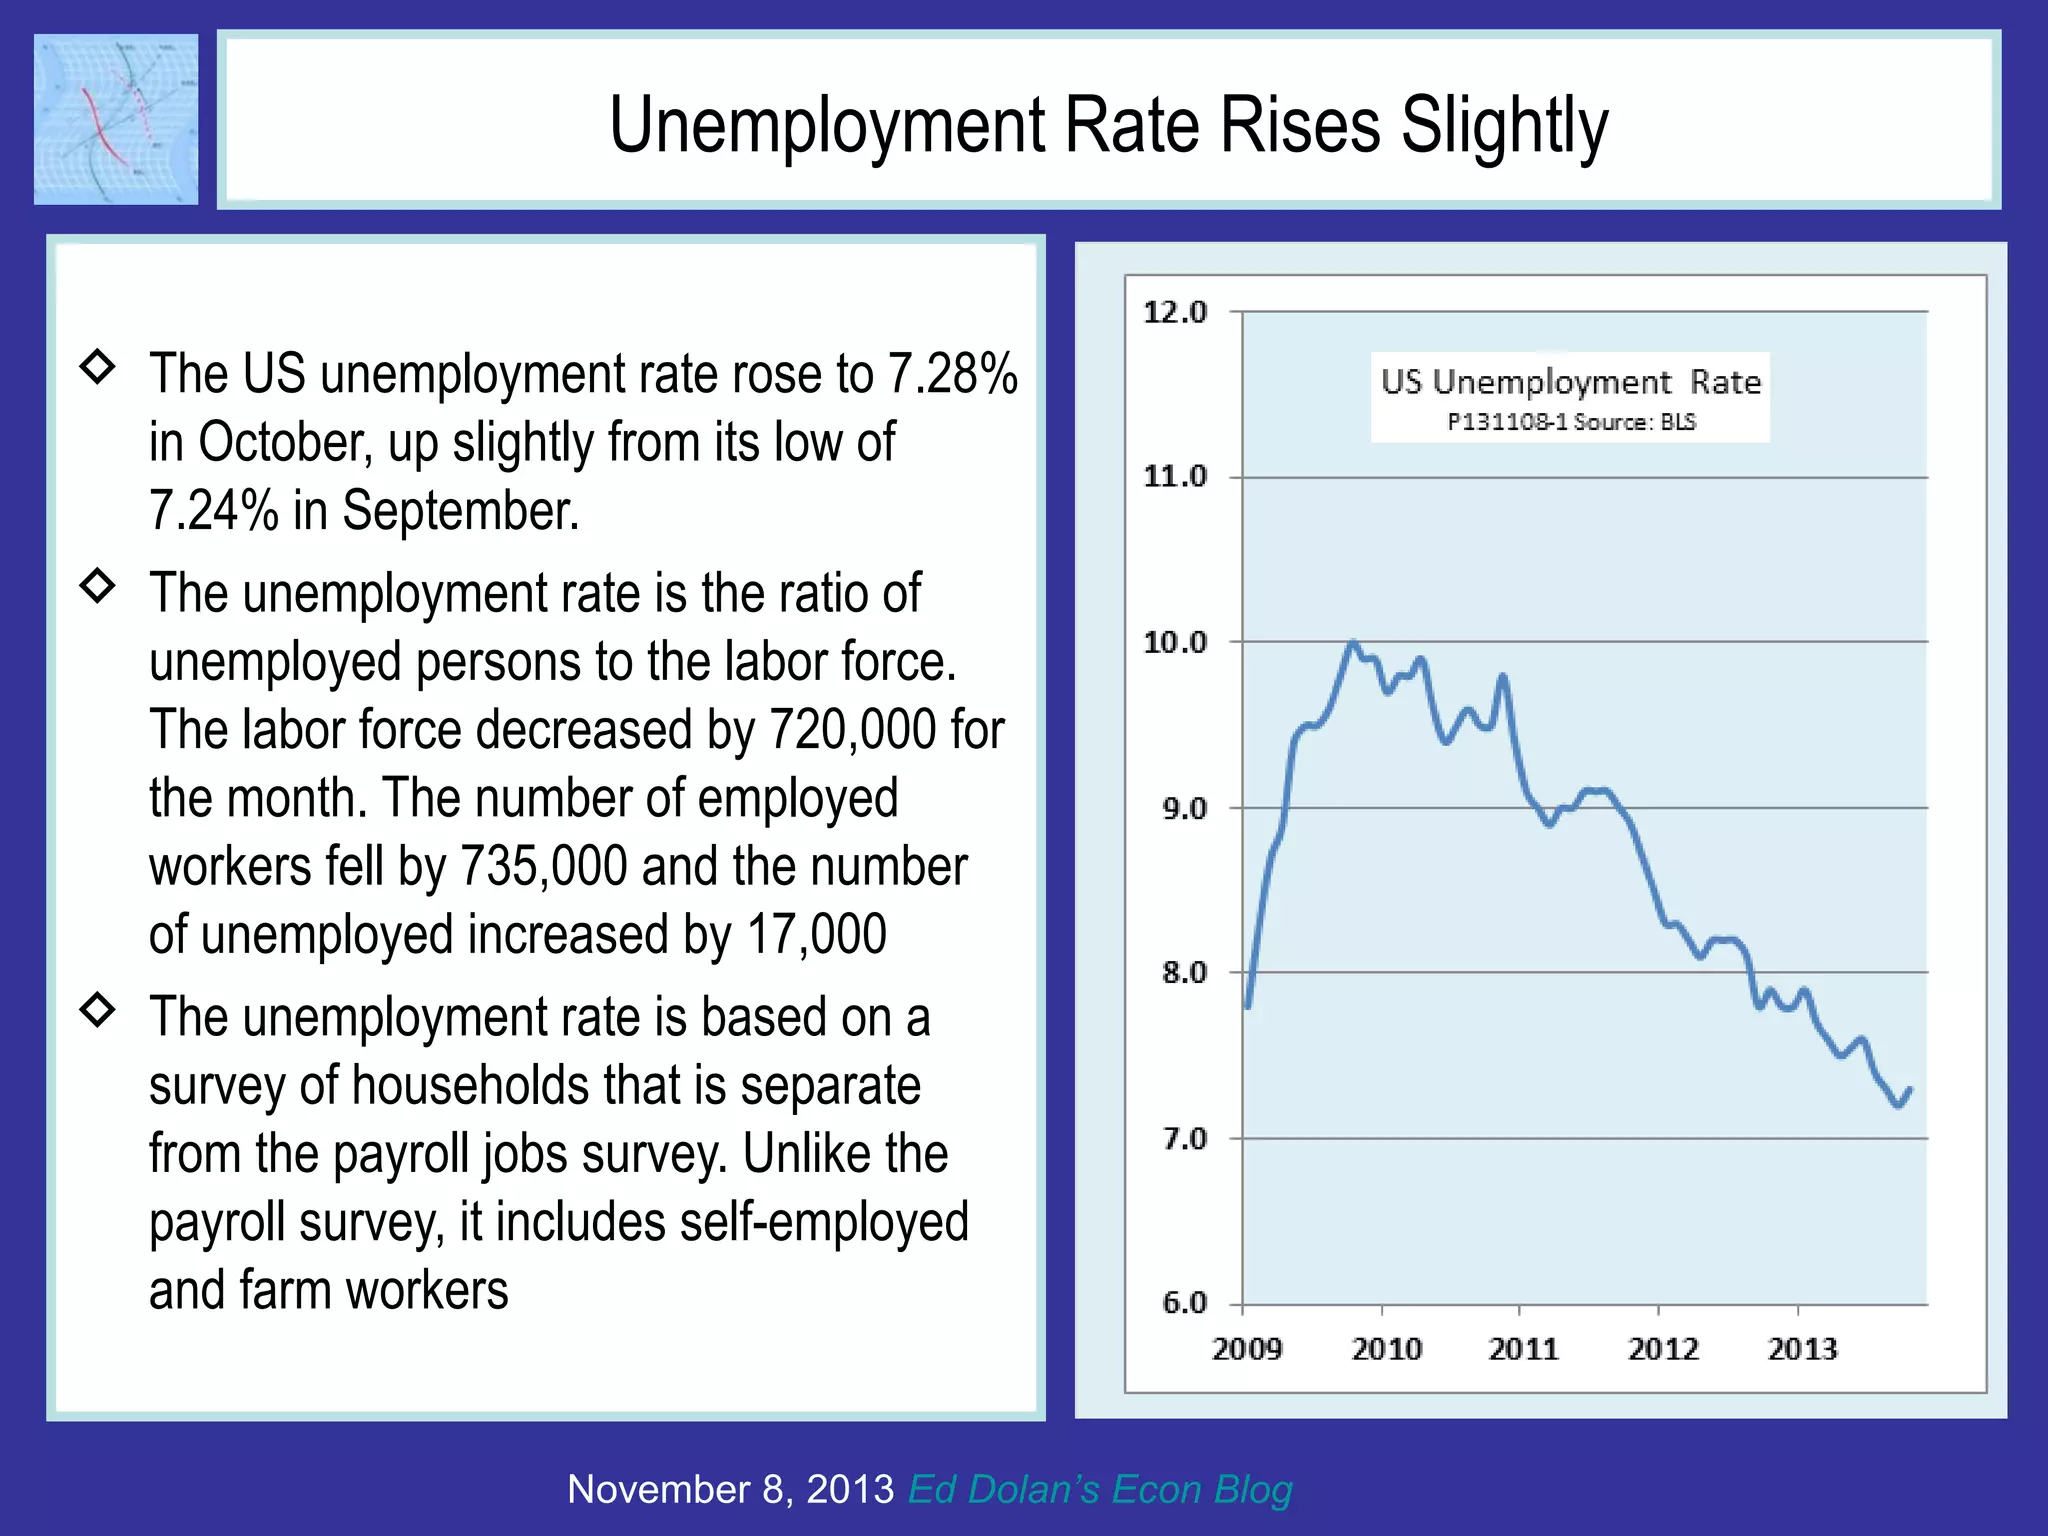
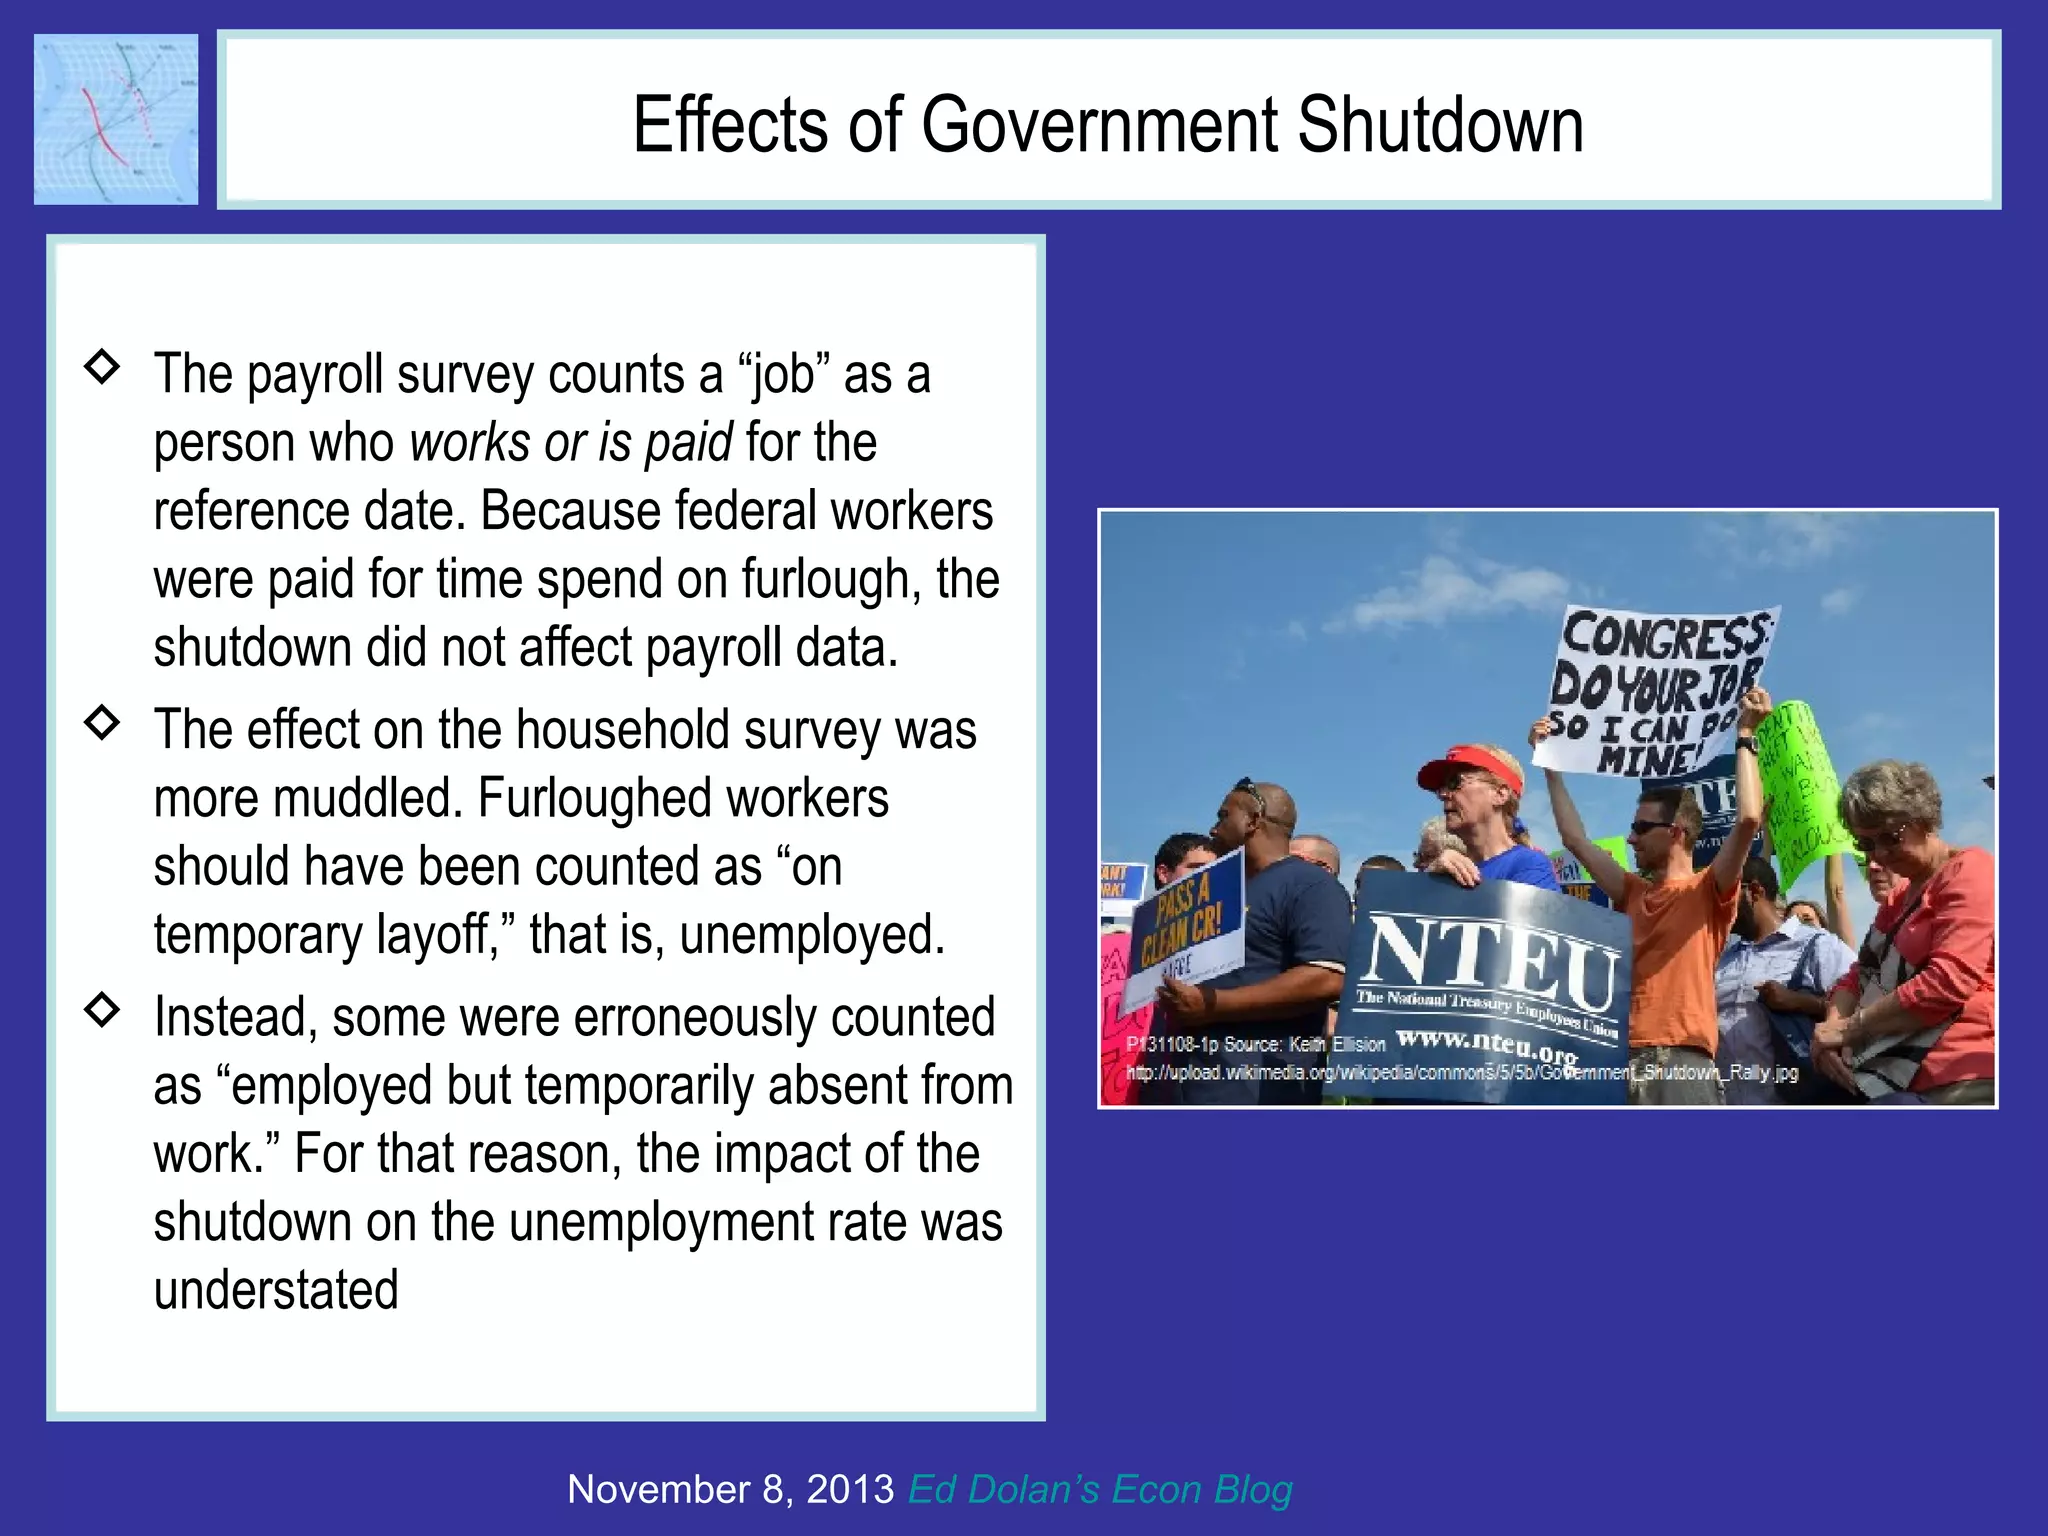
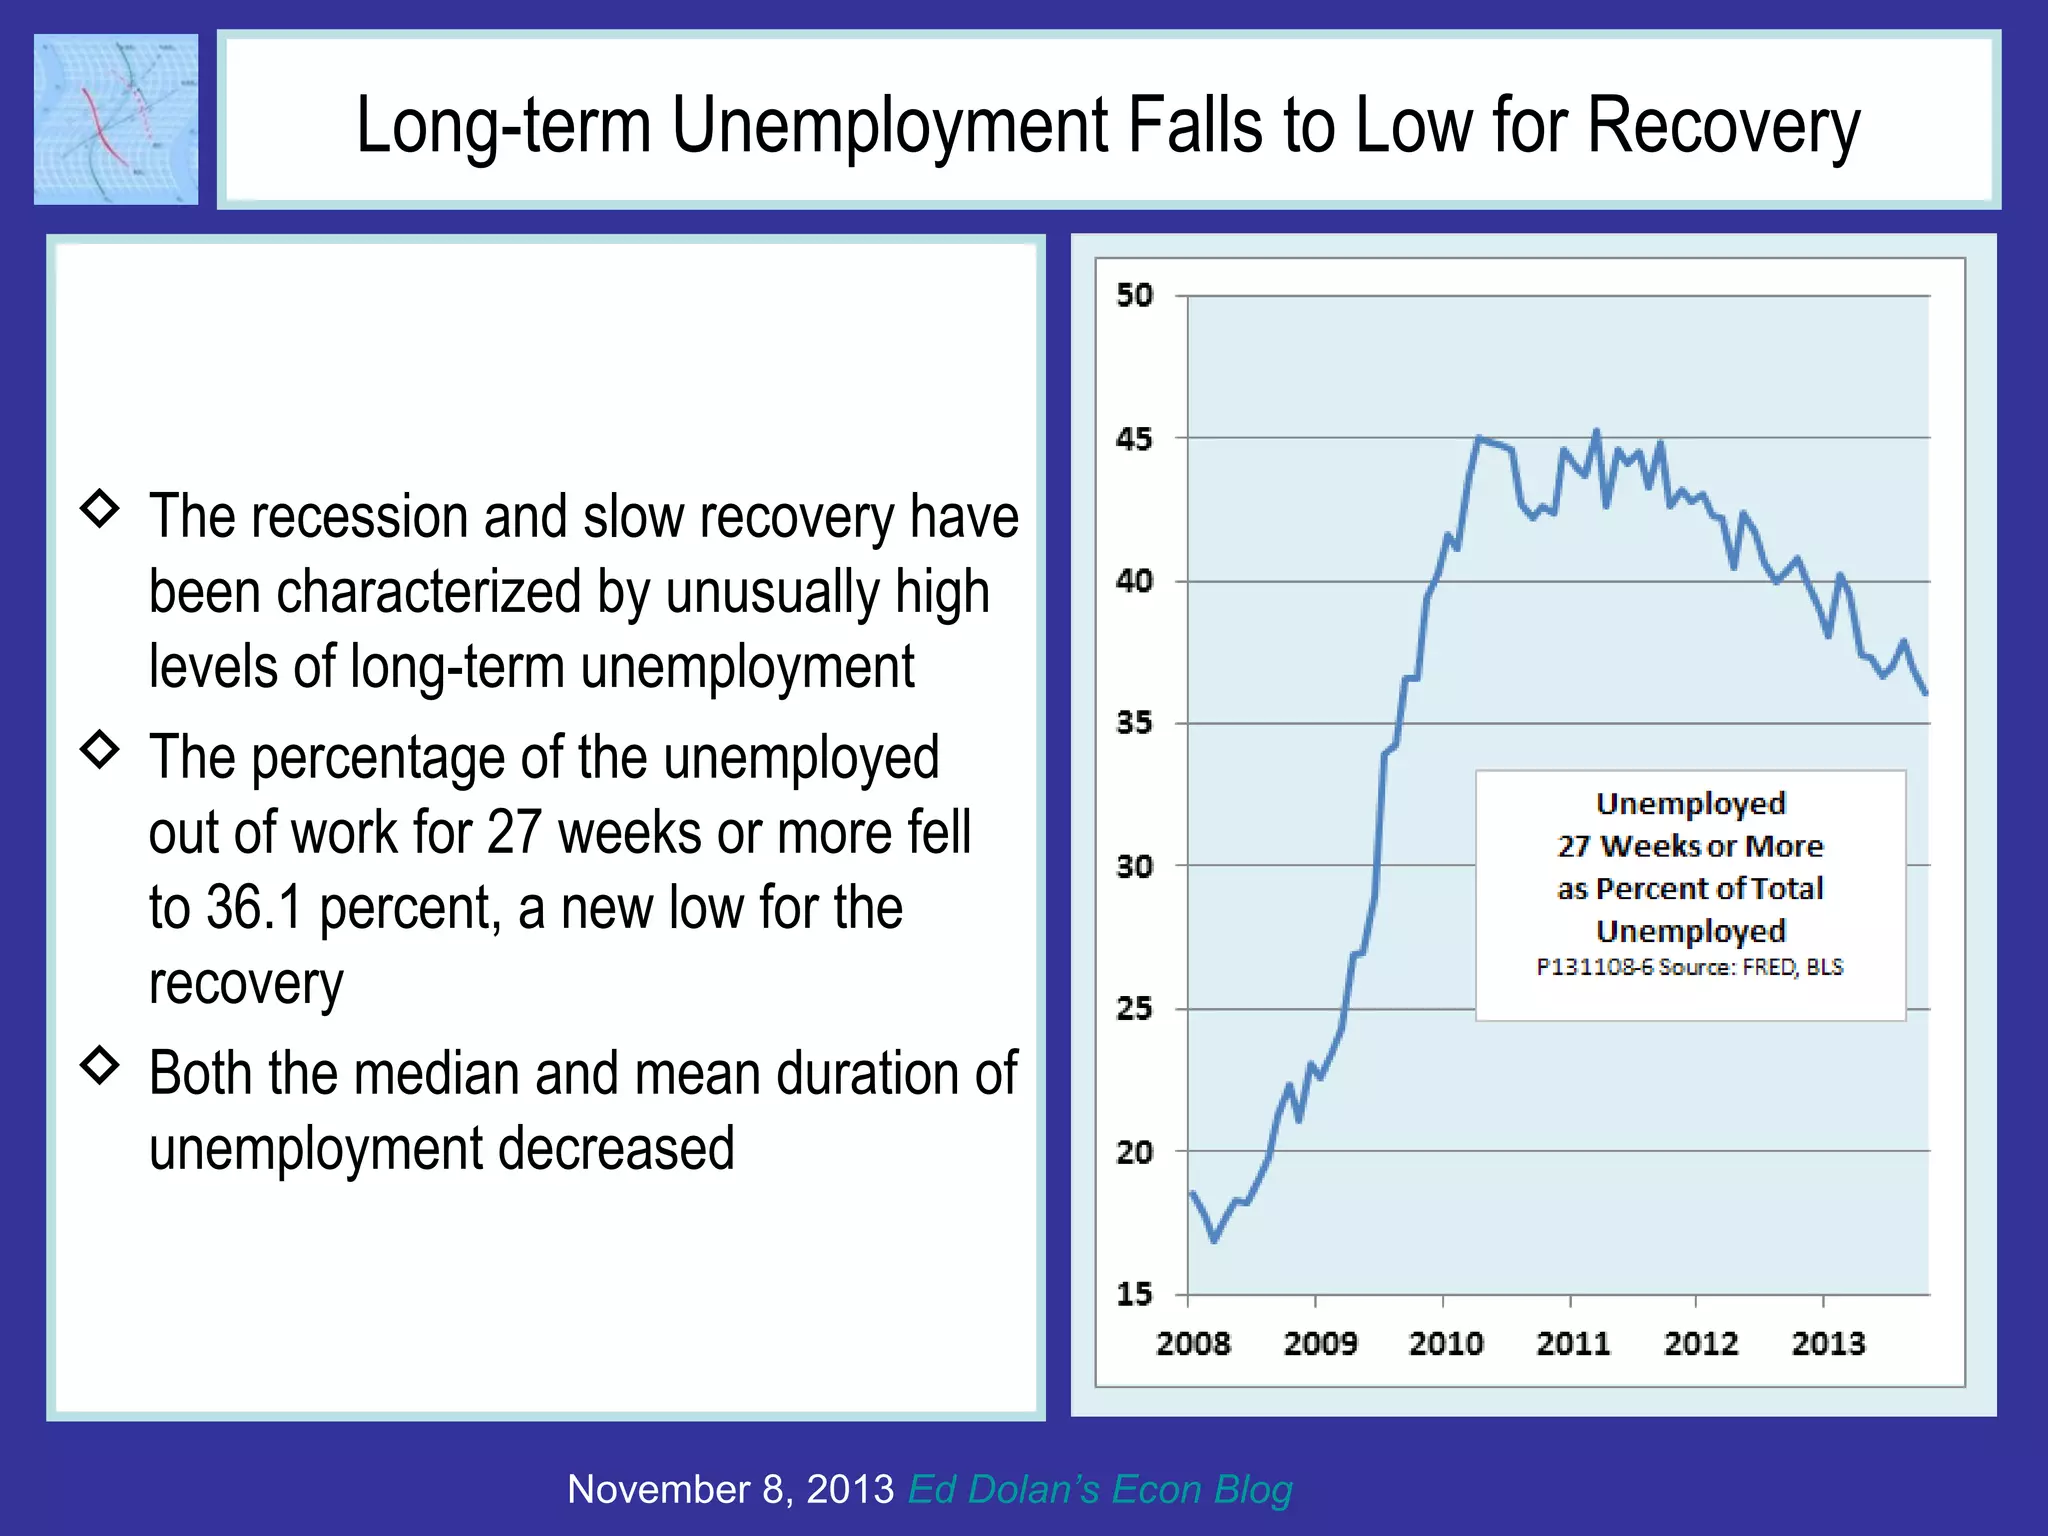
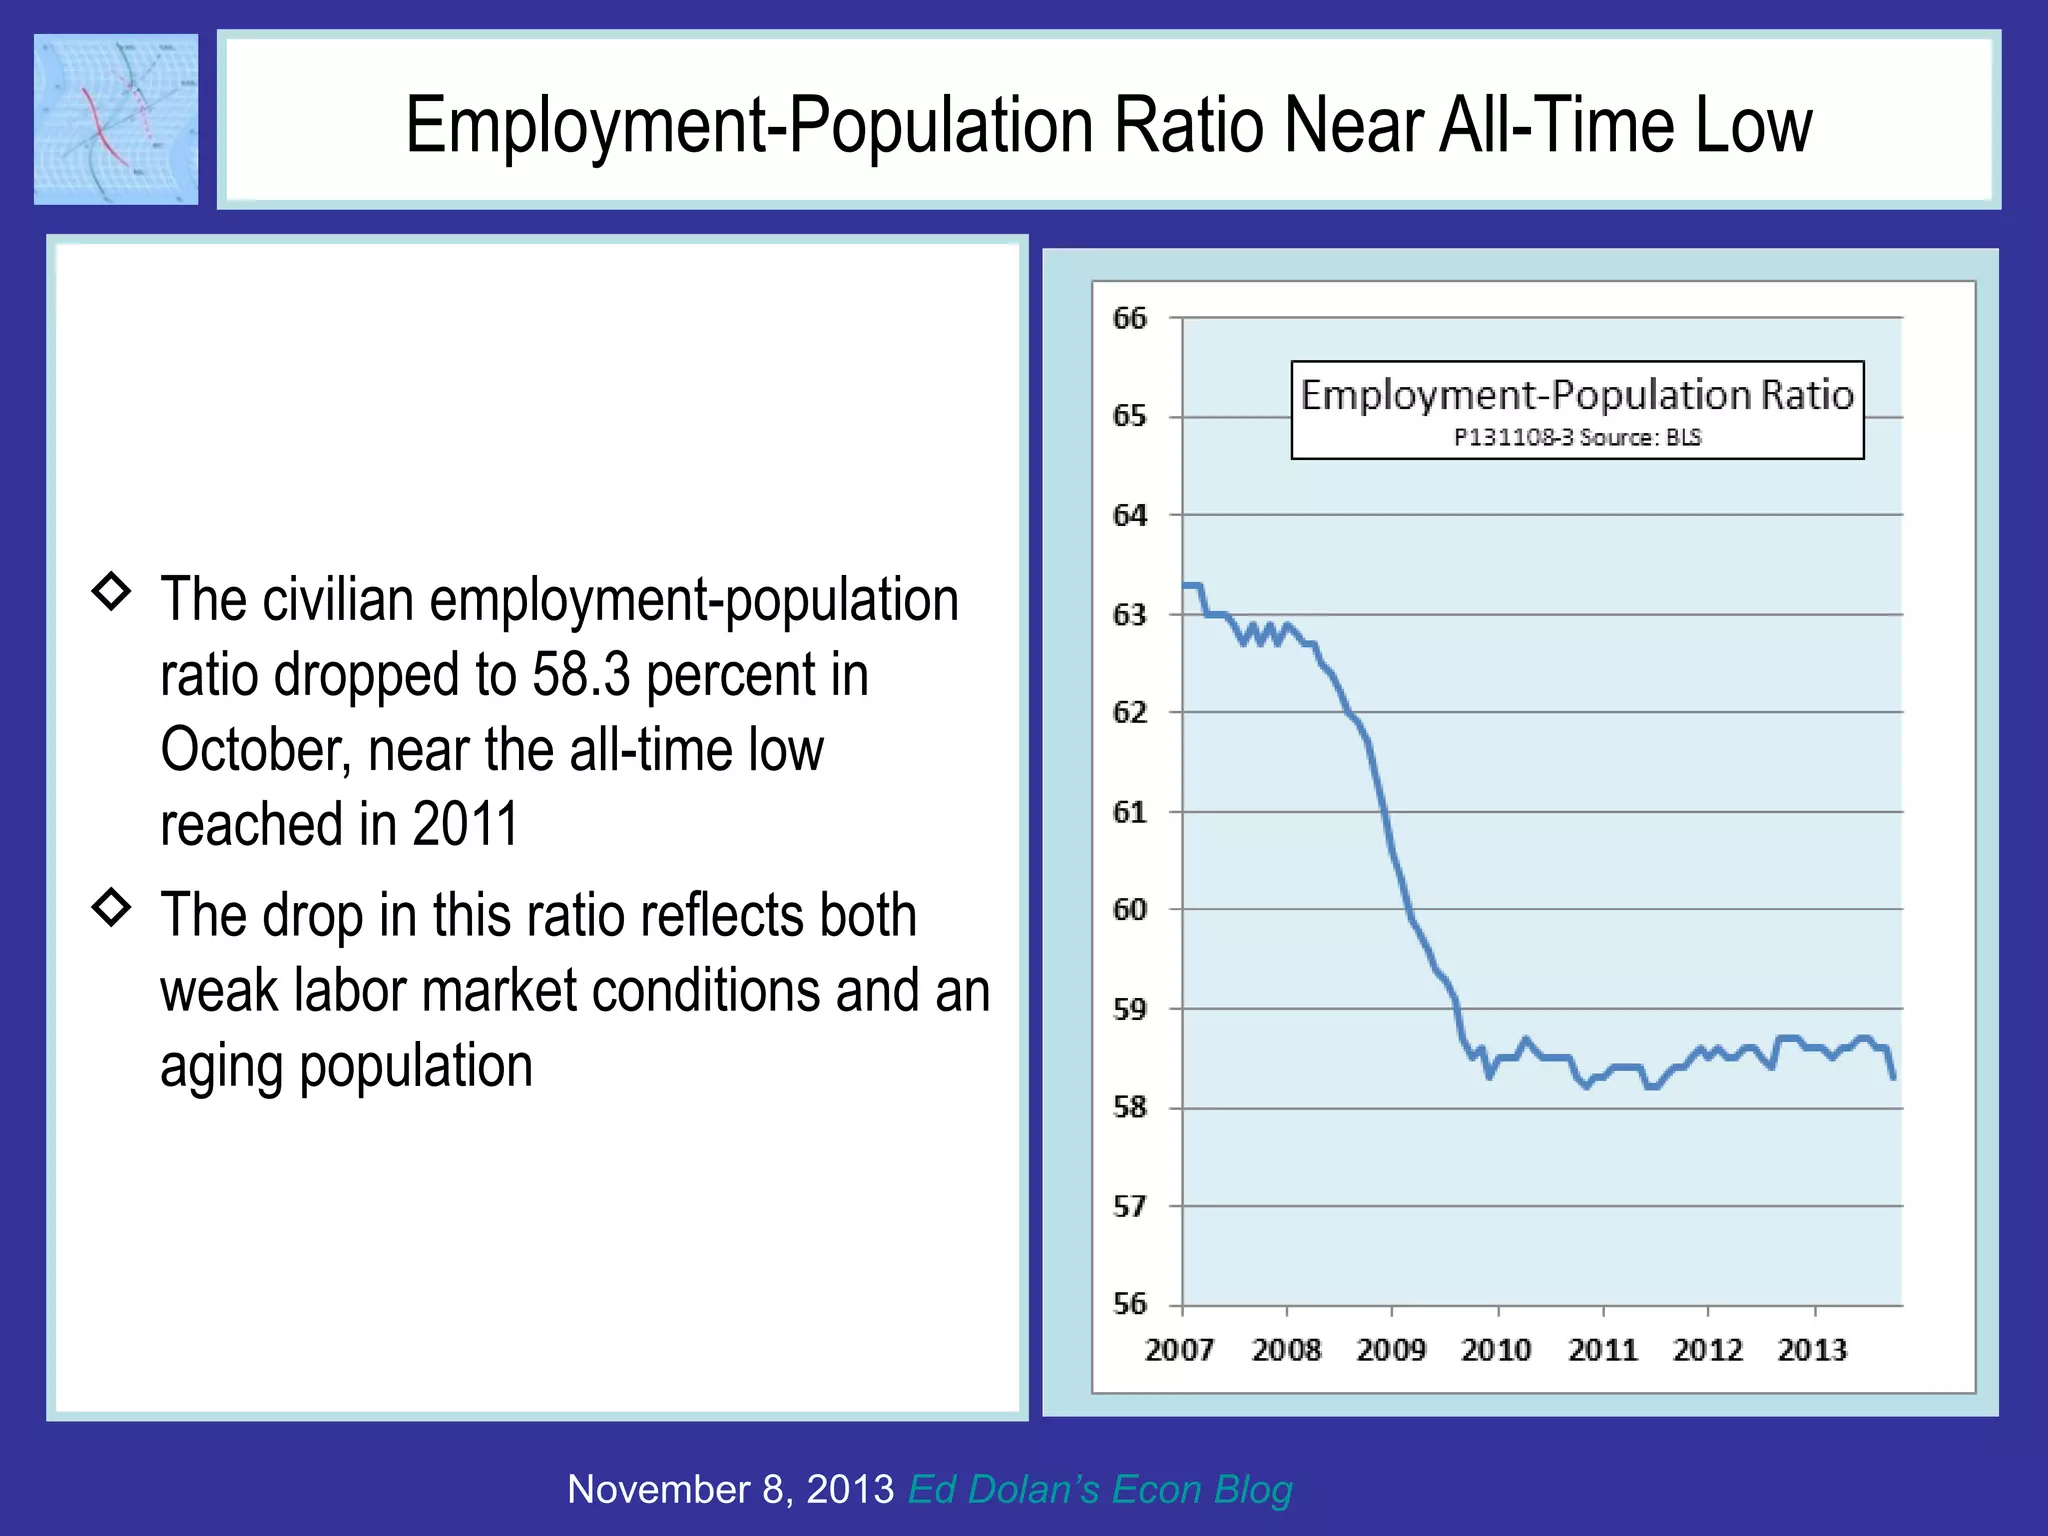


In October, the U.S. added 204,000 payroll jobs, with goods-producing industries seeing modest gains but services dominating job creation; however, the unemployment rate increased slightly to 7.28%. The government shutdown's impact on job statistics was complicated, leading to some furloughed workers being misclassified in employment surveys. Additionally, despite a decrease in long-term unemployment, the overall employment-population ratio remained near historic lows due to challenging labor market conditions.