


![Strategic quantitative easing 3
1.1 What this report is about
We are caught on the horns of a dilemma. After the bursting of a credit-fuelled
bubble, we want our banks to shrink and repair their balance sheets. But at the
same time we want them to expand credit to fund investment in the real economy.
Large corporations, who have cash, seemingly lack the confidence to invest or
expand production. Meanwhile, the Government is cutting expenditure to try to
reduce its deficit. So where will the money come from to kick-start the economy?
In this report we suggest a solution. Most people perhaps are still not aware that
our money supply is created primarily by commercial banks, and hence shrinking
banks means less money flowing into the economy. The inelegant phrase
‘quantitative easing (QE)’, on the other hand, has certainly entered the popular
consciousness. Public institutions, in the shape of the Bank of England, can create
money, too. So far it has created £375 billion under the QE programme, prompting
two crucial questions: How well has this worked? and Could we do better?
We argue that the use of the Bank of England’s powers, through QE and other
schemes, has not been effective in stimulating an economic recovery. Neither will
it contribute to the Government’s stated objective of rebalancing the economy
towards manufacturing and exports. We explain why this is the case, in theory and
in practice.
We propose that the programme of QE be modified to be less scattergun and
more strategic. Specifically we propose that it directly finance investment in the
real economy. Importantly, we address the valid concern that unconventional
monetary policy might be subverted by short-term political pressures, risking loss
of control of inflation.
In essence, the solution is to mandate the Bank of England to act more like a
bank.
1. Introduction: public money for public good
When banks extend loans to their customers, they create money
by crediting their customers’ accounts. The usual role of a central
bank is to limit this rate of money creation, so that an excessive
expansion of money spending does not lead to inflation. But a
damaged banking system means that today banks aren’t creating
enough money. We have to do it for them.
Mervyn King, Governor of the Bank of England, October 20123
[E]specially as fiscal policy becomes constrained by budget
stringency … monetary policy is the main instrument for affecting
macroeconomic performance. That this key determinant of what
happens to society – this key collective action – should be so
removed from control of the democratically elected officials should
at least raise questions.
Joseph Stiglitz, 19984](https://image.slidesharecdn.com/qereportfinalweb-130704093508-phpapp01/85/Qe-report-final_web-7-320.jpg)
![Strategic quantitative easing 46
The proposals set out in Section 5 represent practical options for more effective
targeting of QE. We believe this enhanced monetary activism would better enable
the Bank of England to deliver on both its primary aim of price stability and also the
subsidiary aims of delivering on the Government’s economic policy objectives.
However, targeted QE does raise important issues of governance and
accountability. In this section we examine these issues and propose modifications
to existing institutional arrangements that can meet these challenges.
6.1 Central bank independence and fiscal neutrality: myth and reality
The separation between monetary and fiscal policy and central bank independence
over monetary policy has been held up as key reason behind the relatively benign
economic conditions enjoyed by western economies in the 15 years prior to the
financial crisis. By providing central banks with operational independence and a
strong focus on price stability, the idea was that not only actual inflation, but also
inflationary expectations would be ‘anchored’. This would be beneficial for the
economy since both companies and households would feel confident to plan
investments well in to the future.
The financial crisis of 2007–2009 does not, astonishingly, seem to have led to
much questioning of this division.179 This is despite the fact that the crisis was
largely the result of central banks failing to prevent the build-up of massive inflation
in a key sector of economy: the housing market.180 But this arrangement is not one
with a long historical precedent.
6.1.1 A brief history of central banking
Whilst most people probably think of central banks as public institutions, for the
majority of their history they have been privately owned. Most, however, were
nationalised after the Great Depression and World War II as governments felt
they needed more control over this power of money creation to rebuild their
economies.181 In many countries, governments and central banks worked
closely together to devise policies that led to high rates of growth and low
unemployment.
6. The implementation challenge: good governance
Independent central bankers tend to get very squeamish about
expressing support for any particular government proposal…
Tragedies have occurred, however, when [they] let worries about
the perception that they are too close to the fiscal authority prevent
them from doing something constructive in times of crisis… It is
critical… that we do not get caught up in a ‘You first, my friend’,
‘No, after you, my good sir’, routine over who should make the
first overture to whom… Even in places where relations between
fiscal and monetary policymakers are constructive and not fraught
by distrust, there is a tendency for joint efforts to fall between the
cracks due to turf considerations and natural divisions of labour.
We just have to be transparent about this, and we should get going.
Adam Posen, Monetary Policy Committee member, 2009-201278](https://image.slidesharecdn.com/qereportfinalweb-130704093508-phpapp01/85/Qe-report-final_web-50-320.jpg)
![Strategic quantitative easing 48
operational independence in the setting of monetary policy, altering the target to 2.5
per cent,185 and adding a clause to the end of the above statement in regard to the
direction the Treasury could give to the bank: [except in relation to monetary policy].
The 1998 Act also set out more formally the bank’s objectives, stating:
In relation to monetary policy, the objectives of the Bank of England shall
be—
(a) to maintain price stability, and (b) subject to that, to support the
economic policy of Her Majesty’s Government.186
The Government’s economic policy objective is:187
…to achieve strong, sustainable and balanced growth that is more evenly
shared across the country and between industries. This objective recognises
that over a number of years preceding the recent financial crisis, economic
growth in the UK was driven by unsustainable levels of private sector
debt and rising public sector debt. This pattern of unbalanced growth and
excessive debt helped to create exceptional economic challenges in the UK.
The Government also handed over control of financial regulation to the independent
Financial Services Authority (FSA). Following the financial crisis of 2007–2009, the
Bank of England’s remit has been significantly broadened. The 2009 Banking Act
gave the Bank of England a statutory objective to protect and enhance the stability
of the financial systems of the United Kingdom and the Court, consulting HM
Treasury and on advice from the newly formed Financial Policy Committee (FPC), in
determining the Bank’s strategy in relation to that objective.188
None of this, however, really tells us a lot about the monetary/fiscal policy divide.
It would appear there is nothing in writing to guide policy in this area. Rather,
we seem to be dependent on statements, mainly by the Bank of England, to
understand the divide. The most comprehensive statement we could find in recent
years was made by Mervyn King in a speech last October:189
The role of the Bank of England is to create the right amount of money,
neither too much, nor too little, to support sustainable growth at the target
rate of inflation. We are not doing it at the behest of the Government to
help finance its spending. It is the independence of the Bank that allows us
to create money without raising doubts about our motives. But just as it is
crucial that governments do not control the printing of money, so too the
unelected central bank must not determine the levels of taxes and public
spending.
Fiscal policy is a matter for elected governments. There has been some talk
about the possibility that money created by the Bank could be used directly
to finance additional government spending, or even that money could be
given away. Abstracting from the colourful metaphor of ‘helicopter money’,
such operations would combine monetary and fiscal policies.
There is no need to combine them because, as now, once the Bank has
decided how much money should be created to meet the inflation target,
the case for the Government to increase spending or cut taxes to counter a
downturn stands or falls on its own merits… Not only is combining monetary
and fiscal policies unnecessary, it is also dangerous. Either the government
controls the process – which is ‘bad’ money creation – or the Bank controls
it and enters the forbidden territory of fiscal policy.
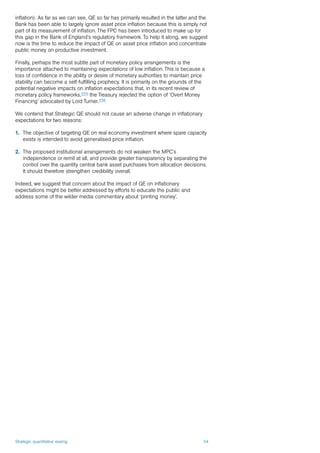
This is a remarkable statement for a number of reasons. First, it implies that the
Bank of England can actually determine, reasonably effectively, what the ‘right
amount of money’ is in the economy. But the financial crisis – and indeed nearly
all major twentieth-century banking crises – was the result of excessive money
creation by the banking sector, as a number of studies show and as Adair Turner,
former Chairman of the FSA has recently stated.190,191,192 If Mervyn King accepts
this, then he must also accept that the Bank of England got its estimations of the](https://image.slidesharecdn.com/qereportfinalweb-130704093508-phpapp01/85/Qe-report-final_web-52-320.jpg)
![Strategic quantitative easing 49
‘right amount’ of money in the economy completely wrong in the period leading up
the financial crisis.
The reality is that 97 per cent of the money in circulation is created by commercial
banks and just 3 per cent by the central bank.193 And deregulation between
the 1970s and 2000s has meant that the Bank of England has chosen to have
increasingly little, if any, control of over commercial bank credit creation (see also
Box 1 on the money multiplier myth). Rather, ‘banks make loans first and search
for the reserves later’ in the words of Federal Reserve Banker, Alan Holmes.194 The
central bank must always ensure there are sufficient reserves in the banking system
or it will collapse, with catastrophic results for the economy.
Mervyn King terms ‘bad money creation’ a situation where the government of the
day controls the process of money creation. One wonders, then, what the Governor
would call the 370 per cent increase in mortgage credit created by the banking
system in the period 1997–2007 that eventually contributed to the financial crisis.
Presumably, this is ‘good’ money creation? Such a distinction purely on the basis
of whether money creation is in public or private hands appears to us to be simply
ideological rather than grounded in evidence.
If the Bank of England has virtually no control over the amount of money in
circulation and where it is allocated, the argument for a strong divide between
monetary and fiscal policy to ensure central bank ‘independence’ is undermined.
Monetary policy, defined as control over the creation and allocation of money, would
then appear to be entirely in the hands of commercial banks. The Bank’s role is not
to scrutinise or direct such activities, hence providing some element of democratic
accountability, but to prop up this system by supporting such commercial banks
(for the sake of the wider economy) by ensuring there is sufficient liquidity in the
system.
There is then a very strong democratic and economic argument to say that current
arrangements need reform. Furthermore, as this report has detailed in Sections 2
and 3, QE does favour certain sectors of the market economy over others. Buying
government bonds would appear to increase asset prices and thus support (mainly
large) UK private companies and that very concentrated part of the UK population
that holds such assets. It is not clear why this kind of monetary policy is any more
neutral than buying corporate bonds issued by agencies with a remit to invest in
infrastructure or home-building or SMEs. Indeed, one might argue the onus is on
the Bank of England to demonstrate why it has not bought assets to support these
neglected sectors of the economy as to do so would surely more evenly balance
out the fiscal impact of QE policies.
At one point during 2011, it did look as if the Treasury and the Bank of England
were about to enact a policy – ‘credit easing’ – that would have supported the SME
sector through Bank of England purchase of securitized SME loans.195 Many were
in favour of such an intervention, including former MPC member Charles Goodhart
who makes the same point that such an intervention is not really any less or more
‘fiscal’ than existing QE:
This [credit easing] proposal, however, runs into the question whether such
a mechanism should be regarded as primarily fiscal, and within the purview
of the Ministry of Finance, rather than monetary. Such lending would both
involve risk and involve intervention in markets to shift relative prices. Indeed
so, but existing QE in whatever form involves risk, even if collateralized, and
also shifts relative prices; that is, after all, largely the purpose of the exercise
via portfolio effects.196,197
6.1.4 The blurring of the monetary/fiscal policy dividing line
Recent developments suggest the ice may be melting on the monetary/fiscal
policy divide. Most obviously, these are the addition to the Bank’s remit of ‘financial
resilience’ and the creation of the Financial Policy Committee (FPC). The FPC’s job
is to conduct ‘macroprudential policy’ which involves assessing system-wide risks to
the resilience of the economy and which has powers of direction to intervene where
it considers unsustainable risk is building up.](https://image.slidesharecdn.com/qereportfinalweb-130704093508-phpapp01/85/Qe-report-final_web-53-320.jpg)
![Strategic quantitative easing 51
6.2 Governing strategic QE: the Monetary Allocation Committee
Rather than attempting to persuade the Bank of England to return uncomfortably
to its broader remit of the 1960s, the Treasury might be better served focusing on
creating an institutional framework that would enable QE to be directed to the real
economy in a way that the Bank of England would be comfortable with. In any case,
we argue that there is room for improvement in the decision-making process for the
allocation of QE asset purchases.
Let us briefly examine the logic for restricting asset purchases to gilts. Any losses
incurred by the APF are underwritten by the Treasury; the directors of the APF,
it would appear, have sought to ensure that there is the minimum of credit risk
attached to any asset purchases that they make (e.g. the corporate bonds the APF
purchased were of investment grade only). However, there still remains significant
market risk on the potential sale of any bonds that are not held to maturity. The
Government might not default on the bond, but the APF might still have to sell it
back to the market for less than it purchased it for, thereby incurring a capital loss.
Furthermore, the Government always intended the APF to buy a broader range of
assets, so who made the decision to only purchase gilts?
Let us first recall the current governance arrangements for the APF (Section 3.2).
The MPC decides on the quantity of assets to be purchased. Who decides on the
type of assets to be purchased? Not the MPC, it seems, as evidence from former
member of the MPC, Adam Posen, to the Treasury Select Committee, suggests that
MPC members were even blocked from discussing the purchase of a broader range
of assets during MPC meetings.213
The APF is structured as a limited company, the Bank of England Asset Purchase
Facility Fund Limited, wholly owned by the Bank of England. It is the directors of the
APF who decide on the allocation of purchases. There are two directors, Spencer
Dale and Paul Fisher, both of whom are executives of the Bank of England and
who directly report to the Deputy-Governor, Charlie Bean, who in turn reports to the
Governor. It this group of Directors that ultimately decides on how QE funds will be
allocated. There are no independent non-executive directors,214 and according to
Posen, no oversight by or accountability to the MPC.
After stepping down as MPC member, Posen publicly criticised the Governor and
others for ignoring his pleas for the Bank of England to use the APF to capitalise an
SME-financing public bank. Posen is quoted by Reuters as stating:215
The current and previous chancellor wanted to see strong monetary easing
and wanted at least contemplated alternative asset purchases, but were
unwilling to take on an independent central bank’ […] But an independent
central bank isn’t the same as one individual being able to block discussion.
We suggest that the transparency and oversight of asset allocation decisions can
be improved. The Treasury should create an independent ‘Monetary Allocation
Committee’ (MAC), with clear terms of reference and answerable to Parliament via
the Treasury Select Committee, that could decide on the optimal allocation of asset
purchases. This would include not only new QE, but also the reinvestment of some
£100 billion of bonds maturing during the next five years. The MAC would direct the
operations of the APF, effectively becoming the board of directors of the existing
Bank of England Asset Purchase Facility Fund Limited.
The MAC would have a much broader macroeconomic remit than the Bank of
England and might be best staffed by academic macroeconomists and industry
leaders, in much the same way as the MPC. Their focus would be on the best use
of QE money in terms of employment, regional imbalances, capital investment,
supporting SMEs, spare capacity, exports and the trade balance, energy security,
and carbon targets. The MAC would be expected to coordinate closely with the FPC
and the MPC and could have non-executive members of each plus the Treasury on
its board. The quantity and maturity structure of asset purchases would remain with
the MPC with its focus on longer-term rates and inflation.
We propose that the remits of the MAC and the MPC might be complementary as
set out in Box 7.](https://image.slidesharecdn.com/qereportfinalweb-130704093508-phpapp01/85/Qe-report-final_web-55-320.jpg)
![Strategic quantitative easing 57
Endnotes
1 This report focusses on how QE might be more effective in stimulating nominal GDP in a way that rebalances the British economy and creates jobs.
This is not contradictory to the notion, argued elsewhere by nef among many others, that GDP is not an effective measure of social progress or
quality of life. Neither is it an endorsement of resource optimism that presumes no constraints on economic growth. Indeed, we see policy tools that
are able to improve the social and environmental quality of GDP as essential to meeting the challenges of resource scarcity.
2 Holmes, I. and Mabey, N. (2010) Accelerating to the Transition to a Low Carbon Economy: The case for a Green Infrastructure bank (London: E3G)
3 Speech given by Mervyn King, Governor of the Bank of England to the South Wales Chamber of Commerce at The Millennium Centre, Cardiff, 23
October 2012. Retrieved from www.bankofengland.co.uk/publications/documents/speeches/2012/speech613.pdf [accessed 2 May 2013].
4 Stiglitz, J. (1998). Central banking in a democratic society. De Economist 146, 199–226.
5 Ryan-Collins, J., Greenham, T., Werner, R. A., & Jackson, A., (2012). Where does money come from? A guide to the UK monetary and banking
system (2nd edition). London: nef (the new economics foundation).
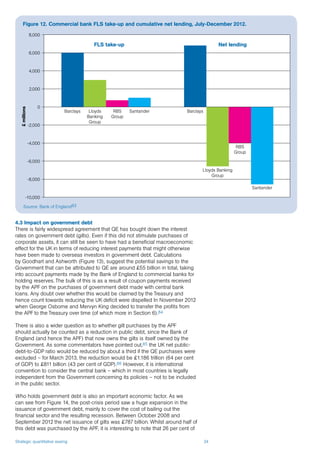
6 It is important to note that loans are being repaid all the time, and so if the gross amount of fresh loans is less than the amount of existing loans
repaid, net lending will be negative. In other words, the total stock of outstanding loans will fall as will the total stock of bank deposits. The same
dynamic occurs with purchases by banks of investment assets which will mature over time
7 In this report we will use the term ‘real economy’ to refer to transactions that are counted as part of GDP, in order to distinguish them from financial
transactions which do not contribute to economic output. It is not intended to imply that social and economic relations that are not included in GDP
accounting are unimportant.
8 It is also possible for them to reduce their lending without shrinking the money supply. If banks’ customers repaid their debts and banks restored
their asset side by buying seasoned securities, the level of deposits would be unchanged while debt went down. What happens to economic
activity then depends on the spending intentions of those who sold securities to the banks and whether the repayment of loans came from forgone
consumption or selling other assets
9 Ryan-Collins, J., Greenham, T., Werner, R. A., & Jackson, A. (2012). Where does money come from? A guide to the UK monetary and banking
system (2nd edition), London: nef, pp 117–120.
10 For an examination of historical evidence and economic modelling of the positive impact of moving from bank to state money creation, see Kumhof,
M., & Benes, J. (2012). The Chicago Plan Revisited. Washington DC: IMF.
11 For a contemporary proposal of how to enact such a reform on the UK see Jackson, D. & Dyson, B. (2012). Modernising Money: Why our monetary
system is broken and how it can be fixed. London: Positive Money.
12 For more on ‘crowding out’ theory see Ryan-Collins, J., Greenham, T., Werner, R. A., & Jackson, A. (2012). Where does money come from? A guide
to the UK monetary and banking system (2nd edition). London: nef, p. 126. The overall macro-economic impact of deficit financed government
expenditure is a much contested topic
13 National Institute for Social and Economic Research.
14 The Telegraph, ‘Loss of income caused by banks as bad as a ‘world war’, says BoE’s Andrew Haldane’. Retrieved from http://www.telegraph.co.uk/
finance/financialcrisis/9719300/Loss-of-income-caused-by-banks-as-bad-as-a-world-war-says-BoEs-Andrew-Haldane.html [accessed 30 April
2013].
15 The Economist. (2013). ‘Just Better than nothing’, 26 April.
16 Bank of England. (2013). Inflation Report. London: Bank of England, pp 26-30. Retrieved from http://www.bankofengland.co.uk/publications/Pages/
inflationreport/2013/ir1302.aspx
17 Meadway, J. (2013). Why we need a new macroeconomic strategy. London: nef, p. 19.
18 Wall Street Journal. (2013). ‘UK risks recession as output drops’. 12 March. Retrieved from http://online.wsj.com/article/SB100014241278873238267
04578355933415165920.html
19 ONS. (no date). Data retrieved from http://www.ons.gov.uk/ons/rel/gva/gross-domestic-product--preliminary-estimate/q1-2013/tsd-gdp-preliminary-
estimate--q1-2013.html
20 Comparisons with wartime austerity are mis-leading because at that time austerity meant forgoing consumption of other goods and services in
favour of war expenditure or post-war reconstruction. Today the term is used differently to describe cutting government expenditure in an attempt to
reduce government debt.
21 The ‘Help to Buy’ scheme allows people buying new homes up to a value of £600 000 can borrow 20 per cent of the value of their property
interest-free for five years, in return for the Government taking a stake in the equity. The Chancellor also introduced a new ‘mortgage guarantee’ to
help more people get a home loan without the need for a prohibitively large deposit.
22 Meadway, J. (2013). Why we need a new macroeconomic strategy. London: nef, p. 11.
23 Schularick, M. H., & Taylor, A. M. (2011). Credit Booms Gone Bust: Monetary Policy, Leverage Cycles, and Financial Crises, 1870-2008. American
Economic Review, 102(2): 1029-61
24 Büyükkarabacak, B., & Valev, N. T. (2010). The role of household and business credit in banking crises. Journal of Banking & Finance 34(6), 1247-
1256.
25 Büyükkarabacak, B., & Gumus, I. (2011). ‘Credit Decomposition and Business Cycles.’ Retrieved from www.eea-esem.com [accessed 8th May
2013]. This study shows that credit for both households and businesses is negatively correlated with the trade balance. However, the correlation
between household credit and trade balance was -0.65, whereas it is only -0.12 for the business credit.
26 An earlier study of 18 emerging economies also found a strong negative correlation between household credit and the trade balance.
Büyükkarabacak, B., & Krause, S. (2009). Studying the effects of household and firm credit on the trade balance: The composition of funds matters.
Economic Inquiry, 47(4), 653-666](https://image.slidesharecdn.com/qereportfinalweb-130704093508-phpapp01/85/Qe-report-final_web-61-320.jpg)
![Strategic quantitative easing 58
27 Meadway, J. (2013). Why we need a New Macroeconomic Strategy. London: nef. Retrieved from http://www.neweconomics.org/publications/entry/
why-we-need-a-new-macroeconomic-strategy
28 For example, the Federation of Small Business publishes members surveys that regularly cite the availability and cost of finance as a barrier to
growth. See http://www.fsb.org.uk/News.aspx?loc=pressroom&rec=7801
29 Werner, R. (2005). New Paradigm in Macroeconomics. Basingstoke: Palgrave Macmillan
30 As postulated by the Quantity Theory of Credit. See Werner, R. (1997). Towards a new monetary paradigm: a quantity theorem of disaggregated
credit, with evidence from Japan. Kredit und Kapital, 30(2), 276–309.
31 For more detailed information on the above processes, see Ryan-Collins, J., Greenham, T., Werner, R. A., & Jackson, A. (2012). Where does money
come from? (2nd edition), London: nef, ch. 4.
32 Bowdler, C., & Radia, A. (2012). Unconventional monetary policy: the assessment. Oxford Review of Economic Policy, 28(4), 603–621.
33 Werner, R.A. (2005). New Paradigm in Macroeconomics. Basingstoke: Palgrave Macmillan.
34 Werner, R. A., & Zhu, M. (2012). The relationship between interest rates and nominal GDP growth in the U.S., U.K., Germany and Japan from the
1960s to 2008. Paper presented at the International Conference on the Global Financial Crisis: European Financial Markets and Institutions,
University of Southampton, Southampton Management School, held at Chilworth Manor House Hotel on 25-26 April 2013.
35 Lyonnet, V., & Werner, R.A. (2012). Lessons from the Bank of England on ‘quantitative easing’ and other ‘unconventional’ monetary policies.
International Review of Financial Analysis. 25, 1–17.
36 The term QE had been proposed in 1994 and 1995 by Richard Werner to recommend a policy that would expand broad credit creation. The Bank of
Japan is usually thought of as commencing QE on 19 March 2001, but it did not use the expression ‘quantitative easing’ in its official descriptions of
its policy in March 2001, and its scheme differed in key respects to Werner’s scheme of quantitative easing. In fact, Werner had predicted that mere
reserve expansion would not work after banking crises – neither would interest rate reductions or fiscal policy that is not monetised. Lyonnet, V., &
Werner, R.A. (2012). Lessons from the Bank of England on ‘quantitative easing’ and other ‘unconventional’ monetary policies. International Review
of Financial Analysis. 25, 1-17.
37 Cross, M., Fisher, P., & Weeken, O. (2010). The Bank’s balance sheet during the crisis. Bank of England Quarterly Bulletin, Q1., p. 37.
38 To protect the taxpayer, due to the uncertainty surrounding the value of mortgage-backed securities, the Bank of England imposed a ‘haircut’ on the
collateral. This meant that the banks had to post a significantly higher value of mortgage-backed securities than they received back in Treasury bills.
39 That said, if the Bank were to charge no interest on the loan and never asked for repayment the effect would be the same as permanent interest-
free money creation.
40 Although it should be noted that the Bank of England is also wholly owned by the Government, or more accurately by the Treasury Solicitor on
behalf of the Government. The Bank pays 50 per cent of its operating surpluses to the Treasury.
41 In testimony to the House of Commons Treasury Committee, Mervyn King stated that ‘Alistair Darling was adamant that the Monetary Policy
Committee not be given the authority to purchase corporate bonds, or any asset other than gilts. He was very clear about that, and that is set
out in the letter. The decision on what corporate bonds we should buy was for the Bank and we should do it in a way that did not put taxpayers’
money at risk.’ Uncorrected oral evidence, Bank of England February 2012 Inflation Report. Retrieved from http://www.publications.parliament.uk/pa/
cm201012/cmselect/cmtreasy/uc1867/uc186701.htm [accessed 29 May 2013].
42 Email response from the Bank of England Public Information and Enquiries Group, 10th
June 2013.
43 Letter from the Governor of the Bank of England to Alistair Darling, Chancellor of the Exchequer , 17 February 2009
44 Note that this is not the same as the theoretical ‘money multiplier’ effect which assumes, wrongly, that banks will increase lending by a multiple of
the increase in reserves.
45 The theory behind portfolio rebalancing was first developed by the economist James Tobin writing in the 1960s Tobin, J. (1961). Money, capital, and
other stores of value. The American Economic Review, 51(2), 26–37.
46 Tobin, J. (1969). A general equilibrium approach to monetary theory. Journal of Money, Credit and Banking, 1(1), 15–29.
47 Bowdler, C., & Radia, A. (2012). Unconventional monetary policy: the assessment. Oxford Review of Economic Policy, 28(4), 603–621.
48 Buying foreign government debt will likely push down the value of sterling. This is could be seen to be indirectly beneficial to the real economy in
terms of making exports more competitive and the Bank has on occasion pointed to the fall in sterling as a positive outcome of QE.
49 QE – this time a policy by bankers for the benefit of bankers. Retrieved from http://www.taxresearch.org.uk/Blog/2011/10/06/12264/?utm_
source=feedburner&utm_medium=feed&utm_campaign=Feed%3A+org%2FlWWh+%28Tax+Research+UK+2%29 [accessed 16 May 2013].
50 Banks would typically hold short-dated government debt (e.g. three-month Treasury bills) because they are likely to need to quickly buy or sell
reserves and thus need more liquid forms of low risk assets. As mentioned, standard Open Market Operations (OMOs) involve the Central Bank
buying and selling such debt in order to ensure there is sufficient liquidity in the banking sector.
51 The Guardian. (2013) Firms told to spend cash to boost economy, 14 April. Retrieved from http://www.guardian.co.uk/business/2012/apr/15/firms-
told-to-spend-cash-to-boost-economy [accessed 19 May 2013].
52 Kumhof, M., & Rancière, R. (2010). Inequality, leverage and crises. IMF Working Papers 1-37.
53 Bowdler, C., & Radia, A. (2012). Unconventional monetary policy: the assessment. Oxford Review of Economic Policy, 28(4), 603–621
54 Miles, D. (2011). ‘Monetary Policy and Financial Dislocation’, Speech to the Royal Economic Society, London. Retrieved from http://www.
bankofengland.co.uk/publications/Pages/speeches/2011/521.aspx
55 Joyce, M., Tong, M., & Woods, R. (2011). The United Kingdom’s quantitative easing policy: design, operation and impact. Bank of England Quarterly
Bulletin, 51(3), 200–212.
56 The scheme allowed banks to pay a fee to have the government guarantee newly issued bonds for up to five years. Under this scheme, £125 billion
of debt was guaranteed. Lloyds alone guaranteed £49 billion of new debt, and accordingly paid £498 million in fees.](https://image.slidesharecdn.com/qereportfinalweb-130704093508-phpapp01/85/Qe-report-final_web-62-320.jpg)
![Strategic quantitative easing 59
57 Prior to the commencement of QE, a demand-based ‘corridor’ system of reserves management was in operation, whereby banks would borrow a
pre-defined quantity of reserves via repos from the central bank at a rate equivalent to the bank rate. The net cost of holding reserves was thus zero.
With QE, however, the banking system was flooded with reserves and banks no longer needed to borrow from the Bank via repos. This means they
are being effectively paid by the central bank to hold reserves. This has prompted former Monetary Policy Committee member Charles Goodhart to
call for the central bank to stop paying interest on reserves or even charge a tax on such reserves. One reason the Bank may be reluctant to take
up Goodhart’s suggestion is that there would then be nothing to stop the overnight LIBOR rate falling below 0.5 per cent which is effectively the
‘floor’ set by the Bank for LIBOR. Such a drop would call into question the Bank of England’s control over market interest rates.
58 Any commercial bank is able to access reserves via the Bank’s ‘Discount Window Facility’.
59 ‘The FLS is designed to incentivise banks and building societies to boost their lending to UK households and private non-financial corporations
(PNFCs) — the “real economy”.’ Churm. R., Radia, A., Leake, J., Srinivasan, S., and Whisker, R. (2013) The Funding for Lending Scheme. Bank of
England Quarterly Bulletin 2012 Q4, 306–320.
60 News Release – Bank of England and HM Treasury announce extension to the Funding for Lending Scheme. Retrived from http://www.
bankofengland.co.uk/publications/Pages/news/2013/061.aspx
61 Joyce, M., Miles, D., Scott, A., & Vayanos, D. (2012). Quantitative Easing and Unconventional Monetary Policy–an Introduction*. The Economic
Journal, 122(564), F271–F288.
62 For critiques, see Lyonnet, V., & Werner, R.A. (2012). Lessons from the Bank of England on ‘quantitative easing’ and other ‘unconventional’ monetary
policies. International Review of Financial Analysis. 25, 1–17.
63 Goodhart, C. A., & Ashworth, J. P. (2012). QE: a successful start may be running into diminishing returns. Oxford Review of Economic Policy, 28(4), 640–670.
64 Joyce, M., Lasaosa, A., Stevens, I., & Tong, M. (2011). The financial market impact of quantitative easing in the United Kingdom. International Journal
of Central Banking, 7(3), 113-161.
65 Joyce, M., Miles, D., Scott, A., & Vayanos, D. (2012). Quantitative Easing and Unconventional Monetary Policy–an Introduction*. The Economic
Journal, 122(564), F271–F288.
66 Joyce, M., Lasaosa, A., Stevens, I., & Tong, M. (2010). ‘The Financial Market Impact of Quantitative Easing’. Bank of England WP No. 393. Retrieved
from http://www.bankofengland.co.uk/publications/
67 Pesaran, H., & Smith, R. P. (2012). ‘Counterfactual Analysis in Macroeconometrics: An Empirical Investigation into the Effects of Quantitative Easing’.
Retrieved from http://www.econ.cam.ac.uk/faculty/pesaran/wp12/PS-on-CF-16May2012.pdf
68 Joyce, M., Lasaosa, A., Stevens, I., & Tong, M. (2010). ‘The Financial Market Impact of Quantitative Easing’. Bank of England WP No. 393. Retrieved
from http://www.bankofengland.co.uk/publications/Documents/workingpapers/wp393.pdf
69 Goodhart, C. A., & Ashworth, J. P. (2012). QE: a successful start may be running into diminishing returns. Oxford Review of Economic Policy, 28(4),
640–670.
70 Joyce, M., Lasaosa, A., Stevens, I., & Tong, M. (2010). ‘The Financial Market Impact of Quantitative Easing’. Bank of England WP No. 393. Retrieved
from http://www.bankofengland.co.uk/publications/Documents/workingpapers/wp393.pdf
71 The Economist. (2013) ‘Better out than in’. 9 February. Retrieved from http://www.economist.com/news/britain/21571424-britain-open-trading-
nation-does-not-export-enough-blame-lack-medium-sized [accessed 19 May 2013].
72 Bank of England, Inflation report, February 2013, p13. Retrieved from www.bankofengland.co.uk
73 Bank of England Inflation report May 2013, p11
74 Joyce, M., Lasaosa, A., Stevens, I., & Tong, M. (2010). ‘The Financial Market Impact of Quantitative Easing’. Bank of England WP No. 393. Retrieved
from http://www.bankofengland.co.uk/publications/
75 Goodhart, C. A., & Ashworth, J. P. (2012). QE: a successful start may be running into diminishing returns. Oxford Review of Economic Policy, 28(4),
640–670.
76 In the case of Japan during the 1990s, debt and equity issuance in the capital markets increased vastly, often at times outpacing the credit
destruction. In economic theories that do not consider the role of banks as creators of the money supply this should have resulted in a positive
effect on the economy or at least no negative effect from the negative bank credit growth. However, this was not the case. See Werner, R. A.
(2004). Three Essays on Japanese Macroeconomic Policy in the 1980s and 1990s, D.Phil. Dissertation, Oxford University
77 Bank of England figures, quoted in Goodhart, C. A., & Ashworth, J. P. (2012). QE: a successful start may be running into diminishing returns. Oxford
Review of Economic Policy, 28(4), 640–670.
78 Bank of England, Inflation report February 2013, p15
79 BIS/NIESR. (2013). ‘Evaluating changes in bank lending to UK SMEs over 2001–12 — ongoing tight credit?’, pp 17-18. Retrieved from www.gov.
uk/government/uploads/system/uploads/attachment_data/file/185700/bis-13-752-evaluating-changes-in-bank-lending-to-uk-smes-2001-12.pdf;
Rejection rates in figure 10 include renewals. The rejection rate is defined as the proportion of firms which applied for credit and were either refused
outright or received less credit than they requested, as a proportion of firms applying
80 BIS/NIESR. (2013). ‘Evaluating changes in bank lending to UK SMEs over 2001–12 — ongoing tight credit?’, p. 17. Retrieved from www.gov.uk/
government/uploads/system/uploads/attachment_data/file/185700/bis-13-752-evaluating-changes-in-bank-lending-to-uk-smes-2001-12.pdf
81 Bank of England, Credit Conditions Survey Survey results, 2013 Q1, Annex 3. Corporate lending questionnaire results, p. 13.
82 Werner, R. A. (2012). Access to Finance for SMEs: What we can learn from the experience in Germany and the United States, presentation given at
the Institute of Welsh Affairs on 23 October 2012 at a conference organised by the Federation of Small Businesses
83 Bank England, Funding for Lending, Usage and lending data. Retrieved from http://www.bankofengland.co.uk/markets/Pages/FLS/data.aspx
84 BBC News. (2012) ‘Bank of England hands QE income to Treasury’. 9 November. Retrieved from http://www.bbc.co.uk/news/business-20268679
[accessed 19 May 2013].
85 Murphy, R. (2012). ‘The untold truth about quantitative easing is it simply cancels debt – and that means national debt is now just 45.1% of GDP’.
Retrieved from http://www.taxresearch.org.uk/Blog/2012/07/13/the-untold-truth-about-quantitative-easing-is-it-simply-cancels-debt-and-that-
means-national-debt-is-now-just-45-1-of-gdp [accessed 19 Mary 2013].](https://image.slidesharecdn.com/qereportfinalweb-130704093508-phpapp01/85/Qe-report-final_web-63-320.jpg)
![Strategic quantitative easing 60
86 ONS, Public Sector Finances, March 2013.
87 Goodhart, C. A., & Ashworth, J. P. (2012). QE: a successful start may be running into diminishing returns. Oxford Review of Economic Policy, 28(4),
640–670.
88 Bank of England. (2012). ‘The Distributional effect of asset purchases’. Quarterly Bulletin 2012, Q3.
89 The Guardian. (2012). Britain’s richest 5% gained most from quantitative easing – Bank of England. 23 August. Retrieved from http://www.guardian.
co.uk/business/2012/aug/23/britains-richest-gained-quantative-easing-bank [accessed 19 May 2013].
90 Hayes, P., (2013). ‘The policy limitations of Quantitative Easing and the need for new forms of unconventional Monetary Policy’. Submission to the
Treasury Select Committee. Retrieved from http://www.publications.parliament.uk/pa/cm201213/cmselect/cmtreasy/writev/qe/m11.htm [accessed
28 May 2013].
91 Consumer Credit Counselling Service. (2011). Debt and Household Incomes. Leeds: Foundation for Credit Counselling, quoted in Hayes, P., (2013).
‘The policy limitations of Quantitative Easing and the need for new forms of unconventional Monetary Policy’. Submission to the Treasury Select
Committee. Retrieved from http://www.publications.parliament.uk/pa/cm201213/cmselect/cmtreasy/writev/qe/m11.htm [accessed 28 May 2013].
92 87
Hayes, P., (2013). ‘The policy limitations of Quantitative Easing and the need for new forms of unconventional Monetary Policy’. Submission to the
Treasury Select Committee. Retrieved from http://www.publications.parliament.uk/pa/cm201213/cmselect/cmtreasy/writev/qe/m11.htm [accessed
28 May 2013].
93 Bank of England. (2012). ‘The Distributional effect of asset purchases’. Quarterly Bulletin 2012, Q3, Volume 52 No. 3. p258.
94 Ibid. p261.
95 Pension Corporation. (2011). ‘QE’s Impact on Pension Fund Liabilities’. Retrieved from http://www.pensioncorporation.com/sites/default/files/files/
Pension_Corp_-_QEs_impact_on_pension_fund_liabilities_FINAL.pdf quoted in Goodhart, C. A., & Ashworth, J. P. (2012). QE: a successful start may
be running into diminishing returns. Oxford Review of Economic Policy, 28(4), 640–670.
96 Goodhart, C. A., & Ashworth, J. P. (2012). QE: a successful start may be running into diminishing returns. Oxford Review of Economic Policy, 28(4),
640–670.
97 The Guardian. (2013). Firms told to spend cash to boost economy. 14 April. Retrieved from http://www.guardian.co.uk/business/2012/apr/15/firms-
told-to-spend-cash-to-boost-economy [accessed 19 May 2013].
98 Tett, G. (2013). ‘Markets Insight: Phoney QE peace masks rising risk of instability’. The Financial Times, 16 May. Retrieved from http://www.ft.com/
cms/s/0/0810ce9a-be2c-11e2-9b27-00144feab7de.html#axzz2UOWBHOi7 [accessed 29 May 2013].
99 King, M. (2013) ‘Mind the gap: Investing in repressed markets’. Citigroup Research. Retrieved fromhttps://ir.citi.com/I5WkH80XEO1nCEn9ZS7JFkVd
uj3KCtPeOlssZz3N3Z0%3D
100 The Telegraph. (2013). BIS and IMF attacks on Quantitative Easing deeply misguided warn monetarists’. 28 May. Retrieved from http://www.
telegraph.co.uk/finance/economics/10067080/BIS-and-IMF-attacks-on-quantitative-easing-deeply-misguided-warn-monetarists.html
101 World Bank. (2012). Remaining Resilient. New York: The World Bank: New York, p. 6.
102 IMF. (2013). ‘Unconventional Monetary Policies – Recent Experiences and Prospects’. 16 May, p, 21. Retrieved from http://www.imf.org/external/pp/
longres.aspx?id=4764 [accessed 28 May 2013].
103 Hayes, P. (2013). ‘The policy limitations of Quantitative Easing and the need for new forms of unconventional Monetary Policy’. Submission to the
Treasury Select Committee. Retrieved from http://www.publications.parliament.uk/pa/cm201213/cmselect/cmtreasy/writev/qe/m11.htm [accessed
28 May 2013].
104 World Bank. (2012). Remaining Resilient. East Asia and Pacific Economic Update 2012, volume 2, New York: The World Bank, p. 7.
105 This methodology is a development of Voutsinas, K., & Werner R. A. (2010). The Effectiveness of ‘Quantitative Easing’ and the Accountability of the
Central Bank in Japan. Paper presented at the Infinity 2010 Conference Dublin, Trinity College Dublin, 14 June 2010. Lyonnet, V., and Werner, R.
(2012)”Lessons from the Bank of England on ‘quantitative easing’and other ‘unconventional’monetary policies.” International Review of Financial
Analysis 25, 1-17; and Bernardo, G., Ryan-Collins, J., and Werner, R., (2013), UK QE Reconsidered, University of Southampton Working Paper and
Josh Ryan-Collins’ doctoral thesis at the University of Southampton.
106 Lyonnet, V., & Werner, R. (2012). Lessons from the Bank of England on ‘quantitative easing’ and other ‘unconventional’monetary policies.
International Review of Financial Analysis, 25, 1–17.
107 Bernardo, G., Ryan-Collins, J., & Werner, R. (2013). UK QE Reconsidered. University of Southampton Working Paper and Josh Ryan-Collins’ doctoral
thesis at the University of Southampton.
108 Downloadable from the nef website
109 In accordance with the rule of ‘Ockham’s razor’, parsimonious here refers to the principle that assumptions introduced to explain a thing must not
be multiplied beyond necessity, and hence the simplest of several hypotheses is always the best in accounting for unexplained facts.
110 Werner, R. (2005). New Paradigm in Macroeconomics. Basingstoke: Palgrave Macmillan.
111 Automatic stabilisers describe changes in taxation and government spending (fiscal policy) that occur to smooth out the effects of fluctuations in
GDP growth. Because many taxes, such as income tax, corporate tax and VAT are based upon output and/or are progressive, a recession has the
effect of proportionately reducing the proportion of such taxes taken out of the economy. In addition, government spending automatically increases
during a recession due to increased welfare and unemployment benefits, creating economic multiplier effects. The combined effect is an increase
the government deficit to counter falls in private output. The opposite process applies during booms. See Sullivan, A., & Sheffrin, S.M. (2003).
Economics: Principles in action. Upper Saddle River, New Jersey 07458: Pearson Prentice Hall. p. 399.
112 Bank of England
113 Carnevali, F. and L. Hannah (1995). ‘The effects of banking cartels and credit rationing on UK industrial structure and economic performance since
World War Two.’ Anglo-American Financial Systems. M. D. Bordo and. R. Sylla. Burr Ridge, Ill : Irwin Professional Pub, Illinois, Homewood.; Baker, M.
and M. Collins (2010). “English Commercial Banks and Organizational Inertia: The Financing of SMEs, 1944–1960.” Enterprise and Society 11(1):
65-97.](https://image.slidesharecdn.com/qereportfinalweb-130704093508-phpapp01/85/Qe-report-final_web-64-320.jpg)
![Strategic quantitative easing 61
114 Clark, E.R. (1983). Industrial Development Bank: A History of Canada’s Industrial Development Bank. Buffalo, NY: University of Toronto Press, p. 93.
115 Chase, S. (1943). When the War Ends: Where’s the money coming from? Problems of postwar finance (Vol. 3). New York: Twentieth Century Fund.,
p. 43.
116 Bank of England, Quarterly Inflation Report Q&A 13th February 2013. Retrieved from http://www.bankofengland.co.uk/publications/Pages/
inflationreport/2013/ir1302.asp
117 As also concluded by Lyonnet, V., & Werner, R.A. (2012). Lessons from the Bank of England on ‘quantitative easing’ and other ‘unconventional’
monetary policies. International Review of Financial Analysis. 25, 1–17.
118 As suggested by Werner, R. A. (2012). Towards a new research programme on ‘banking and the economy’ – Implications of the Quantity Theory of
Credit for the prevention and resolution of banking and debt crises. International Review of Financial Analysis (In Press)
119 As suggested by Werner, R. A. (2005), New Paradigm in Macroeconomics, Basingstoke: Palgrave Macmillan.
120 Bank of England Quarterly Inflation Report press conference Q&A – 15th May 2013. Retrieved from http://www.bankofengland.co.uk/publications/
Pages/inflationreport/2013/ir1302.aspx
121 Bank of England News Release – Financial Policy Committee statement from its policy meeting, 19 March 2013. Retrieved fromhttp://www.
bankofengland.co.uk/publications/Pages/news/2013/013.aspx
122 This policy was suggested by Werner in the 1990s in Japan, such as in Werner, R. A. (1998), Minkanginkoukarano kariire de keikitaisaku wo
okonaeba issekinichou (Effective stimulation policy via government borrowing from commercial banks), Economist (Japan), 14 July 1998.
123 See also Werner, R. A. (2009), Financial Crises in Japan during the 20th Century. Bankhistorisches Archiv, Beiheft 47, pp. 98-123.
124 Werner, R. A. (2012), How to end the European crisis – at no further cost and without the need for political changes. Southampton, University of
Southampton (Centre for Banking, Finance and Sustainable Development Policy Discussion Paper, 2-12).
125 See also Fawley, B. W., & Neely, C. J. (2013). Four stories of quantitative easing. Review, Federal Reserve Bank of St Louis, pp. 51–88.
126 Quarterly Inflation Report press conference Q&A – 15th May 2013 (p. 23). Retrieved from http://www.bankofengland.co.uk/publications/Pages/
inflationreport/2013/ir1302.aspx
127 Lord Lawson and The Archbishop of Canterbury Justin Welby – see the Guardian, 6 May 2013, ‘Vince Cable: Consider RBS break-up to increase
banking competition’. Retrieved from http://www.guardian.co.uk/business/2013/may/04/vince-cable-rbs-break-up
128 Nelson, E. (2013).Key aspects of longer-term asset purchase programs in UK and US monetary policy. Oxford Economic Papers 65.suppl 1 (2013):
i92-i114. Retrieved from http://oep.oxfordjournals.org/content/65/suppl_1/i92.abstract [accessed 21 April 2013].
129 Jones, K. A. (2013). ‘The Fed’s Exit Strategy’ , Charles Schwab. Retrived from http://www.schwab.com/public/schwab/resource_center/expert_
insight/schwab_investing_brief/fed_and_bonds/feds_exit_strategy.html [accessed 6 May 2013].
130 Gertler, M., &Karadi, P. (2013). vs. 2 vs. 3...: A Framework for Analyzing Large-Scale Asset Purchases as a Monetary Policy Tool. International Journal
of Central Banking, 9(1) 5–53.
131 Stein, Jeremy, C., ‘Evaluating Large-Scale Asset Purchases’, Remarks to The Brookings Institution, Washington, D.C., October 11, 2012
132 Werner, R. A. (2009), Financial Crises in Japan during the 20th Century. Bankhistorisches Archiv, Beiheft 47, pp. 98-123.
133 In greater detail: Werner, R. A. (2003), Princes of the Yen: Japan’s Central Bankers and the Transformation of the Economy, Armonk, NY: M. E. Sharpe.
134 Any remaining claims on non-residents were, among other demands, reinforced later in the Treaty of Versailles. German reparation payments for
World War I were completed only in 2012, just short of the centenary of the outbreak of the Great War. See Werner, R. A. (2013), UK banking in
World War One, CBFSD Discussion Paper (forthcoming).
135 These have included:
1) ‘Green’ Quantitative Easing proposals:
Murphy, R., & Hines, C. (2010). ‘Green quantitative easing: Paying for the economy we need’ Finance for the Future, retrieved from at:
www.financeforthefuture.com/GreenQuEasing.pdf
Werner, R. (2012). Time for Green Quantitative Easing: How to Generate Green, Sustainable Growth at No Cost. Policy News, University of
Southampton, retrieved from http://www.greennewdealgroup.org/?p=175
The Guardian, 26 June 2012, ‘Sir David King: quantitative easing should be aimed at green economy’, retrieved from http://www.guardian.
co.uk/environment/2012/jun/26/david-king-quantitative-easing-green
2) Using Central Bank money to directly finance government expenditure
Turner, A, (2013) ‘Debt, Money and Mephistoles,: How do we get out of this mess?’, Speech to Cass Business School, 6th February 2013
3) Full-reserve banking proposals – see Kumhoff, M. (2012). The Chicago School Revisited. IMF Working Paper and Jackson, D. & Dyson, B.
(2013). Modernising Money, London: Positive Money
136 Bank of England Interactive Database – ‘Annual amounts outstanding of UK residential monetary financial institutions lending” to respective sectors:
codes RPQTBVD, RPQTBVE, RPQTBVF, RPAB6PT, RPAB8F, RPATBVI and RPATBUA. Adjustments were made to figures on secured lending (code
RPATBVX) to reflect changes in the Bank of England’s reporting of covered bonds and securitised loans. Retrieved from http://www.bankofengland.
co.uk/mfsd/iadb/notesiadb/Industrial.htm
137 The Guardian, Vince Cable urges greater capital spending. Retrieved from http://www.guardian.co.uk/politics/2013/mar/03/vince-cable-capital-
spending [accessed 3 May 2013]. The OBR’s Autumn Statement forecast was that net investment in 2012/2013 would be £21.8 billion (adjusting for
the impact of financial transactions relating to the Asset Purchase Facility and Royal Mail, which is 24.0 per cent below last year’s level.
138 See for example Besley, T., & Van Reenen, J. (2013). Investing in UK prosperity: skills, infrastructure and innovation can get us out of the current
stasis. British Politics and Policy at LSE. London: LSE
139 Nash, D. & Dolphin, T. (2012). Investing for the future: Why we need a British Investment Bank. London: IPPR.
140 Bank of England. (2013). Funding for Lending Scheme extension: worked examples of borrowing allowance and fee. Retrieved from http://www.
bankofengland.co.uk/markets/Documents/flsworkedexample2.pdf](https://image.slidesharecdn.com/qereportfinalweb-130704093508-phpapp01/85/Qe-report-final_web-65-320.jpg)
![Strategic quantitative easing 62
141 EU law prevents CBs directly financing government debt (via primary purchasing) or expenditure. But it does not prevent purchase of equity in
‘publically owned credit institutions’ which have credit creation powers and are treated in the same way as private banks under EU law.
142 Carrington, D. (2012). ‘How the Green Investment Bank really works’. The Guardian 24 May, Environment Blog. Retrieved from www.guardian.co.uk/
environment/damian-carrington-blog/2012/may/24/green-investment-bank-energy-efficiency?CMP=twt_gu [accessed 7 June 2013].
143 Mazzacuto, M. (2012). ‘Public money spent on ‘digging ditches’ won’t stimulate the economy, The Guardian, Comment is Free, 2nd September.
Retrieved from www.guardian.co.uk/commentisfree/2012/sep/02/state-spending-digging-ditches-transform-economy A recent review of publically
owned banks showed a positively correlation with economic growth, contradicting much earlier academic work.
144 A recent review of publically owned banks showed a positively correlation with economic growth, contradicting much earlier academic work.
Andrianova S., Demetriades, P., & Shortland, A. (2012). Government ownership of banks, institutions and economic growth. Economica, 79.315,
449–469.
145 Carrington, D. (2012). ‘How the Green Investment Bank really works’. The Guardian 24 May, Environment Blog. Retrieved from
www.guardian.co.uk/environment/damian-carrington-blog/2012/may/24/green-investment-bank-energy-efficiency?CMP=twt_gu
[accessed 7 June 2013].
146 Business Development Bank of Canada, official website. Retrieved from http://www.bdc.ca/EN/about/overview/history/Pages/pioneer_years.aspx
[accessed 14 February 2013].
147 Canadian Parliament, 8 George VI, c. 44 (I944), p. 383. Quoted in Fergusson, D. (1948). The Industrial Development Bank of Canada. Journal of
Business of the University of Chicago, 21, 214–229.
148 Clark, E. R. (1985). The IDB: A History of Canada’s Industrial Development Bank. Buffalo, NY: University of Toronto Press., p. 21.
149 Ibid., p. 7.
150 Ibid.
151 Ibid., p. 83.
152 Green, B. (2011). Mr Cameron, here’s how to build 500,000 homes and net £10 billion for the Treasury – well maybe. Retrieved from
http://brickonomics.building.co.uk/2011/10/mr-cameron-heres-how-to-build-500000-homes-and-net-10-billion-for-the-treasury-well-maybe/
[acccessed 29 May 2013].
153 Darrington, M. (2013). ‘With £100bn of quantitative easing cash we could rebuild Britain brick by brick’, The Telegraph. Retrieved from
http://www.telegraph.co.uk/finance/financialcrisis/9923427/With-100bn-of-quantitative-easing-cash-we-could-rebuild-Britain-brick-by-brick.html
[accessed 29 May 2013].
154 To have or have not? Taking responsibility for tomorrow’s affordable homes today, Independent Inquiry into the Affordable Homes Crisis. Retrieved
from http://www.housingvoice.co.uk/ [accessed 3 May 2013], pp. 29–30.
155 LEK Consulting. (2010). Construction in the UK economy, in CBI. (2012). ‘Bridging the Gap: Backing the construction sector to generate jobs’.
Retrieved from www.cbi.org.uk
156 Ibid.
157 ONS, Construction statistics – annual report, No. 12, 2011 Edition
158 LEK Consulting. (2010). Construction in the UK economy, in CBI. (2012). ‘Bridging the Gap: Backing the construction sector to generate jobs’.
Retrieved from www.cbi.org.uk
159 Ibid.
160 NOMIS official labour market statistics. Retrieved from http://www.nomisweb.co.uk/articles/733.aspx
161 http://www.guardian.co.uk/society/2013/may/19/uk-spends-2bn-housing-homeless-short-term?INTCMP=SRCH
162 Green, B. (2011). Mr Cameron, here’s how to build 500,000 homes and net £10 billion for the Treasury – well maybe. Retrieved from
http://brickonomics.building.co.uk/2011/10/mr-cameron-heres-how-to-build-500000-homes-and-net-10-billion-for-the-treasury-well-maybe/
[acccessed 29 May 2013].
163 Bank of England. (2013). ‘Funding for Lending Scheme extension: worked examples of borrowing allowance and fee’. Retrieved from http://www.
bankofengland.co.uk/markets/Documents/fls-workedexample2.pdf
164 To have or have not? Taking responsibility for tomorrow’s affordable homes today, Independent Inquiry into the Affordable Homes Crisis. Retrieved
from http://www.housingvoice.co.uk/ [accessed 3 May 2013], p29-30. The estimation is based upon using ‘The combined effect of these two
measures would be to provide £3bn of grants to support the development of new social rented housing (using the National Affordable Housing
Programme Model this delivers 50,000 new social rented homes). Combining this with reductions in the costs of the borrowing for social rented
housing developments through Quantitative Easing could increase this to approximately 60,000 new homes and would enable developments that
are currently stalled to proceed.’The public services Union Unison has made a similar call.
165 Green, B. (2011). Mr Cameron, here’s how to build 500,000 homes and net £10 billion for the Treasury – well maybe. Retrieved from
http://brickonomics.building.co.uk/2011/10/mr-cameron-heres-how-to-build-500000-homes-and-net-10-billion-for-the-treasury-well-maybe/
[acccessed 29 May 2013].
166 Wright, M. (2006) The Policy Origins of the Reserve Bank of New Zealand, Reserve Bank of New Zealand Bulletin, 69/3, September 2006. P18.
167 Source: New Zealand Long Term Data Series, Series E.1.1 Nominal Gross Domestic Product, table G.2.1 (consolidated accounts from a range of
sources). Retrieved from http://www.stats.govt.nz/browse_for_stats/economic_indicators/NationalAccounts/long-term-data-series/national-income.
aspx
168 Greasley and Oxley develop a counterfactual measure of the money supply (M1) and M1 velocity in the 1930s based upon projecting a pre-1930
model with the UK GDP deflator as a paroxy for what would have happened to prices in New Zwealand had the old regime been maintained. They
find that New Zealand’s nominal money stock M1, which fell between 1923 and 1929, actually doubled between 1929 and 1939 and estimate that
had the old, sterling backed regime survived, New Zeland’s GDP per capita in 1938 would have been around one third lower. See Greasley, D. &
Oxley, L. (2002) Regime shift and fast recovery on the periphery: New Zealand in the 1930s. The Economic History Review, Volume 55, Issue 4,
pages 697–720, November 2002](https://image.slidesharecdn.com/qereportfinalweb-130704093508-phpapp01/85/Qe-report-final_web-66-320.jpg)
![Strategic quantitative easing 63
169 Gibb, K., Maclennan, D. and Mark Stephens, M. (2013). ‘Innovative financing of affordable housing’, Joseph Rowntree Foundation. Retrieved from
www.jrf.org.uk/sites/files/jrf/affordable-housing-finance-full.pdf [accessed 3 May 2013], pp. 50–53.
170 Williams et al., 2011
171 For an analysis of the problems with UK housing, see Lloyd, T. (2009). Don’t bet the house on it: No turning back to housing boom and bust,
Compass. Retrieved from http://clients.squareeye.net/uploads/compass/documents/Compass%20Housing%20web.pdf
172 Green, B. (2012). ‘Why calling for housing QE is not special pleading: Part 2’, 5 March 2012. Retrieved from http://brickonomics.building.
co.uk/2012/03/why-calling-for-housing-qe-is-not-special-pleading-part-2
173 For interesting discussions of international alternatives see Lewis, M. & Conaty, P. (2012). The Resilience Imperative, Ch 4, British Columbia: New
Society Publishers.
174 Bateman, L. (2013). First Green Deal Plan ‘good to go’, says Green Deal Finance Company chief. Retrieved from http://www.greenwisebusiness.
co.uk/news/first-green-deal-plan-good-to-go-says-green-deal-finance-company-chief-3895.aspx
175 Green Deal Initiative (no date). Who will finance green deal loans? Retrieved from http://www.greendealinitiative.co.uk/frequently-asked-questions-f-
a-q/who-will-finance-green-deal-loans/
176 BBC News. (2013). Only 200 homes signed up for Green Deal energy loans. Retrieved from http://www.bbc.co.uk/news/uk-politics-22815902
177 Schröder, M., Ekins, P., Power, A., Zulauf, M., & Lowe, R. (2011). The KfW experience in the reduction of energy use in and CO2 emissions from
buildings: operation, impacts and lessons for the UK. London: UCL, p. 51.
178 Posen A. (2011). Speech given by Adam Posen, External Member of the Monetary Policy Committee, Bank of England at Wotton-under-Edge,
Gloucestershire. 13 September. Retrieved from www.bankofengland.co.uk/publications/speeches
179 The Treasury’s review of the Monetary Policy remit examines a number of possible alternatives to inflation targeting for the Bank of England but
concludes the current regime remains the preference: HMT, March 2013, Review of the monetary policy framework. Retrieved from https://www.gov.
uk/government/publications/review-of-the-monetary-policy-framework [accessed 20 May 2013].
180 Some commentators had argued that increased central bank independence and legal powers were in fact causing greater incidents of property
and asset boom-bust cycles. Werner R. A. (2003) warned, for instance, that the unprecedented degree of independence of the ECB was likely
to result in the generation of vast credit boom-bust cycles and banking crises. The crises in Eurozone countries such as Ireland, Portugal, Spain
and Greece was due to the build-up of excessive credit growth for non-GDP transactions. As the Quantity Theory of Credit indicates, this is never
sustainable and results in banking and economic crises. However, central banks are the decisive decision-makers that could have prevented these
problems. Werner, R. A. (2003), Princes of the Yen: Japan’s Central Bankers and the Transformation of the Economy, Armonk, NY: M. E. Sharpe.
181 The Federal Reserve was created in 1913 by private bankers who gathered at a secret meeting on Jekyll Island, Georgia in 1910. Although over time it has
become a quasi-public system, to this day, the 12 regional Federal Reserve Banks, which are in charge of regulating banks, are owned and governed by
their member banks. Many decisions about international financial regulation and banking are taken by the Bank of International Settlements (BIS) a private
grouping of the worlds’ central bankers based in Switzerland which is not accountable to any parliament or democratic body.
182 Epstein, G., & Yeldan, E. (2008). Inflation targeting, employment creation and economic development: assessing the impacts and policy
alternatives. International Review of Applied Economics, 22(2), 131–144.
183 Although Montagu Norman, the Bank of England’s longest serving Governor (1920–1944), maintained that the bank acted in the public interest
even when it was privately owned.
184 Bank of England (no date). Bank of England Act 1946, p. 1. Retrieved from http://www.bankofengland.co.uk/about/Documents/legislation/1946act.
pdf [accessed 19 April 2013].
185 In 1998, the Government used the Retail Price Index (RPI) inflation target of 2.5 per cent.The target has changed to 2 per cent since the Consumer
Price Index (CPI) replaced the Retail Prices Index as the Treasury’s inflation index. If inflation overshoots or undershoots the target by more than 1
per cent, the Governor has to write a letter to the Chancellor explaining why, and how he will remedy the situation.
186 As set out in a letter from the Governor of the Bank of England to the Chancellor fo the Exchanquer, 21 June 2012 Retrieved from
http://www.bankofengland.co.uk/monetarypolicy/Documents/pdf/chancellorletter120321.pdf [accessed 20 May 2013].
187 Letter from the Chancellor to the Governor laying out the Monetary Policy Remit, 20 March 2013, p. 4. Retrieved from
https://www.gov.uk/government/publications/monetary-policy-remit-2013 [accessed 20 May 2013].
188 Bank of England (no date). Governance. Retrieved from http://www.bankofengland.co.uk/about/Pages/governance/default.aspx [accessed 21 April
2013].
189 Speech given by Mervyn King, Governor of the Bank of England to the South Wales Chamber of Commerce at The Millennium Centre, Cardiff 23
October 2012, pp. 5–6. Retrieved from www.bankofengland.co.uk/publications/speeches/ [accessed 28 April 2013].
190 Werner, R.A. (2005). New Paradigm in Macroeconomics. Basingstoke: Palgrave Macmillan.
191 Schularick, M. H., & Taylor, A. M. (2012). Credit Booms Gone Bust Monetary Policy, Leverage Cycles, and Financial Crises, 1870-2008. American
Economic Review, American Economic Association, vol. 102(2), pages 1029-61, April
192 Turner, A. (2013). Debt, Money and Mephistoles,: How do we get out of this mess?, Speech to Cass Business School, 6th February 2013.
193 Ryan-Collins, J., Greenham, T., Werner, R. A., & Jackson, A. (2012) Where Does Money Come From? (2nd edition). London: nef (the new
economics foundation).
194 Holmes, A. R. (1969). Operational constraints on the stabilization of money supply growth. Controlling Monetary Aggregates, 65-77., p. 72. Retrieved
from http://www.bos.frb.org/economic/conf/conf1/conf1i.pdf
195 The Guardian (2011) What is Credit Easing? 3 October. Retrieved from http://www.guardian.co.uk/business/2011/oct/03/what-is-credit-easing
[accessed 28 May 2013].
196 Goodhart, C. A., & Ashworth, J. P. (2012). QE: a successful start may be running into diminishing returns. Oxford Review of Economic Policy, 28(4), 654.
197 The two authors were supportive of the scheme – see Ashworth, J., & Goodhart, C. A. E. (2011). Credit Easing—What Could the Chancellor Do?
Morgan Stanley Research, available on request from authors.](https://image.slidesharecdn.com/qereportfinalweb-130704093508-phpapp01/85/Qe-report-final_web-67-320.jpg)
![Strategic quantitative easing 64
198 Bank of England. (2013). The Financial Policy Committee’s powers to supplement capital requirements, a draft policy statement, p.9. Retrieved from
http://www.bankofengland.co.uk/financialstability/Pages/fpc/default.aspx [accessed 20 May 2013].
199 Bank of England. (2013). The Financial Policy Committee’s powers to supplement capital requirements, a draft policy statement. Appendix, p. 40.
Retrieved from http://www.bankofengland.co.uk/financialstability/Pages/fpc/default.aspx [accessed 20 May 2013].
200 In its recent report on the state of the UK economy, the IMF argued that the powers of the FPC should be extended to allow it to regulate loan-
to-value and loan-to-income ratios on mortgages, fearing that adjustments to capital ratios would not be enough to stop property bubbles – see
United Kingdom—2013 Article IV Consultation Concluding Statement of the Mission, 22 May 2013. |
Retrieved from http://www.imf.org/external/np/ms/2013/052213.htm
201 Haldane, A. (2011). ‘Risk Off’. Speech, 18 August. Retrieved from www.economia.puc-rio.br
202 Turner, A. (2012). Credit creation and social optimality. International Review of Financial Analysis, 25, 142–153.
203 Croome, D. R., & Johnson, G. J., (eds) (1970). Money in Britain 1959–69: The papers of the ‘Radcliffe report – ten years after’ conference at Hove,
Sussex, October 1969. London: Oxford University Press, p. 225.
204 Dow, J.C.R. (1970). The management of the British Economy, 1945-60, Cambridge: Cambridge University Press, pp. 235-242.
205 In a recent article Charles Goodhart recalls arrangements upon first entering the Bank of England as a young economists in 1968: ‘When I first
entered the Bank of England in 1968, as an economist on secondment from the London School of Economics (LSE), the relative roles of the Bank
of England and the Treasury (HMT) in the conduct of monetary policy, of debt management, and of financial stability were very different from what
they are now… The main control on bank lending, and hence monetary expansion, was, however, direct ceilings on bank lending to the private
sector. These were argued over, and decided, between HMT, and the Chancellor, and the Bank, with HMT generally asking for tougher limits, to
protect the exchange rate, reduce inflation, etc., and the Bank, which had to administer the ceilings, seeking more flexible ceilings.’ In Goodhart, C.
(2012). Monetary policy and public debt, Banque de France. Financial Stability Review, 16.
206 Ryan-Collins, J., Greenham, T., Werner, R. A., & Jackson, A. (2012) Where Does Money Come From? (2nd edition). London: nef (the new
economics foundation), pp 110-112.
207 World Bank. (1993). The East Asian Miracle, Economic Growth and Public Policy. Oxford: Oxford University Press.
208 Epstein, G. A., & Yeldan, A. E. (Eds.). (2010). Beyond inflation targeting: Assessing the impacts and policy alternatives. Cheltenham: Edward Elgar
Publishing.
209 Davies, G. (2013). Micro but not macro effects from the new Funding for Lending scheme. Financial Times, 24 April. Retrieved from
http://blogs.ft.com/gavyndavies/2013/04/24/micro-but-not-macro-effects-from-the-new-funding-for-lending-scheme
210 Authors’ email correspondence with the Bank of England, 20 May 2013.
211 Authors’ email correspondence with the Bank of England, 20 May 2013.
212 Bank of England. (2012). Quarterly Inflation Report Q&A. 15 February 2012, pp. 21–22.
213 Uncorrected oral evidence, Bank of England February 2012 Inflation Report. Retrieved from http://www.publications.parliament.uk/pa/cm201012/
cmselect/cmtreasy/uc1867/uc186701.htm [accessed 29 May 2013].
214 Annual Report 2011/2012, Bank of England Asset Purchase Facility Fund Limited.
215 Reuters. (2013).‘King Reigns Unchallenged at BoE Due to Lax Regime, Posen Says’. 13 January 2013. Retrived from http://www.bloomberg.com/
news/2013-01-22/king-reigns-unchallenged-at-boe-due-to-lax-regime-posen-says.html
216 Bank of England. (2013). Bank of England and HM Treasury announce extension to the Funding for Lending scheme. Retrieved from
http://www.bankofengland.co.uk/publications/Pages/news/2013/061.aspx
217 Letter from the Chancellor to the Governor laying out the Monetary Policy Remit, 20 March 2013, p. 4. Retrieved from https://www.gov.uk/
government/publications/monetary-policy-remit-2013 [accessed 20 May 2013].
218 Fisher, P. (2013). Speech to the Cardiff Breakfast Club, St David’s Hotel, Cardiff, 24 May 2013, p.4. Retrieved from www.bankofengland.co.uk/
publications/Pages/speeches/default.aspx [accessed 31 May 2013].
219 Bank of England, Inflation Report February 2013, p. 28.
220 Innman, P. (2011). ‘How the world paid the hidden cost of America’s quantitative easing’, The Guardian, 29 June. Retrieved from
http://www.guardian.co.uk/business/2011/jun/29/how-world-paid-hidden-cost-america-quantitative-easing
221 Bank of England. (2013). Inflation Report May 2013, p. 30. Surveys by the Bank of England, British Chambers of Commerce, Confederation of British
Industry, PwC and Office of National Statistics.
222 R.A. (2013) The mystery of stable prices. Retrieved from http://www.economist.com/blogs/freeexchange/2013/04/monetary-policy-1
223 Another explanation is that credit creation for financial transactions has been spilling over into the real economy, for instance via mortgages and
equity withdrawal, or the high bonuses in the financial sector, which are used for conspicuous consumption and purchases of property, allowing
continued equity withdrawal by a larger part of the economy, further boosting consumption.
224 Fisher, P. (2013). Speech to the Cardiff Breakfast Club, St David’s Hotel, Cardiff, 24 May 2013, p.4. Retrieved from www.bankofengland.co.uk/
publications/Pages/speeches/default.aspx [accessed 31 May 2013]. p7
225 HM Treasury. (2013). Review of the monetary policy framework. London: The Stationery Office. Retrieved from https://www.gov.uk/government/
publications/monetary-policy-remit-2013 [accessed 20 May 2013].
226 Turner, A. (2013). Debt, Money and Mephistopheles: How Do We Get Out of This Mess? speech to CASS Business School on 6 February. Retrieved
from http://www.fsa.gov.uk/static/pubs/speeches/0206-at.pdf
227 Keynes, J.M. (1895). A Treatise on Money, VII. London: AC Black; New York: Macmillan & Co. p.197.](https://image.slidesharecdn.com/qereportfinalweb-130704093508-phpapp01/85/Qe-report-final_web-68-320.jpg)


The document discusses strategic quantitative easing (QE) as a method to stimulate investment and rebalance the UK economy, critiquing existing policies for their ineffectiveness in driving growth. It suggests that QE should be focused on direct funding for productive investments, such as housing and infrastructure, rather than merely lowering interest rates without real economic impact. The report also proposes governance reforms to better align monetary policy with economic needs, emphasizing the necessity of a more targeted approach to QE.


