The document discusses quantitative analysis using Fourier transform infrared (FTIR) spectroscopy. It covers topics like sampling techniques, baseline correction, curve fitting, and quantification. Specifically, it describes how FTIR can be used to determine the fraction of interacting groups, like carbonyl groups hydrogen bonded to phenolic groups, in a blended polymer system.
Scheme Introduction toquantitative analysis and sources Sampling techniques for FTIR spectrometer Base Line correction: Problems and their solutions Curve fitting and its practical applications Absorpitivity Ratios and Quantification References
3.
Introduction to QuantitativeAnalysis FTIR is commonly used for qualitative analysis You must be aware of this type of analysis before going towards quantitative analysis The probe size of FTIR is ideal for the study of phase behavior of polymers (i.e, Moleculer vibrations and size scale is in angstrom) It can characterize the nature and strength of strong interactions. It can determine the fraction of interacting groups in a certainly H-bonded system.
4.
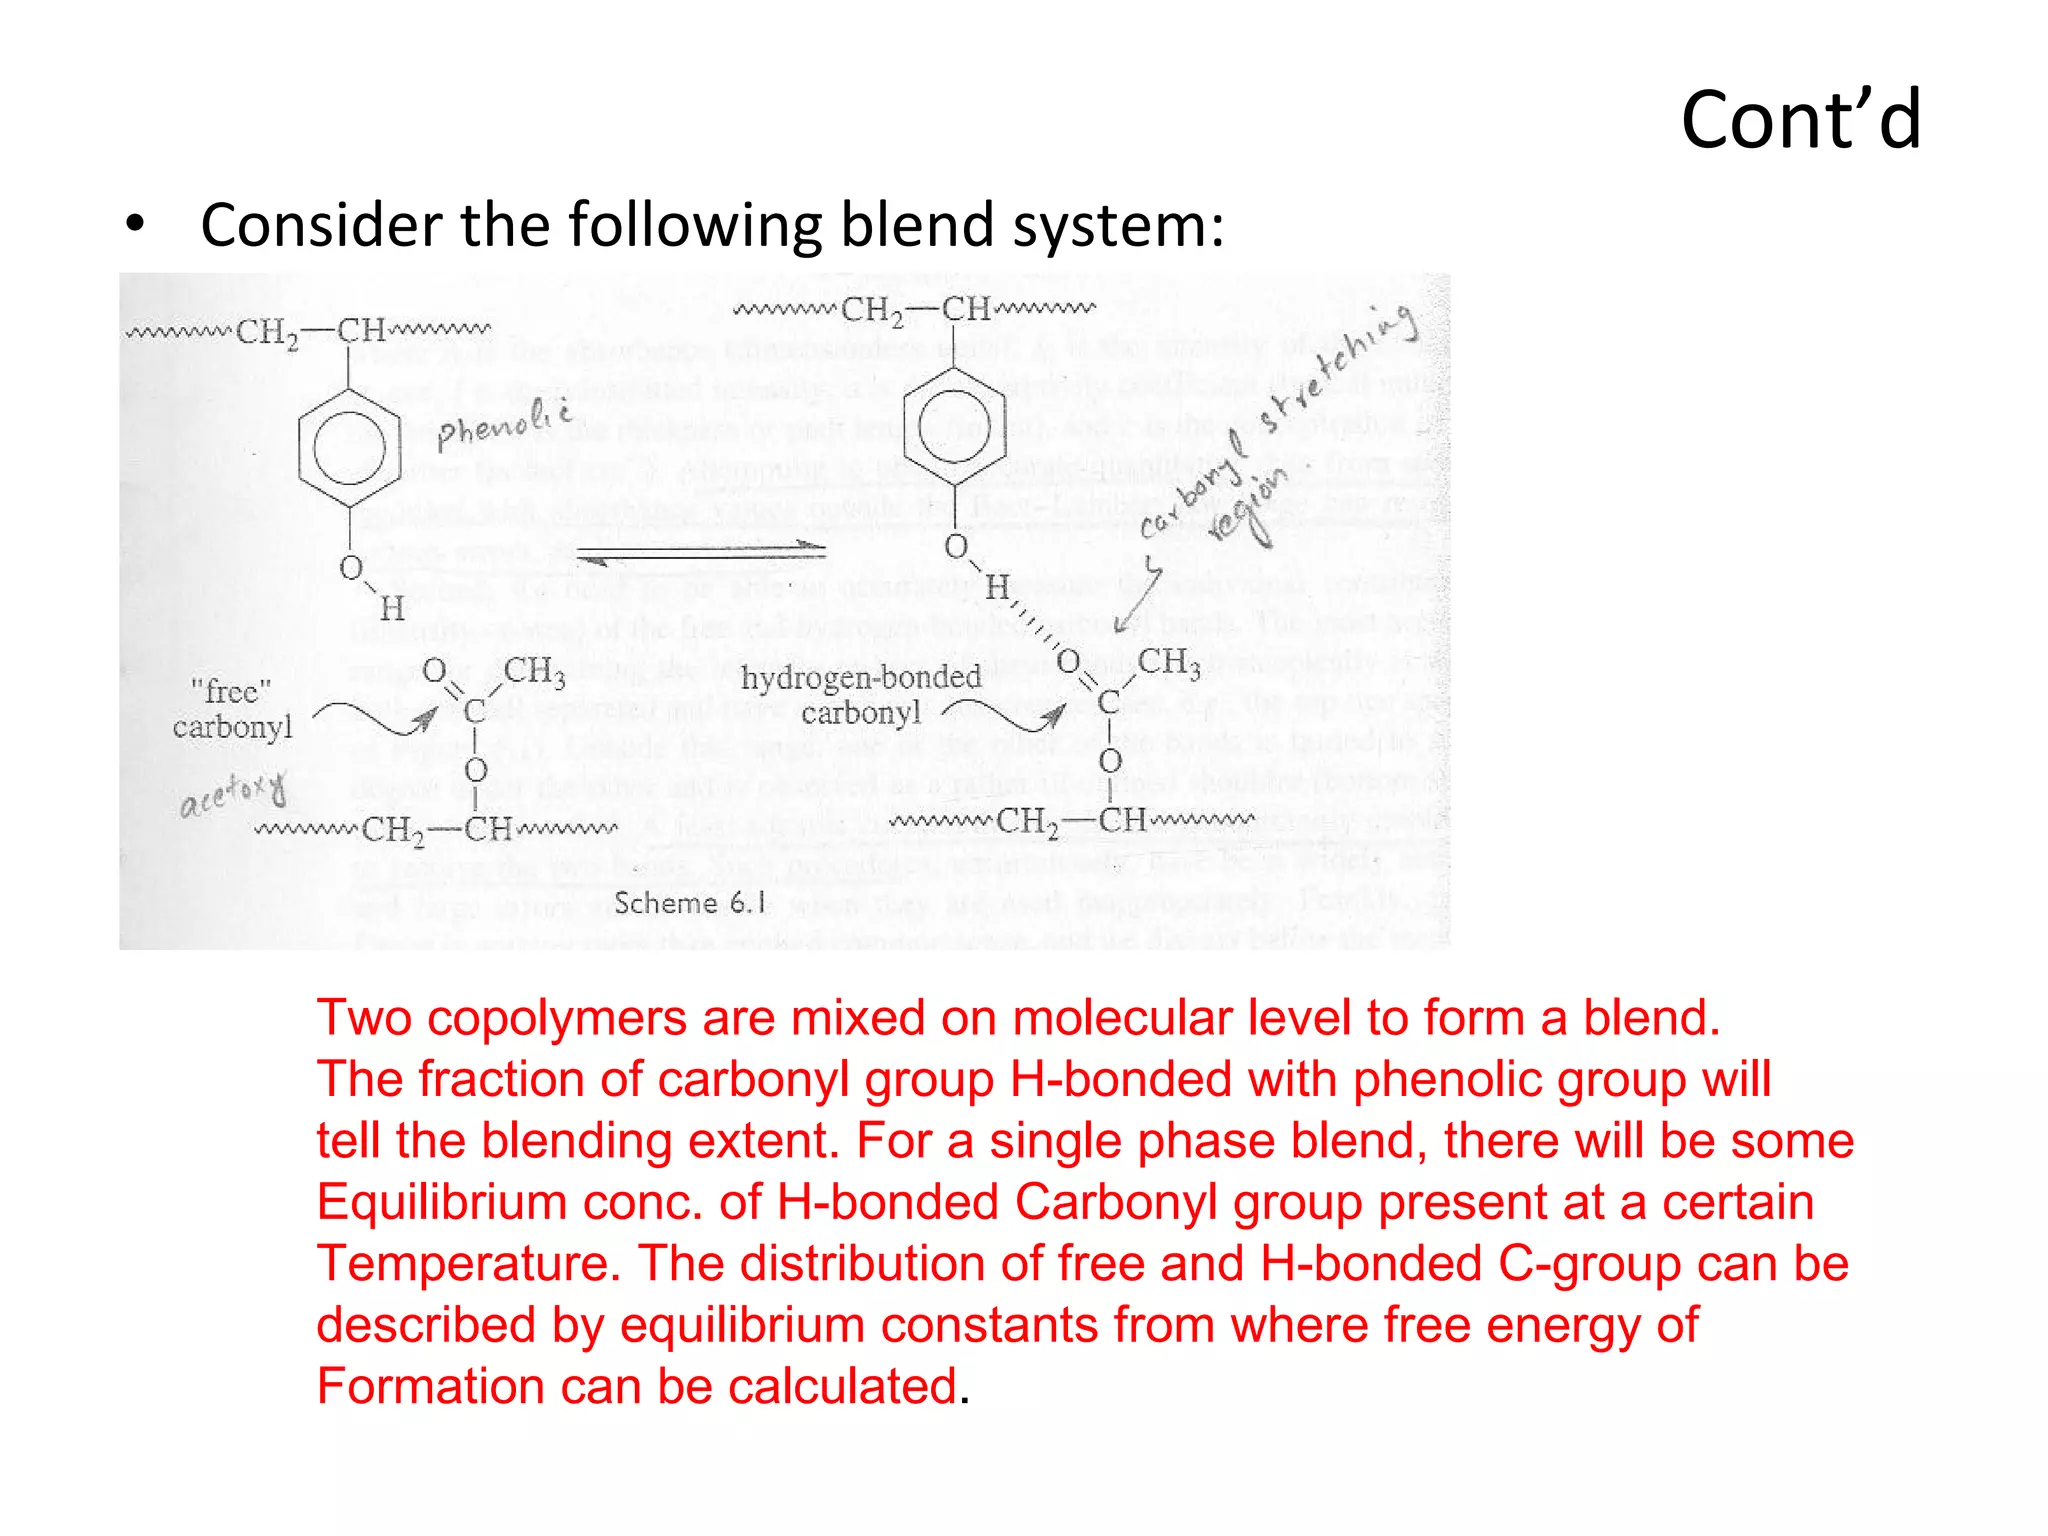
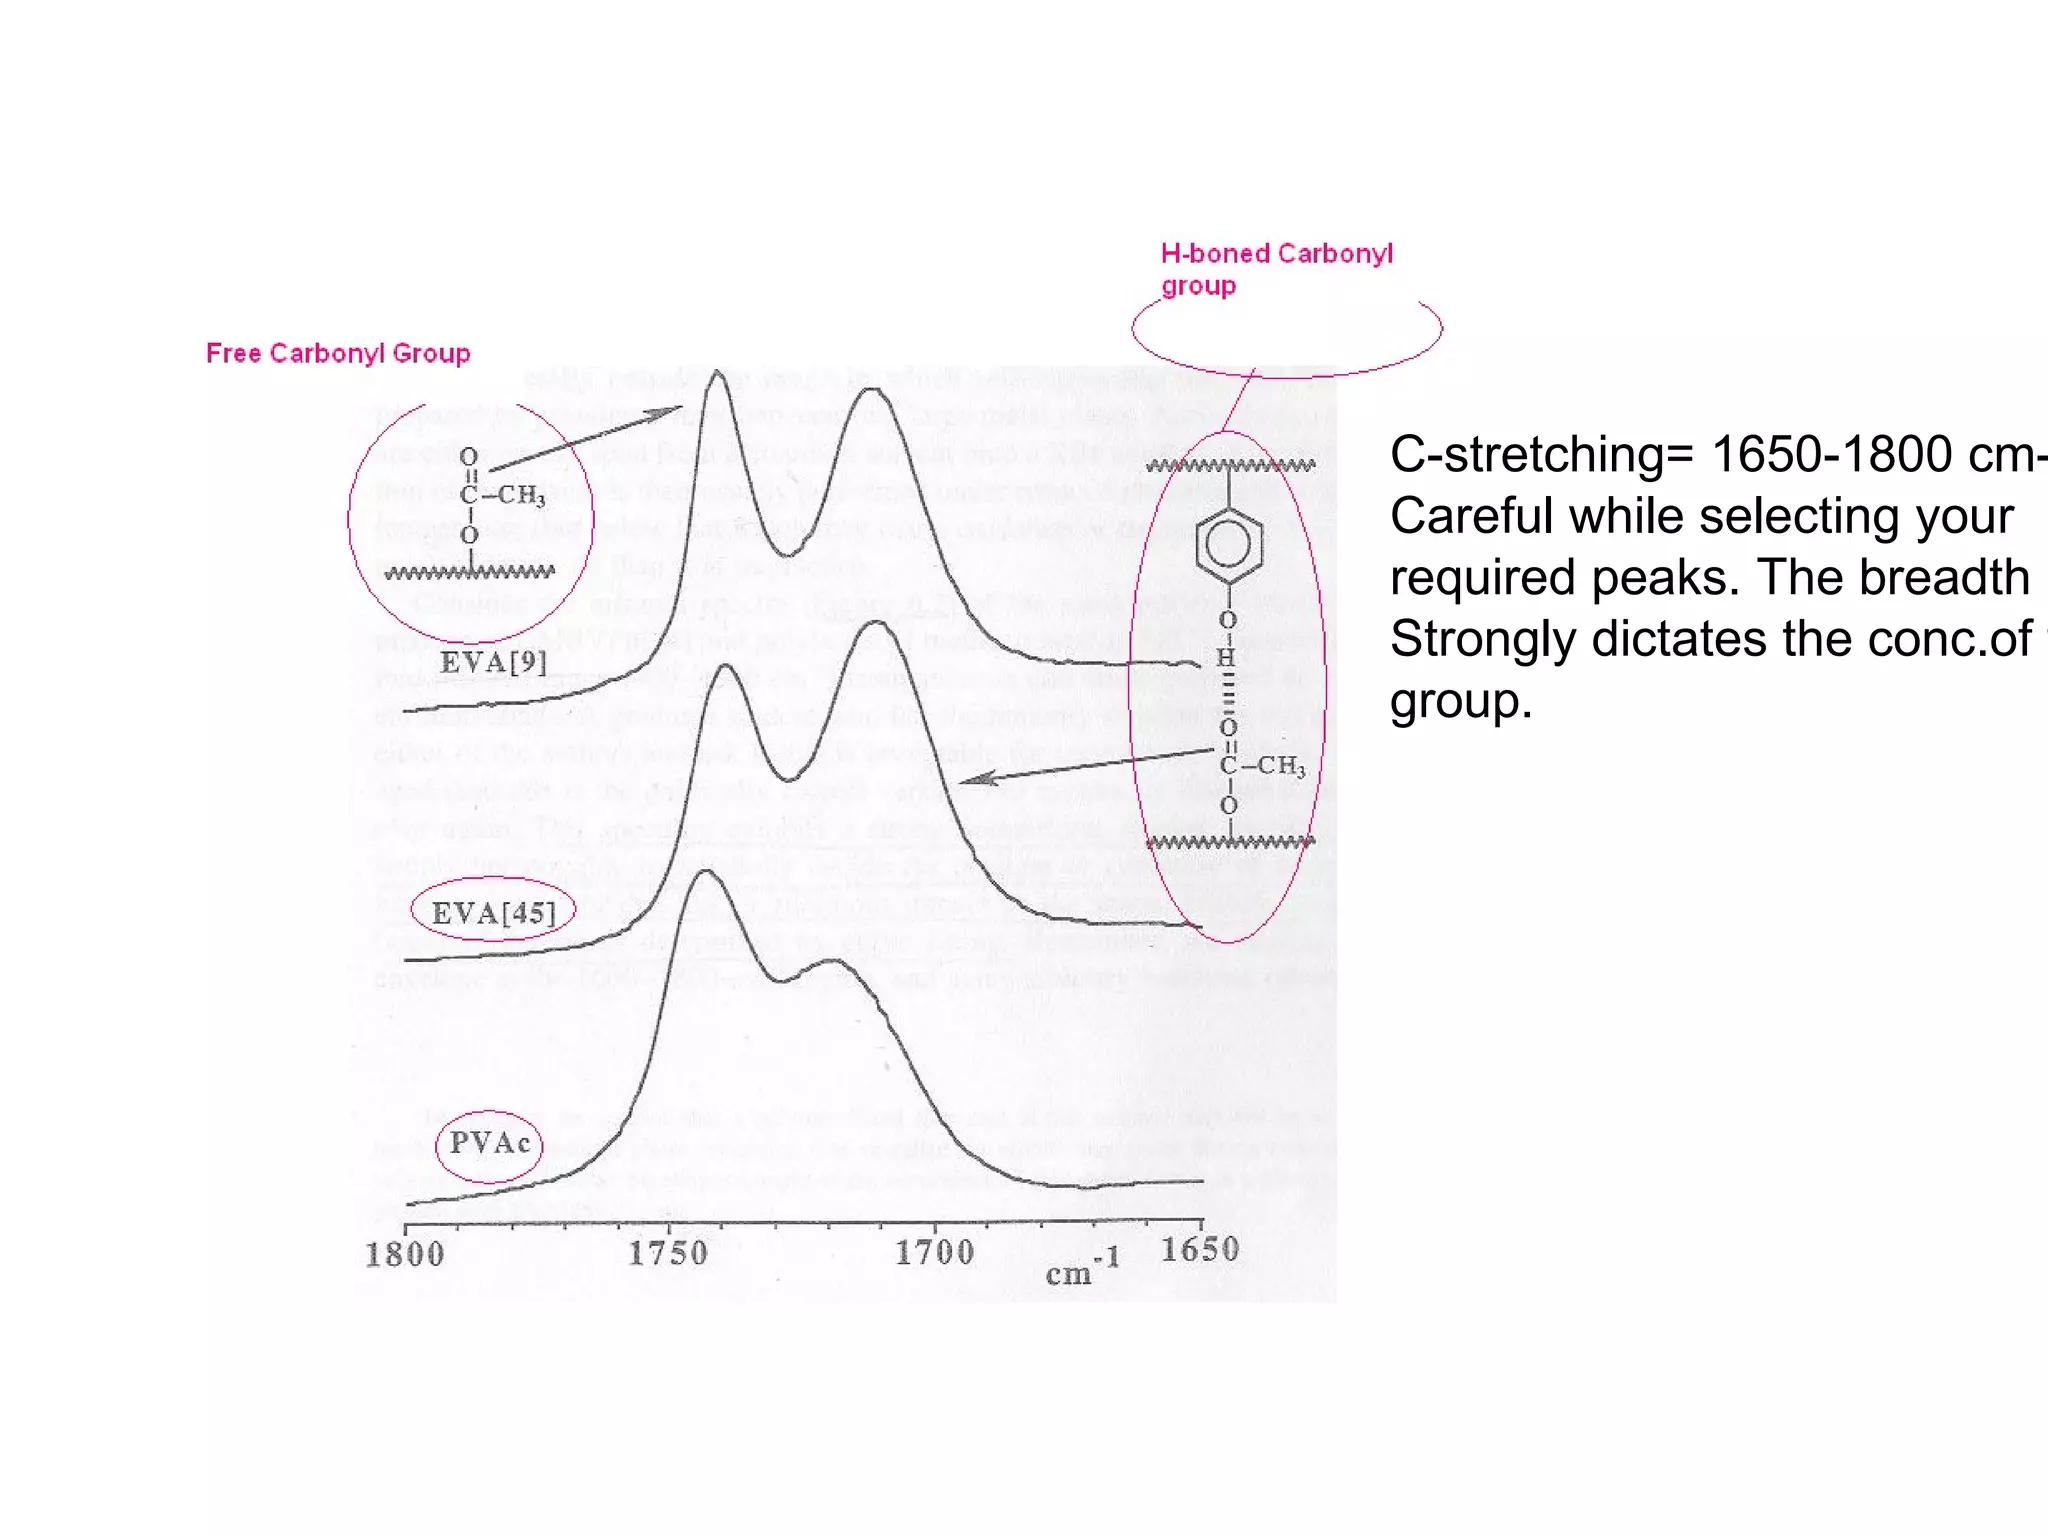
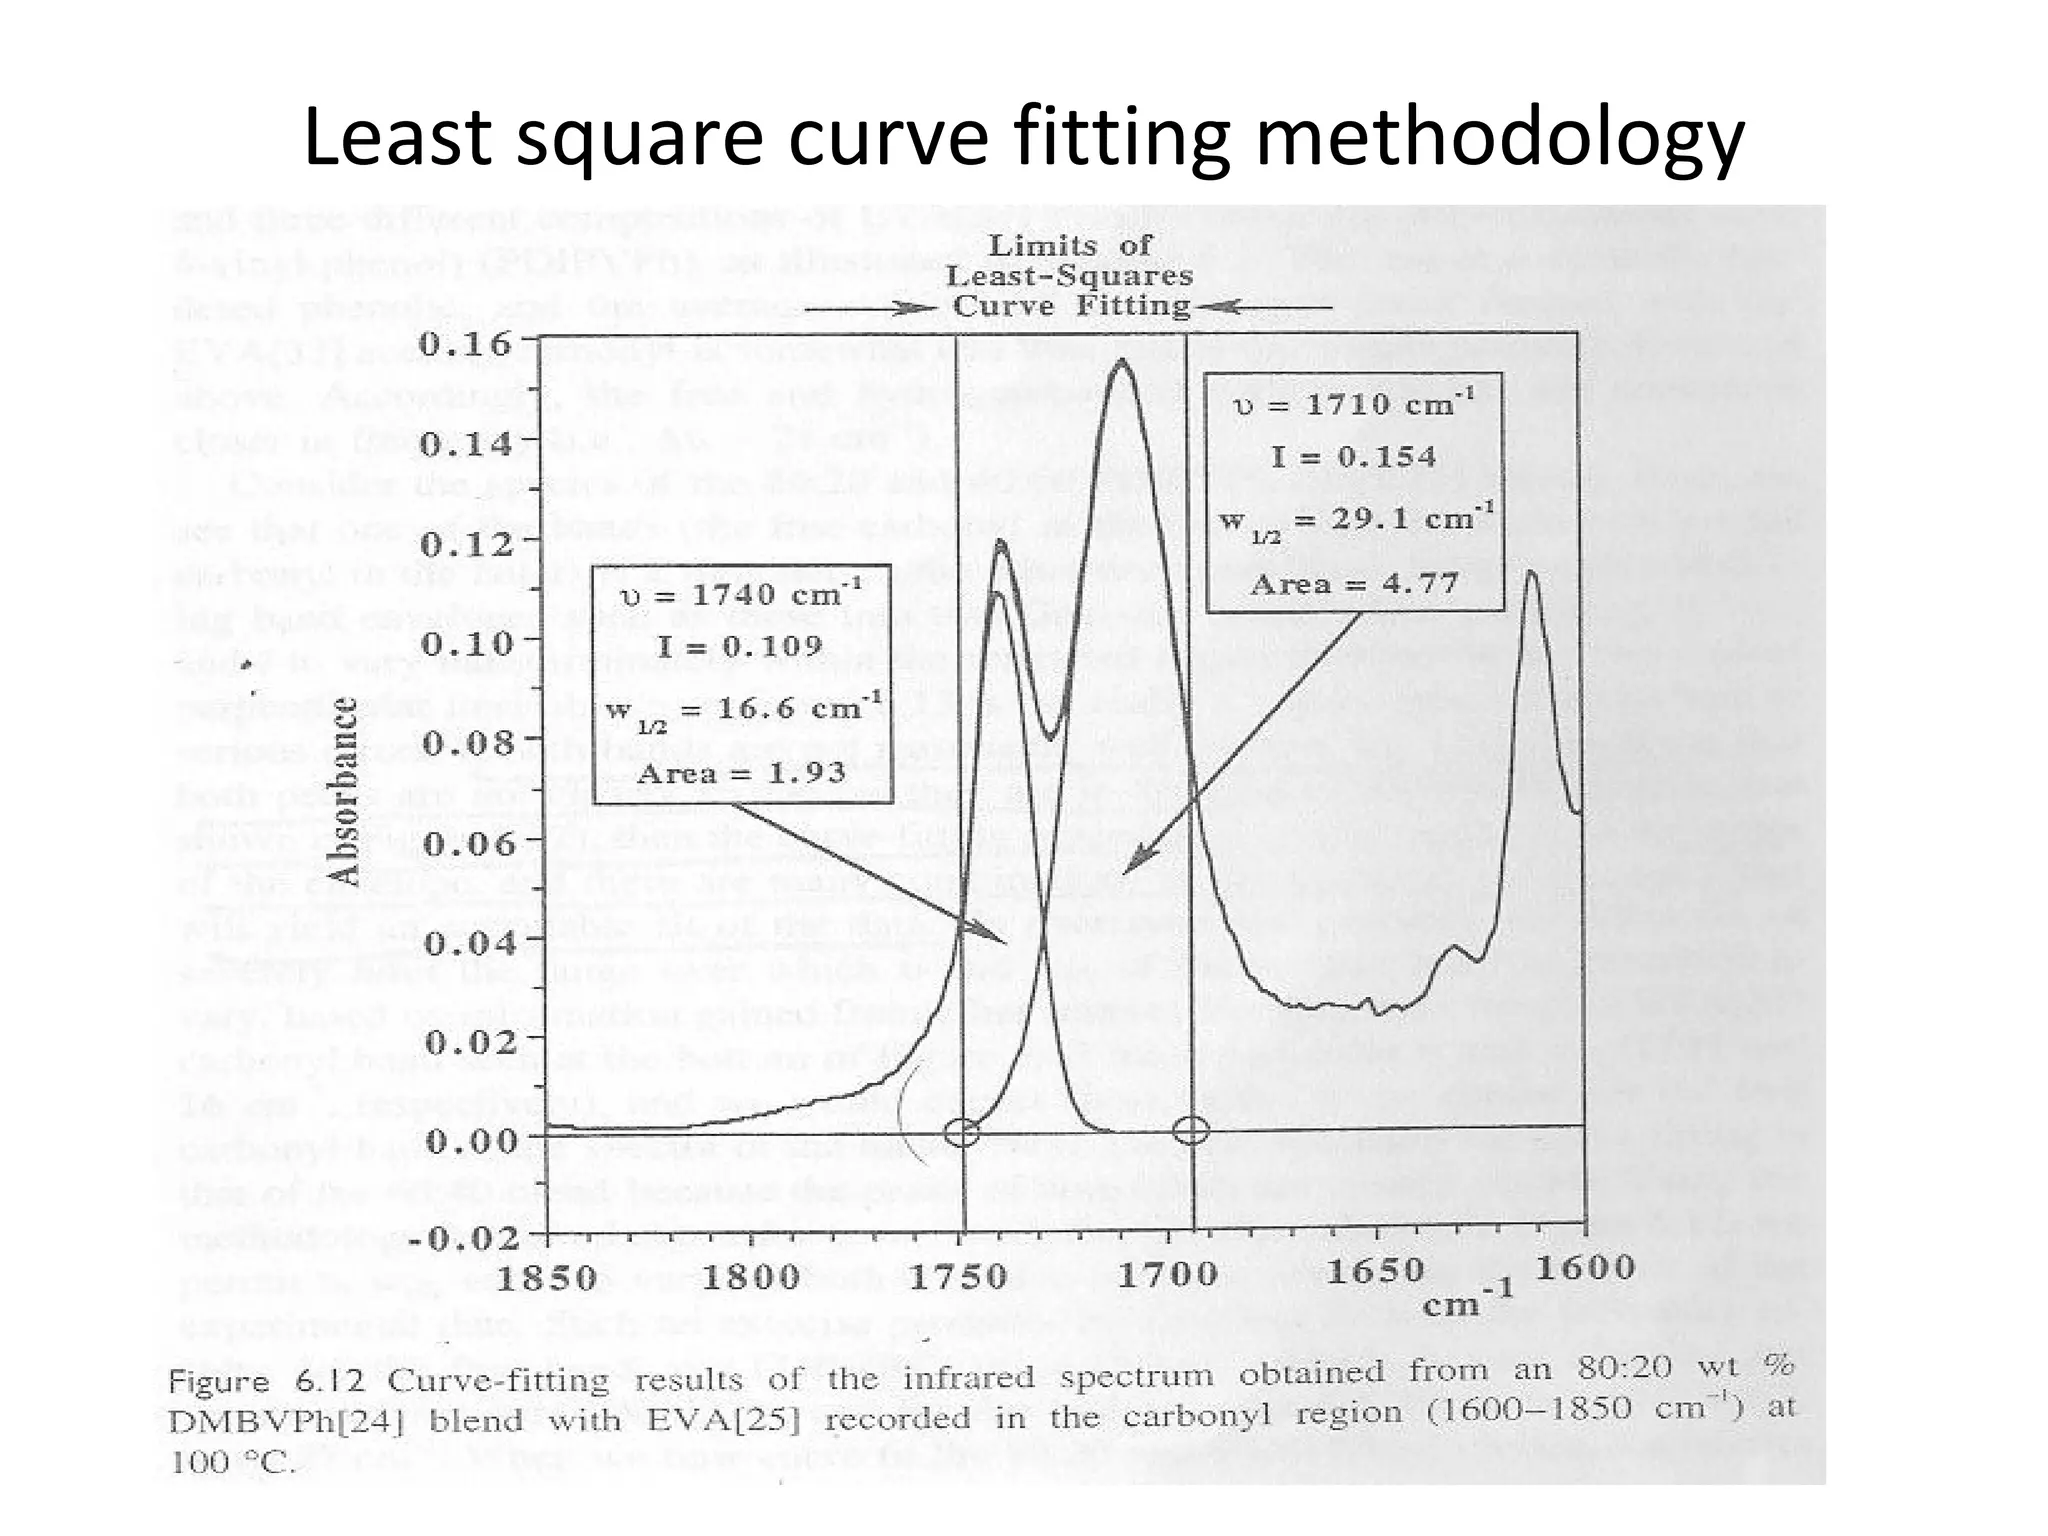
Cont’d Consider thefollowing blend system: s Two copolymers are mixed on molecular level to form a blend. The fraction of carbonyl group H-bonded with phenolic group will tell the blending extent. For a single phase blend, there will be some Equilibrium conc. of H-bonded Carbonyl group present at a certain Temperature. The distribution of free and H-bonded C-group can be described by equilibrium constants from where free energy of Formation can be calculated .
5.
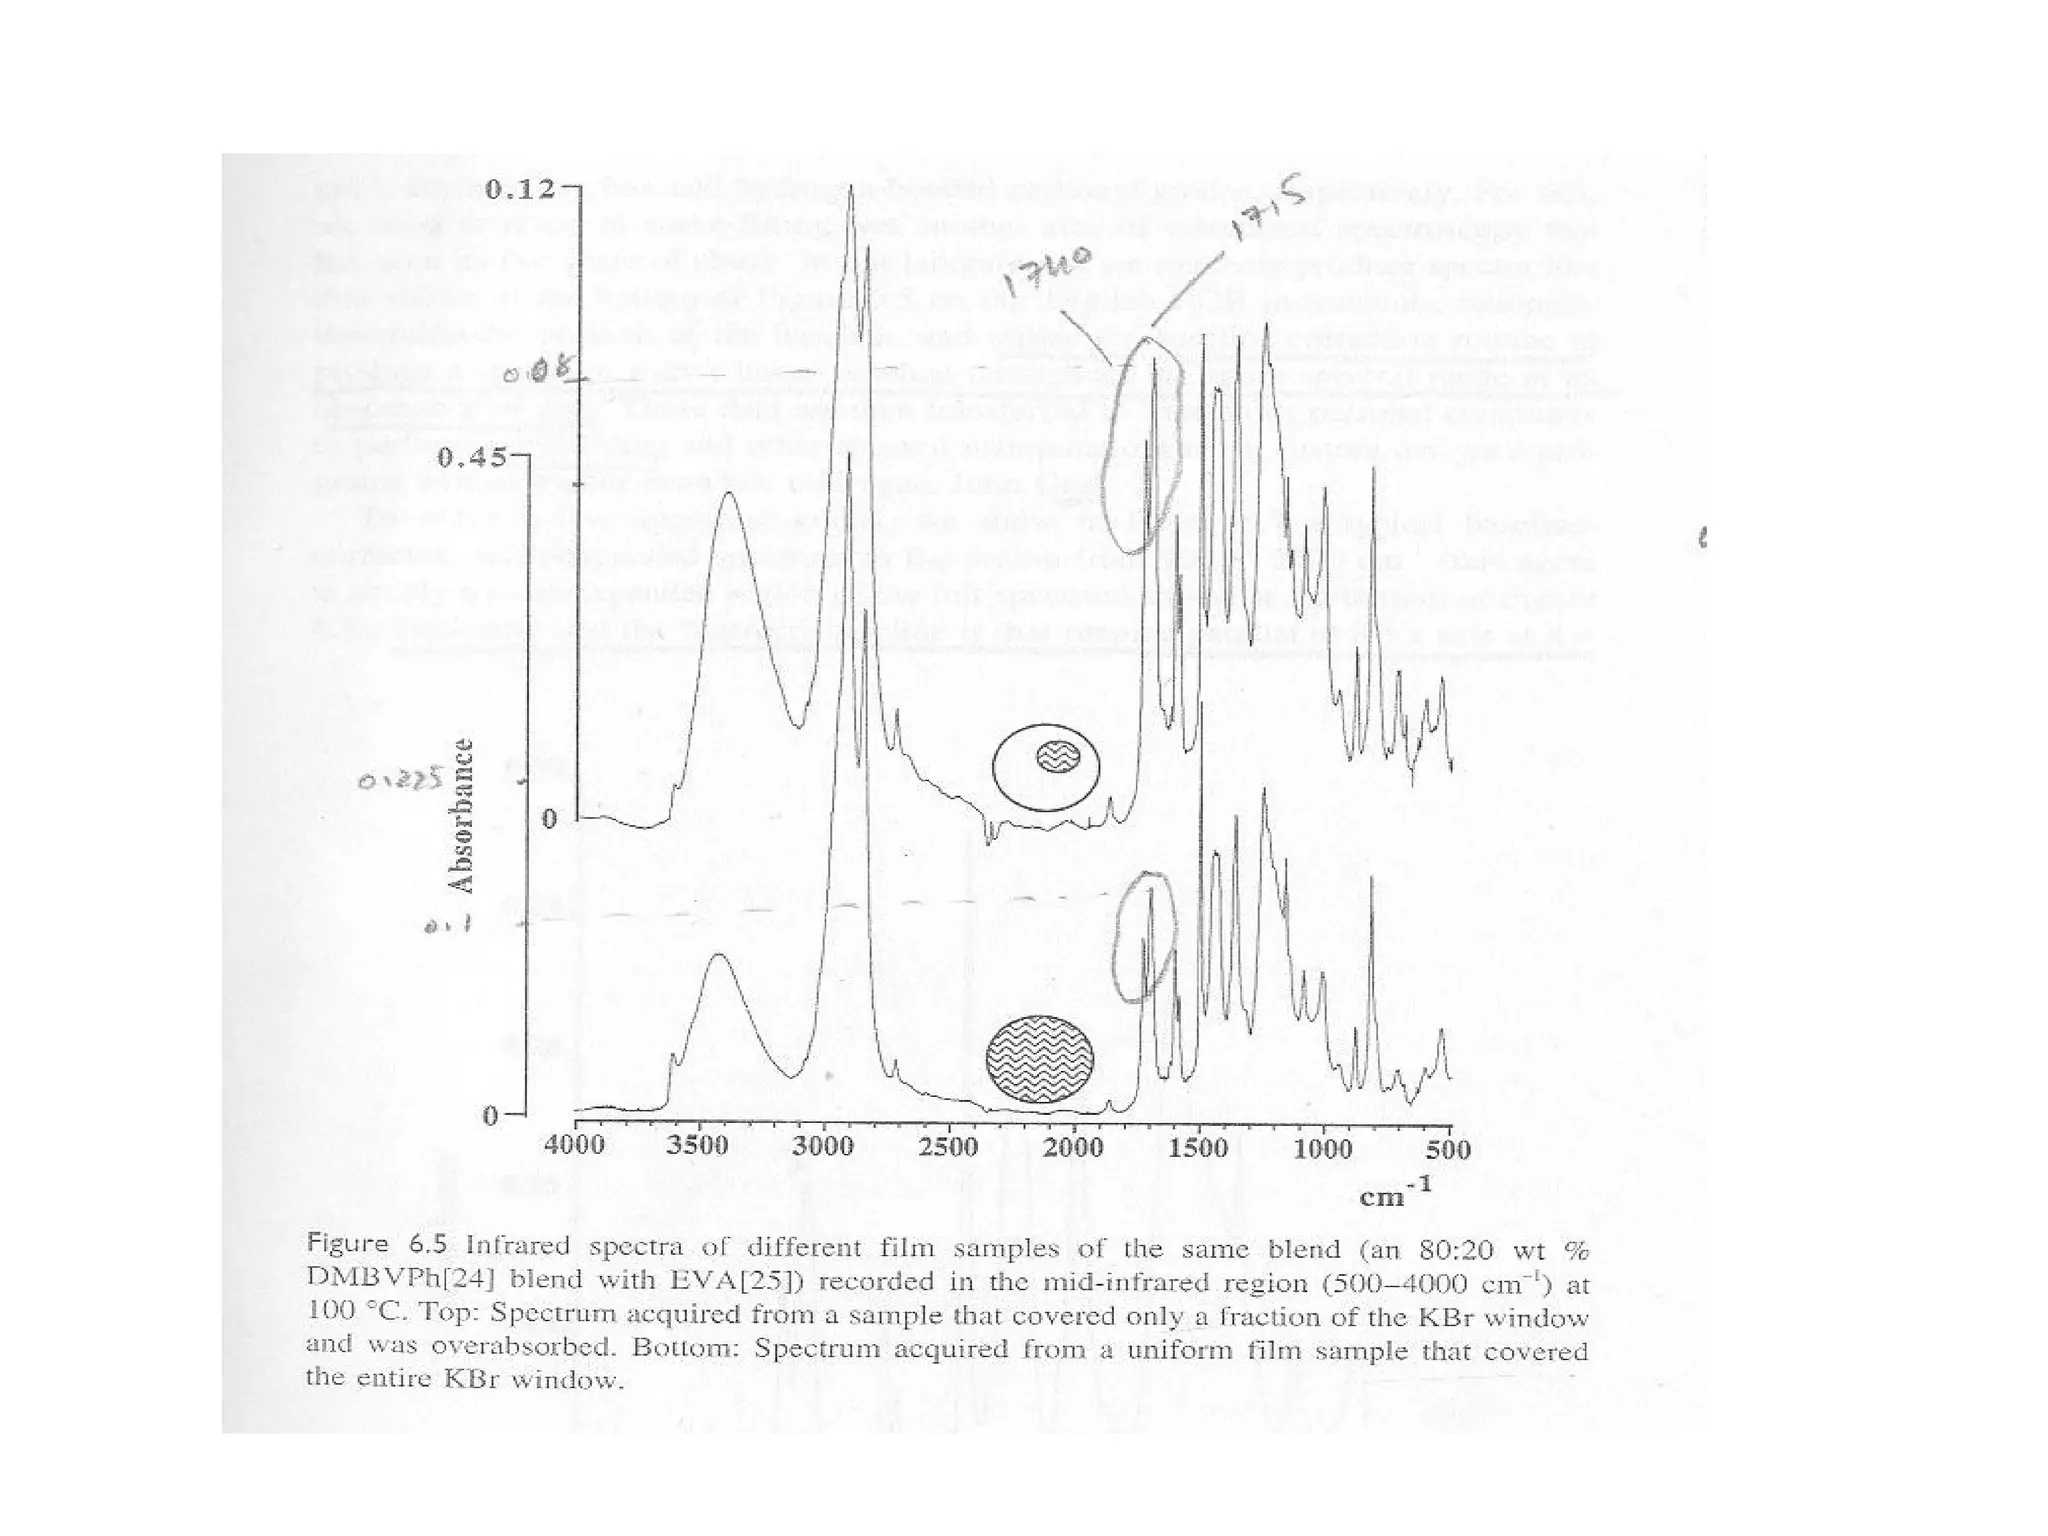
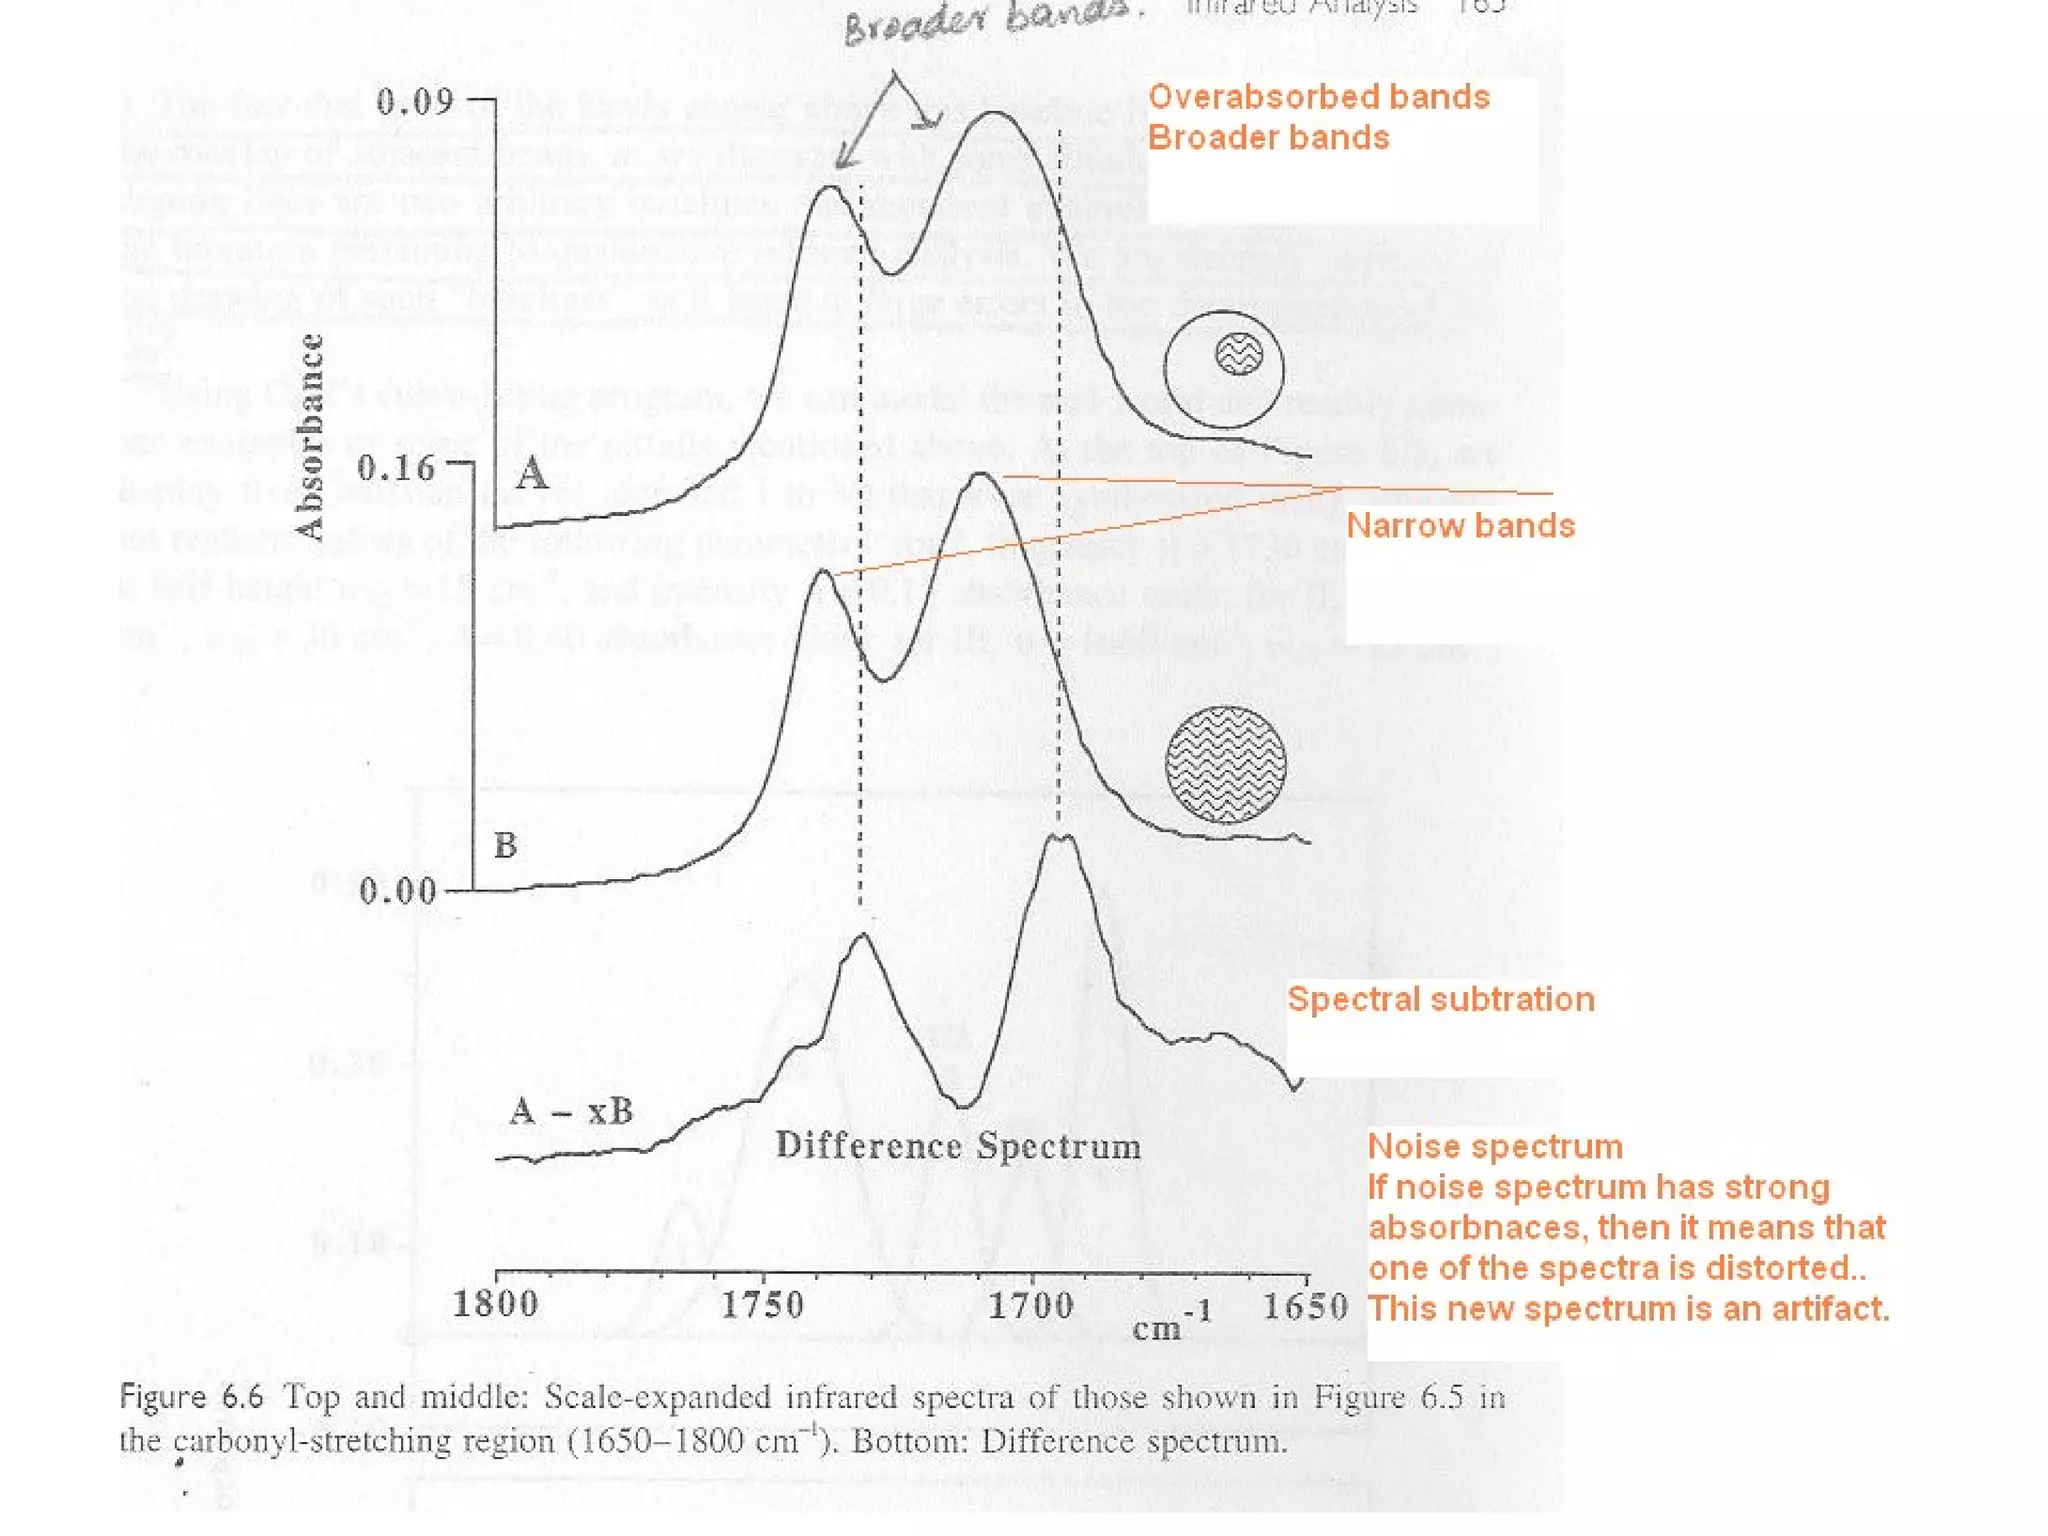
C-stretching= 1650-1800 cm-1Careful while selecting your required peaks. The breadth Strongly dictates the conc.of that group.
6.
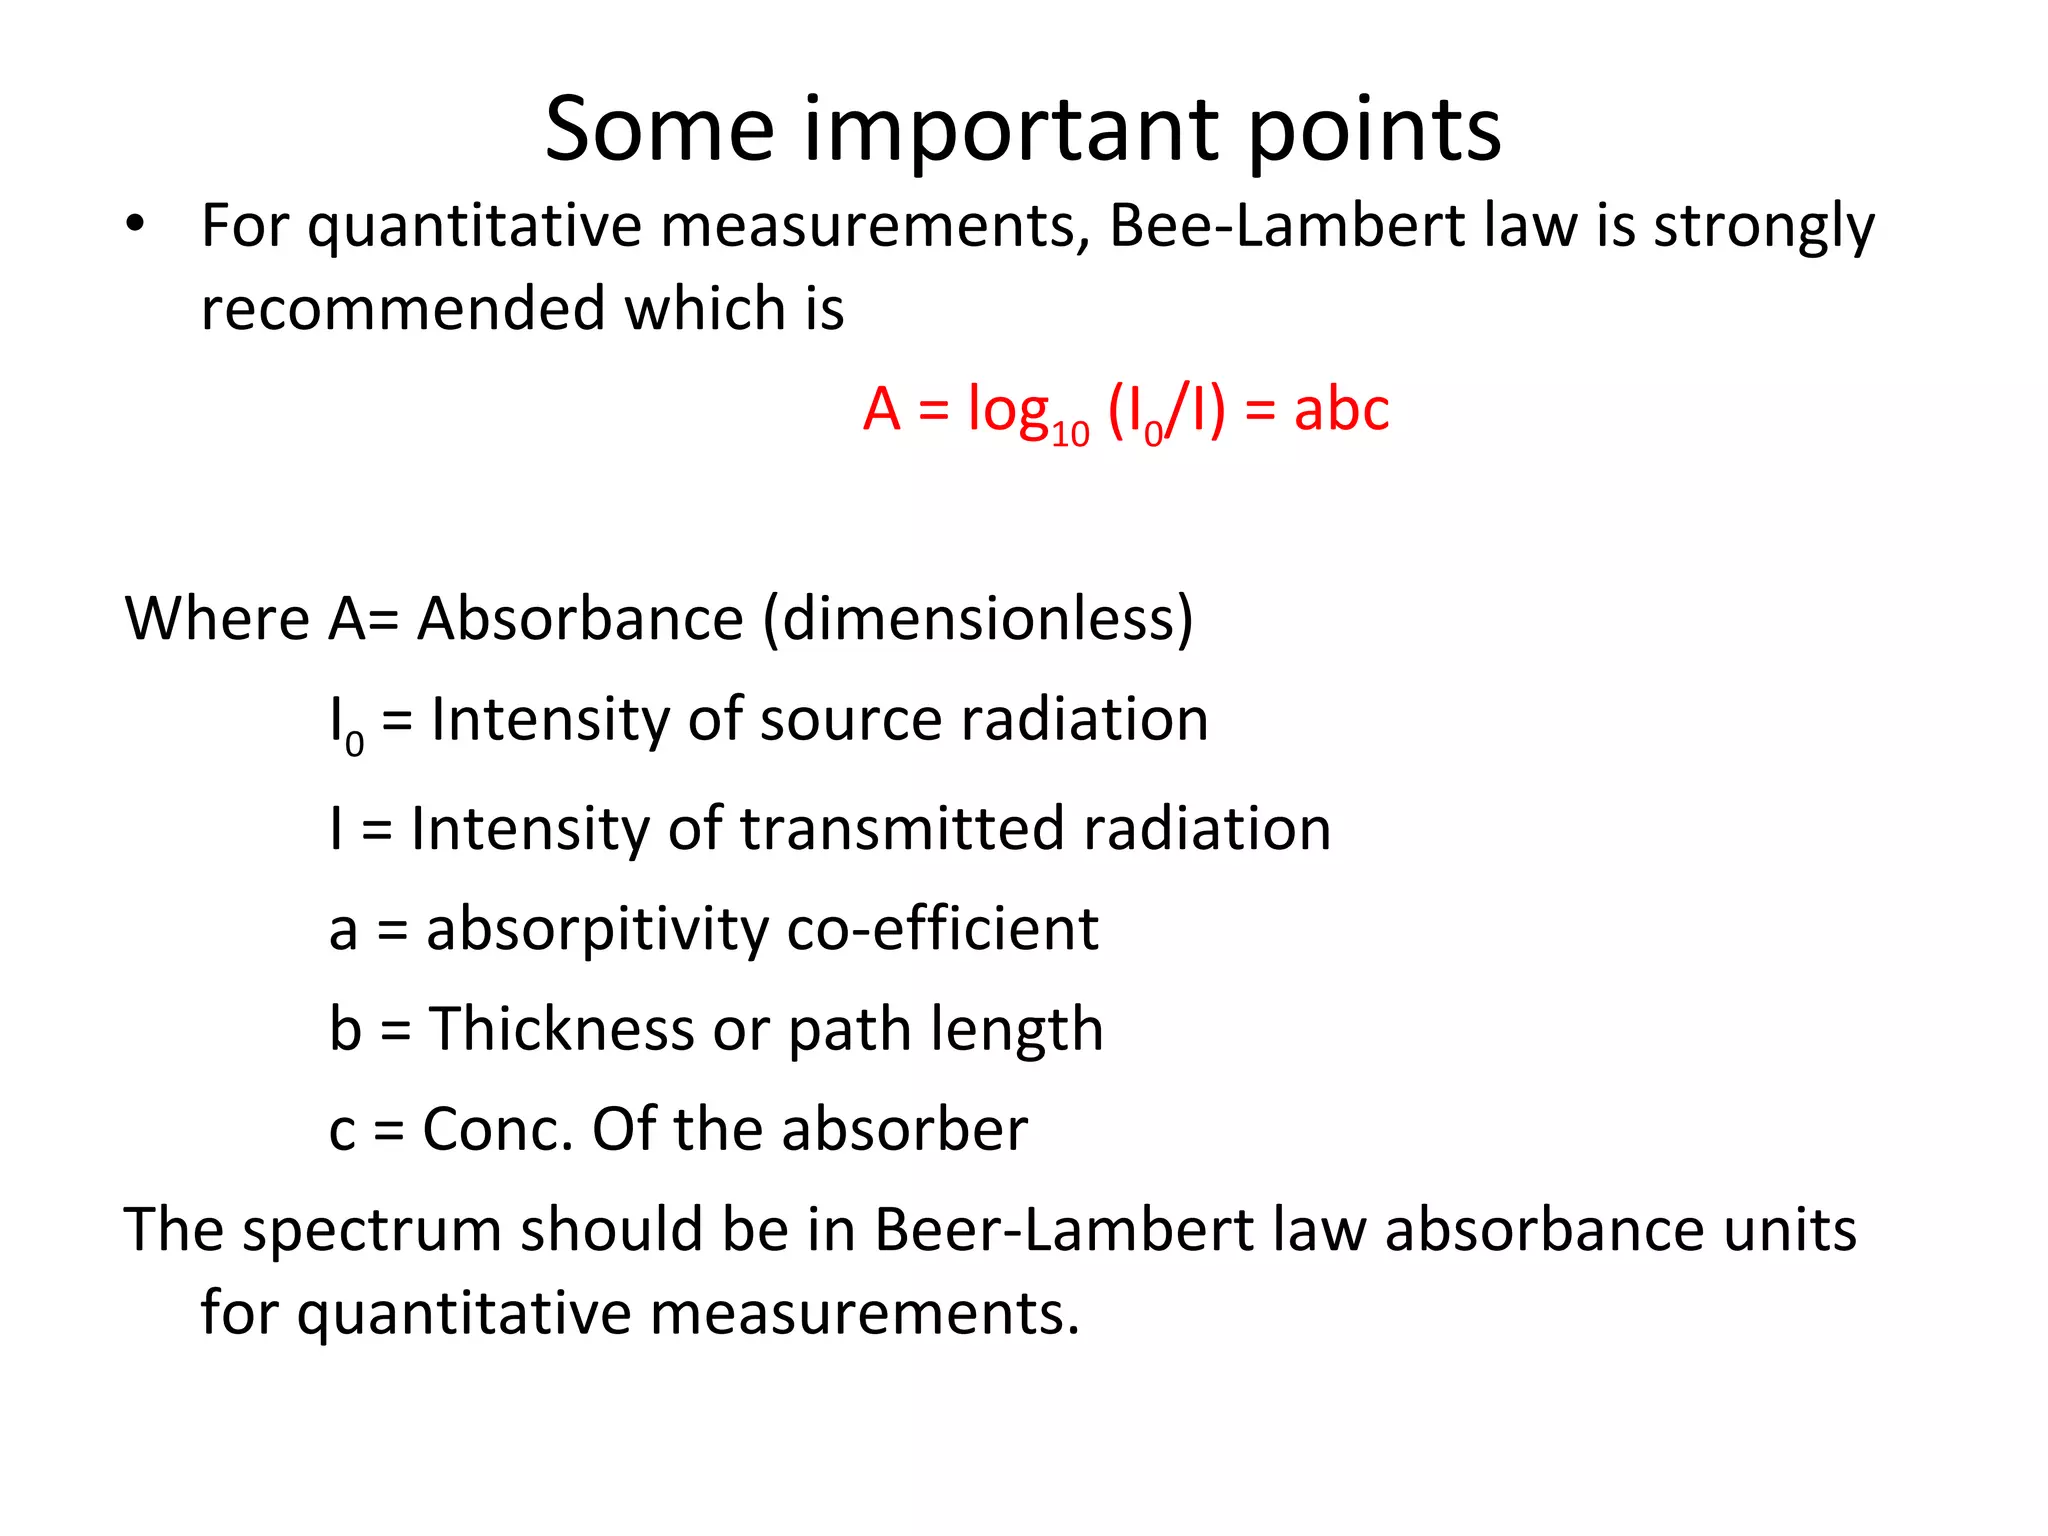
Some important pointsFor quantitative measurements, Bee-Lambert law is strongly recommended which is A = log 10 (I 0 /I) = abc Where A= Absorbance (dimensionless) I 0 = Intensity of source radiation I = Intensity of transmitted radiation a = absorpitivity co-efficient b = Thickness or path length c = Conc. Of the absorber The spectrum should be in Beer-Lambert law absorbance units for quantitative measurements.
7.
Cont’d Select thepeaks (bands) well defined Apply base line correction as recommended Apply least square curve fitting Determine the absorpitivities of free and H-bonded Carbonyl groups in terms of ratio a R Determine the inter association fraction through certain formulae The most important point is the judgment where your required groups lie and how much clear they are.
8.
Experimental Necessities SamplePreparation: The samples for IR analysis can be in different form: 1- Solid 2- Liquid 3- Gas Neat sample: If sample is a thin film then mount it as it is. Solid: Mix with IR grade KBr in 1:100 ratio Mull and salt window : fine powder of sample is mixed with a hydrocarbon oil and it is placed between two salt plates. Typical salt windows: 1 inch diameter, 3-5 mm thickness
9.
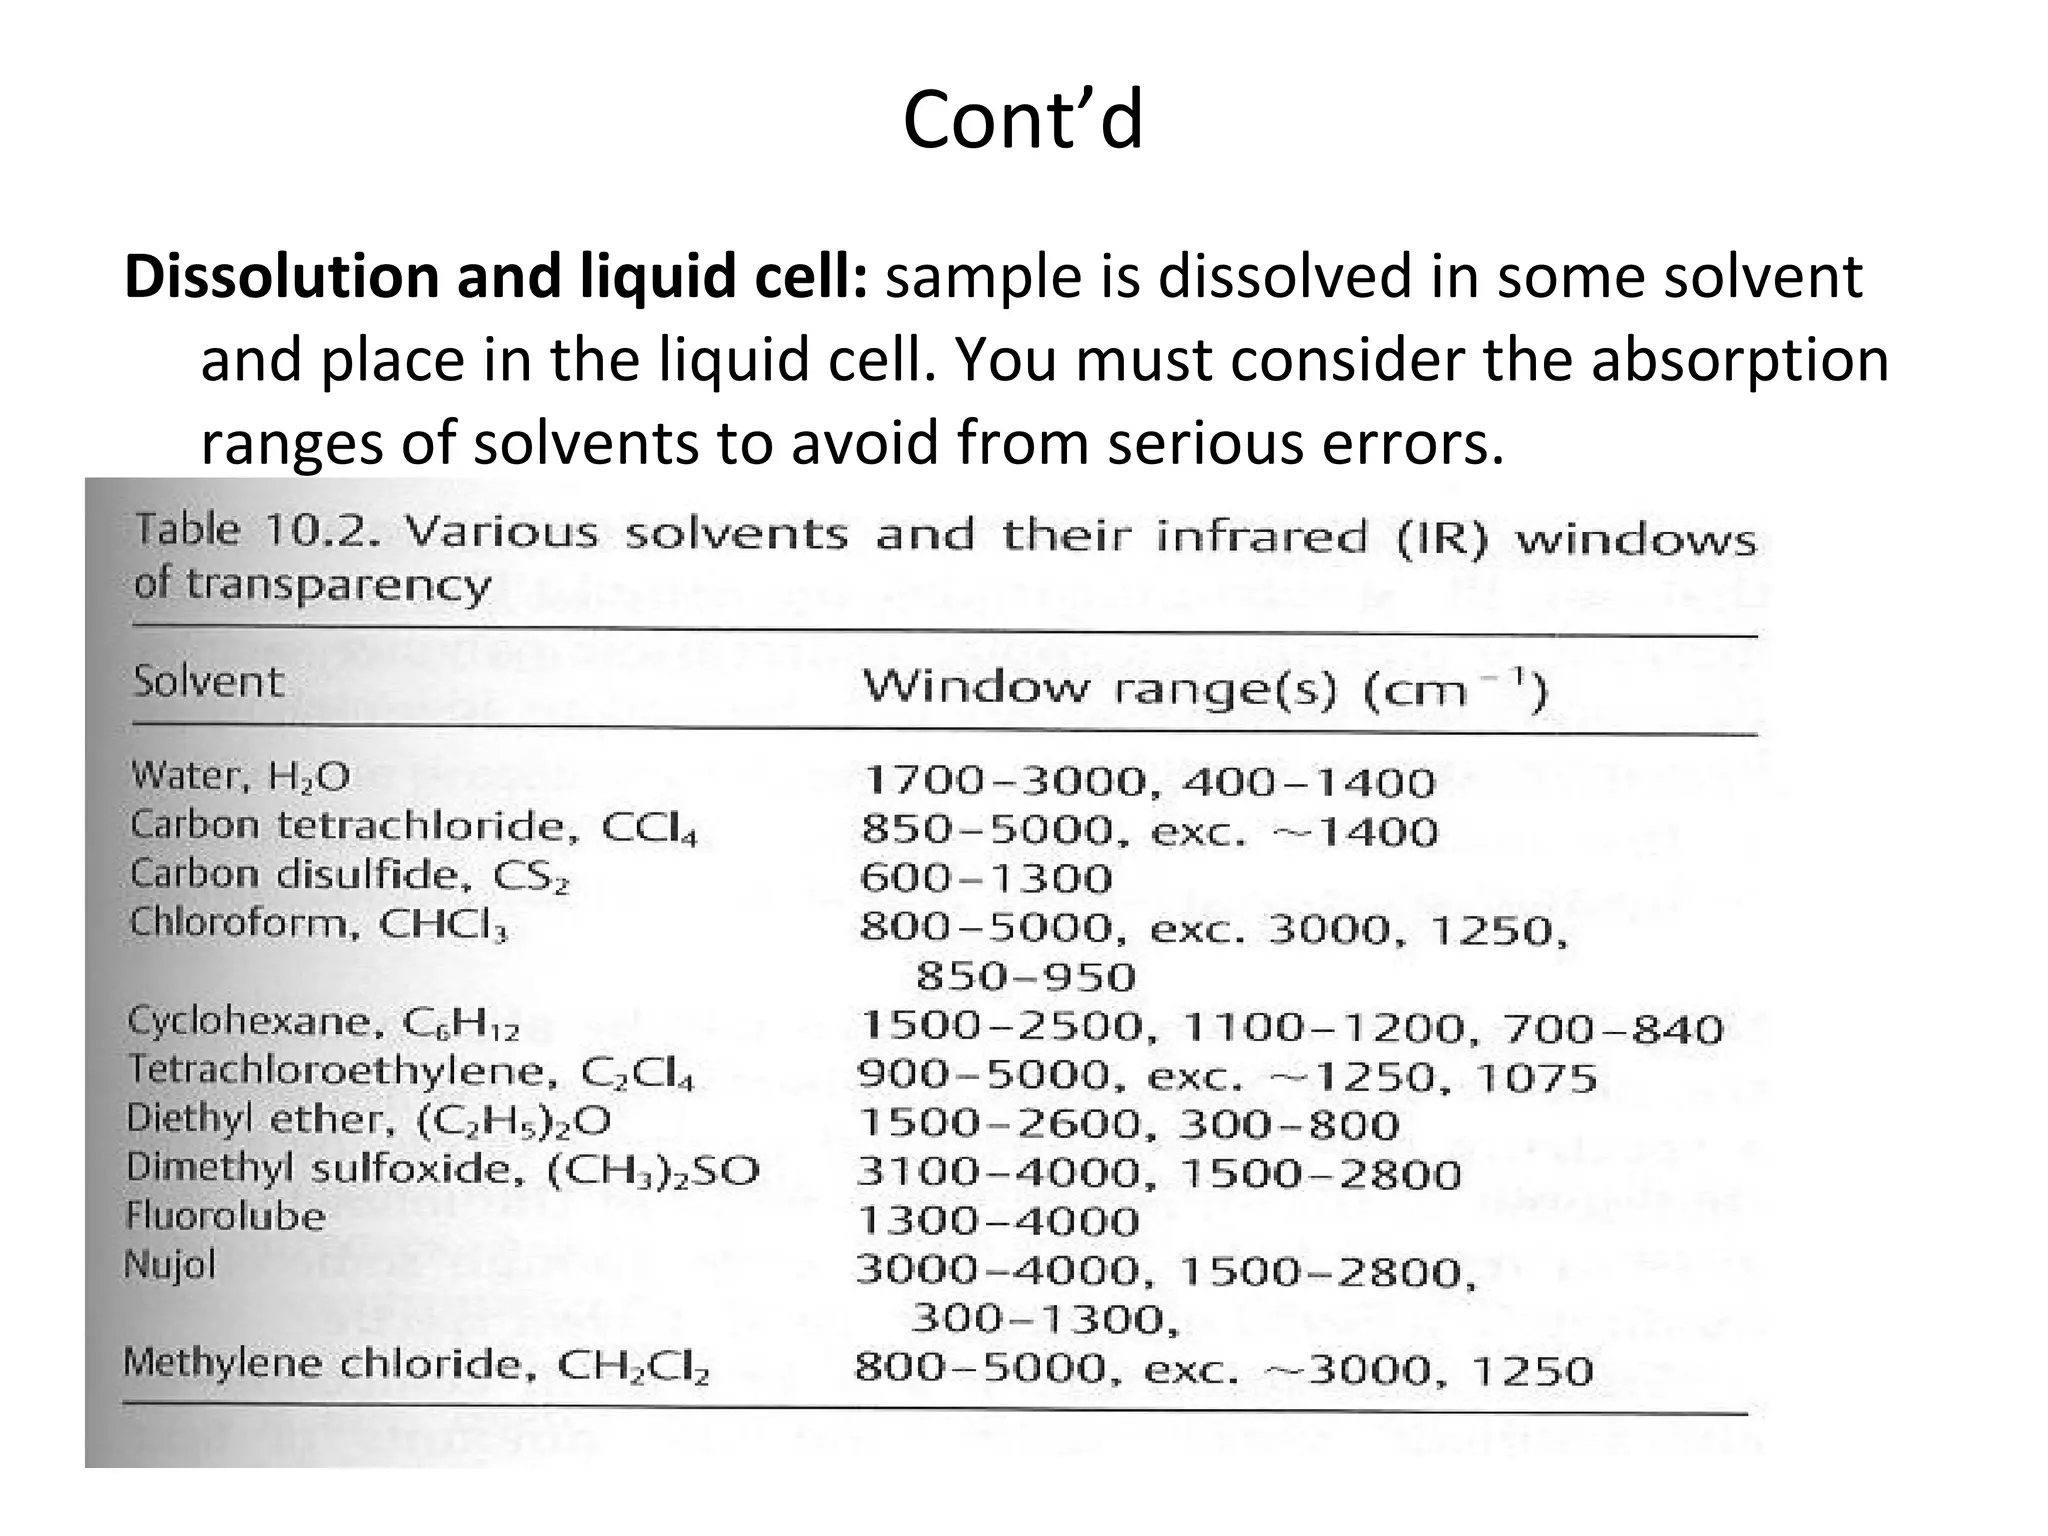
Cont’d Dissolution andliquid cell: sample is dissolved in some solvent and place in the liquid cell. You must consider the absorption ranges of solvents to avoid from serious errors.
10.
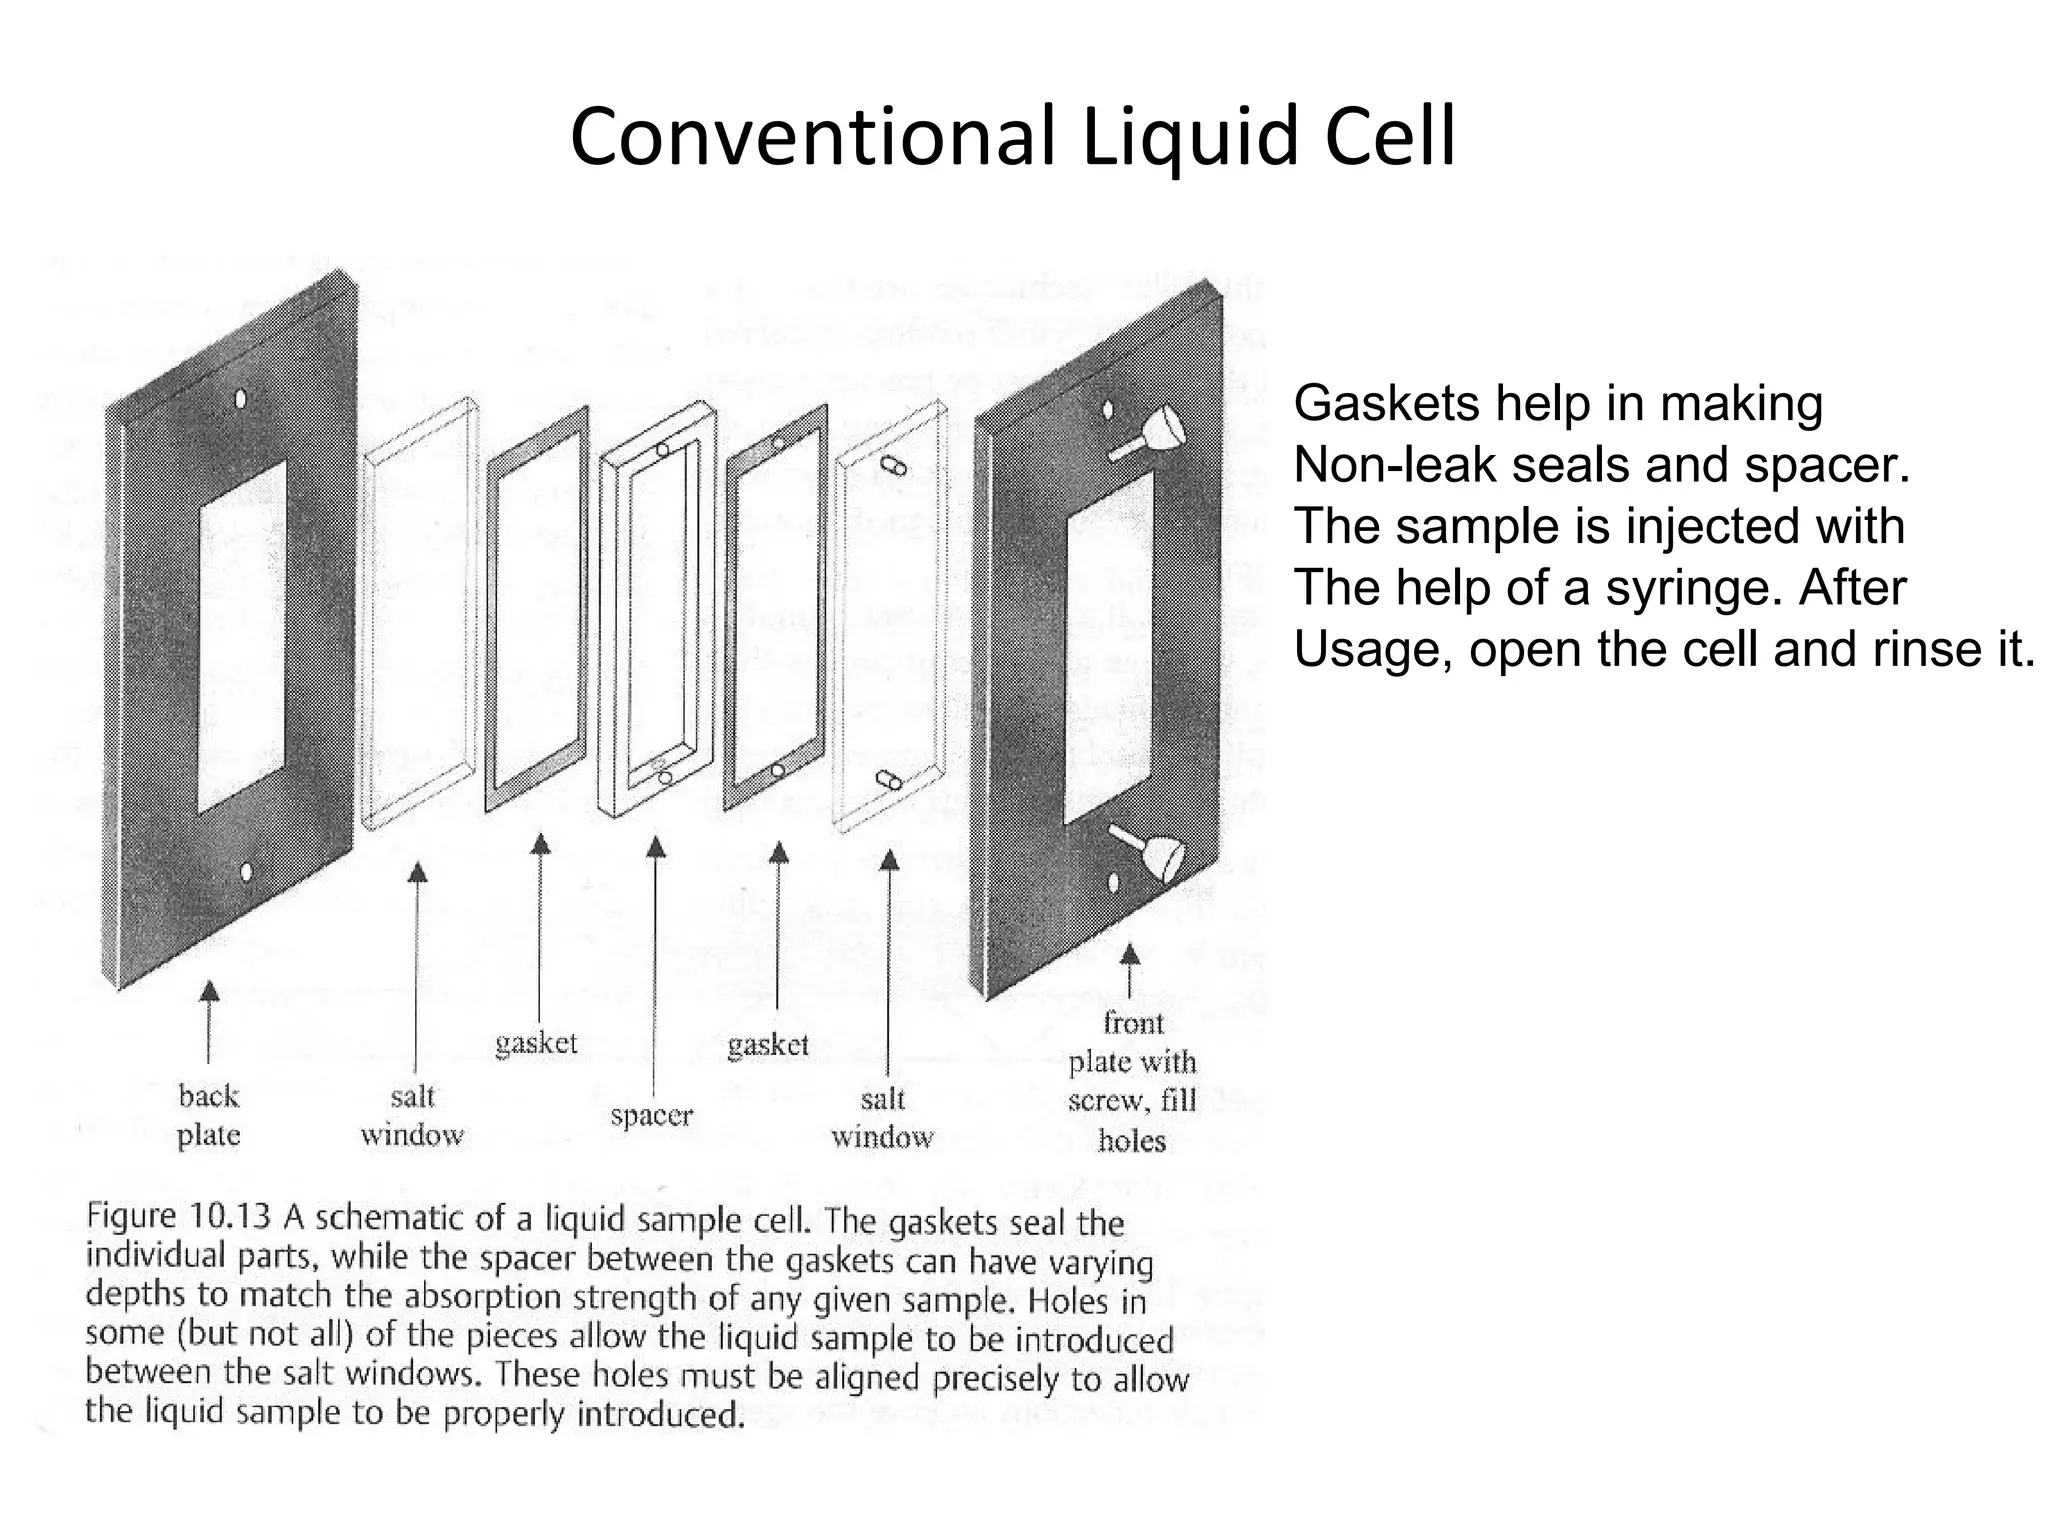
Conventional Liquid Cell Gaskets help in making Non-leak seals and spacer. The sample is injected with The help of a syringe. After Usage, open the cell and rinse it.
11.
Cont’d Gas samples: A gas sample cell is required which is made of some standard salt like KBr or NaCl. The gas in injected with the help of a small piston system and kept at very low pressures. The main precaution in this system is the partial pressure of gas to be analyzed. Films: less than 10 micron thickness, The absorbance should not be greater than 0.6.
12.
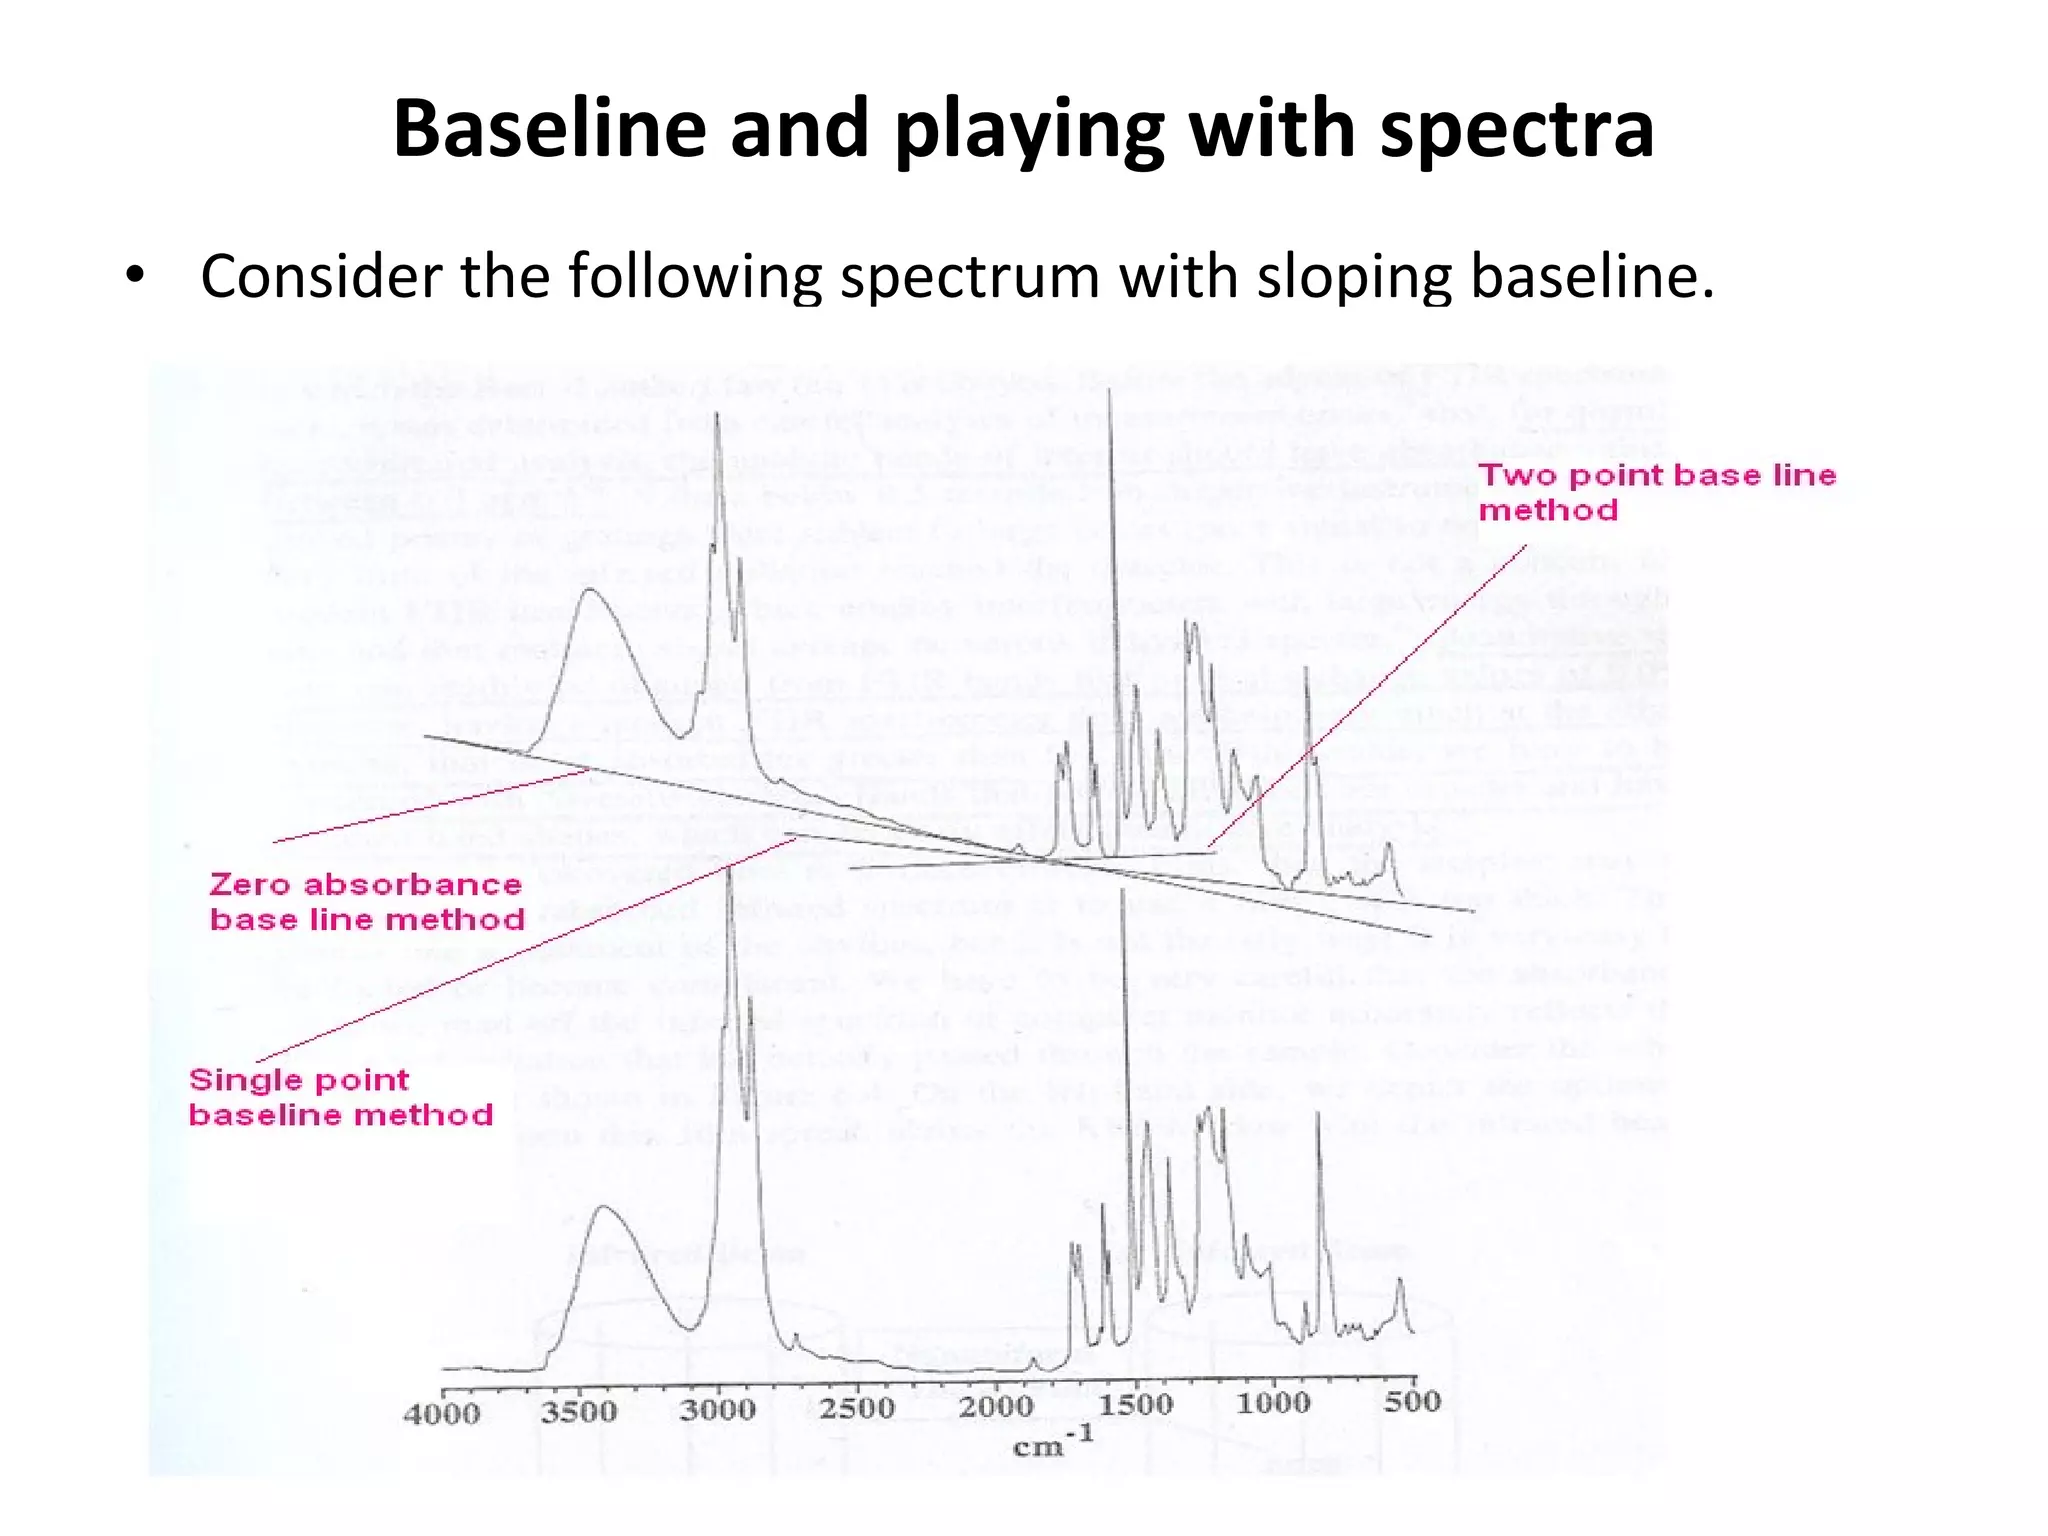
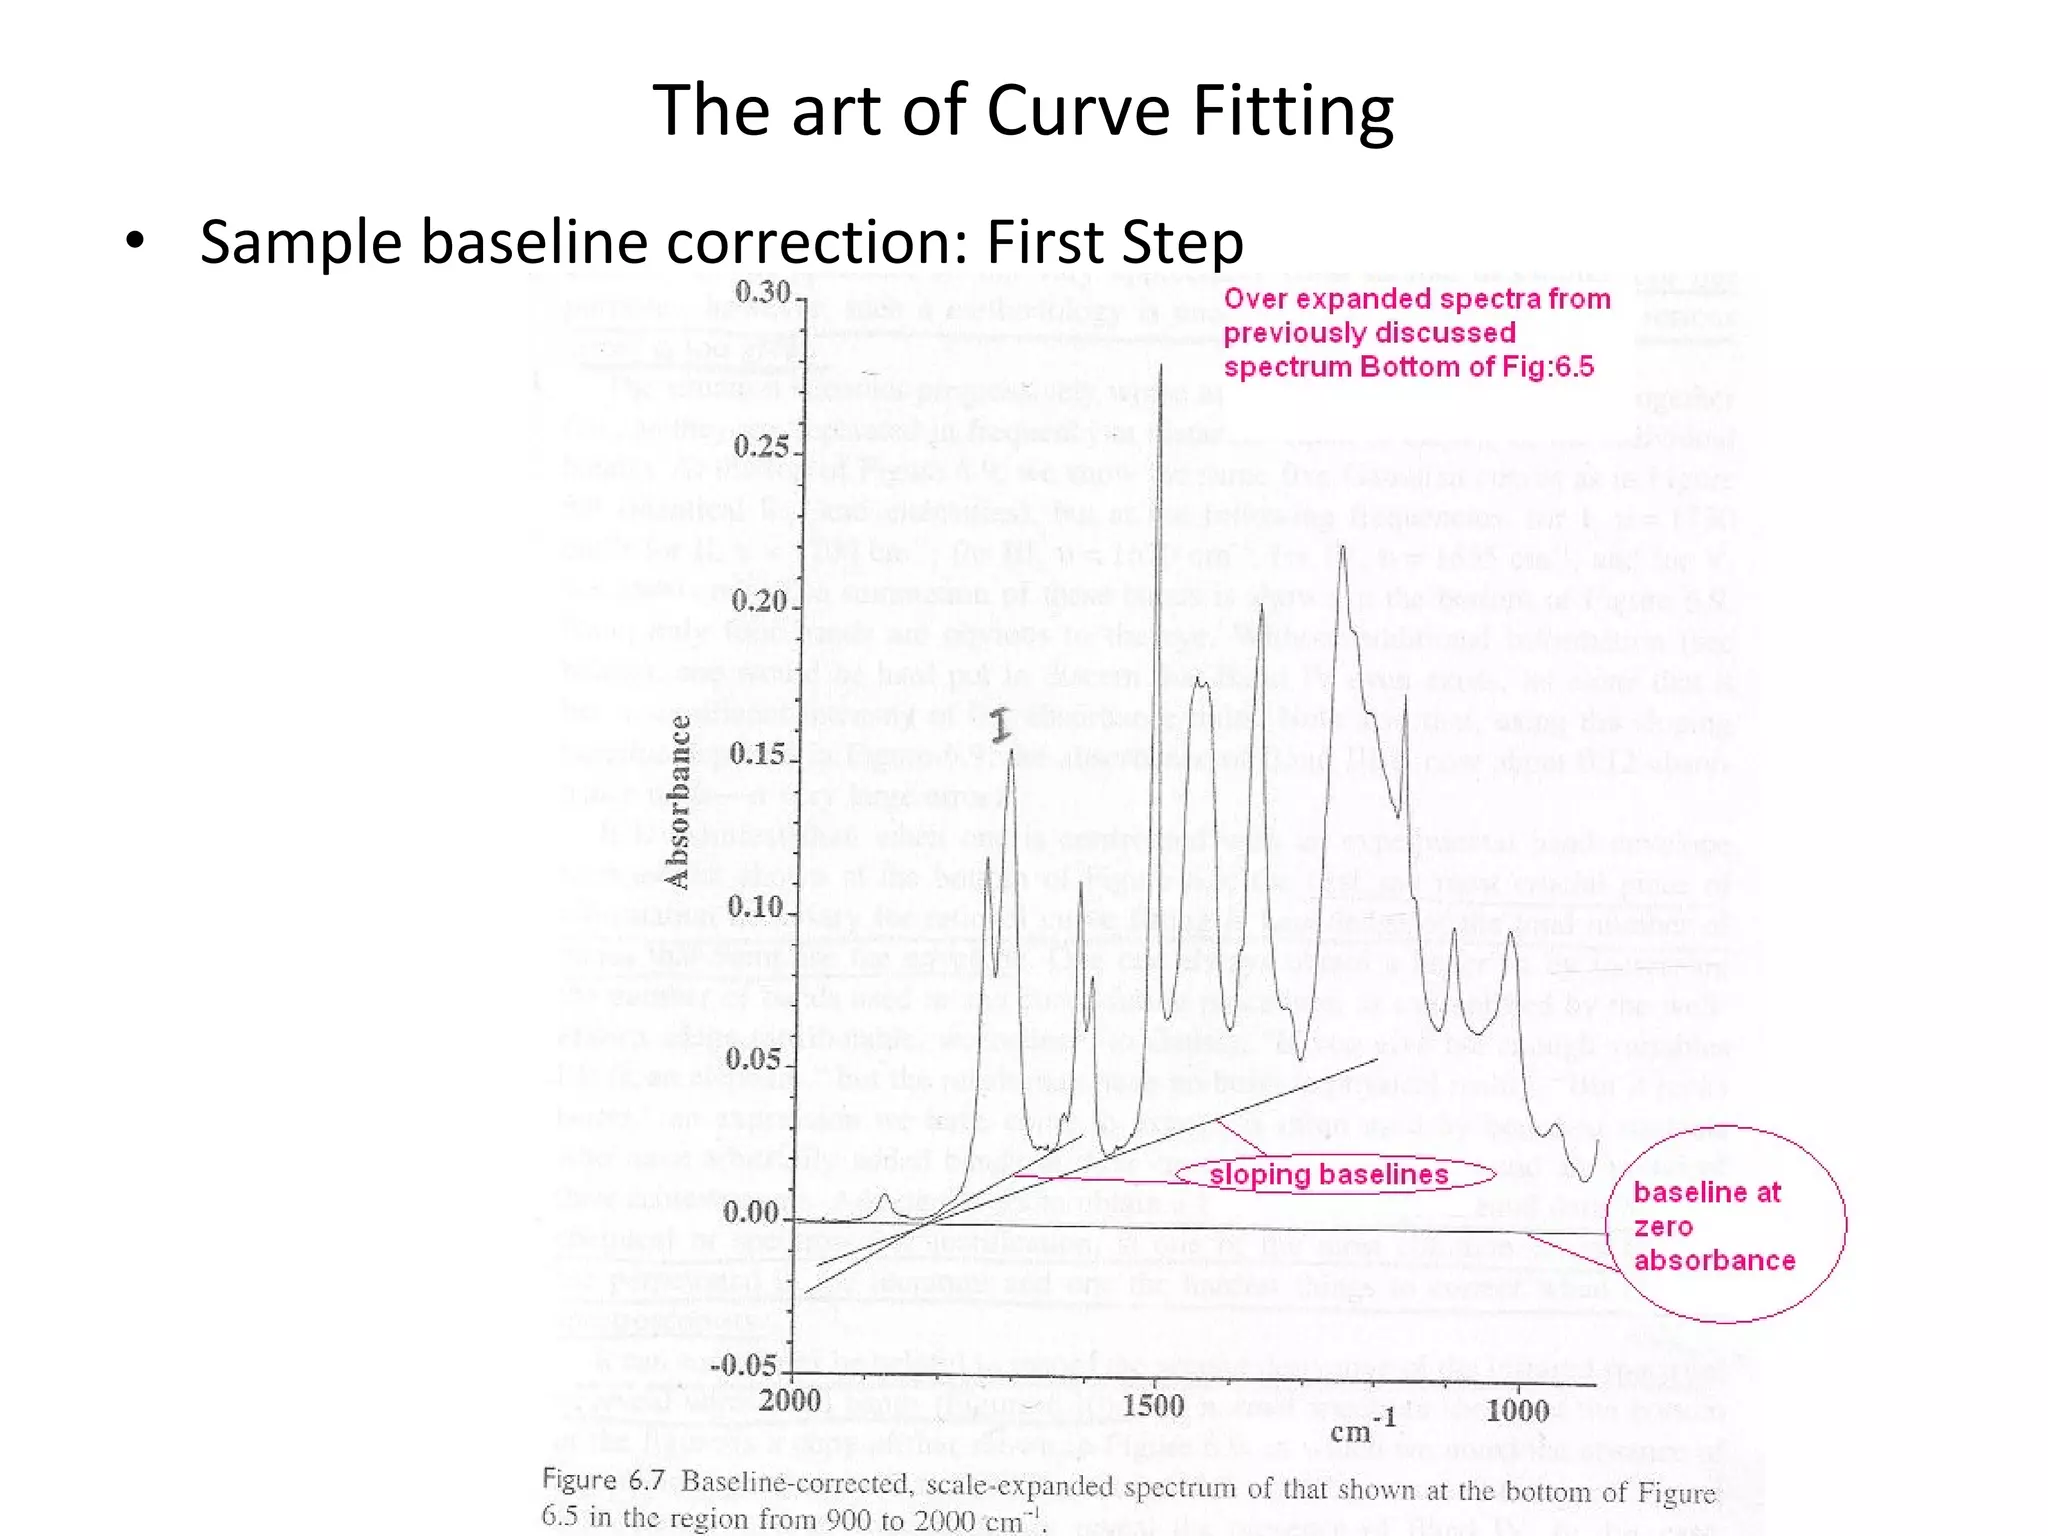
Baseline and playingwith spectra Consider the following spectrum with sloping baseline. 3 basic routes have been drawn here.
13.
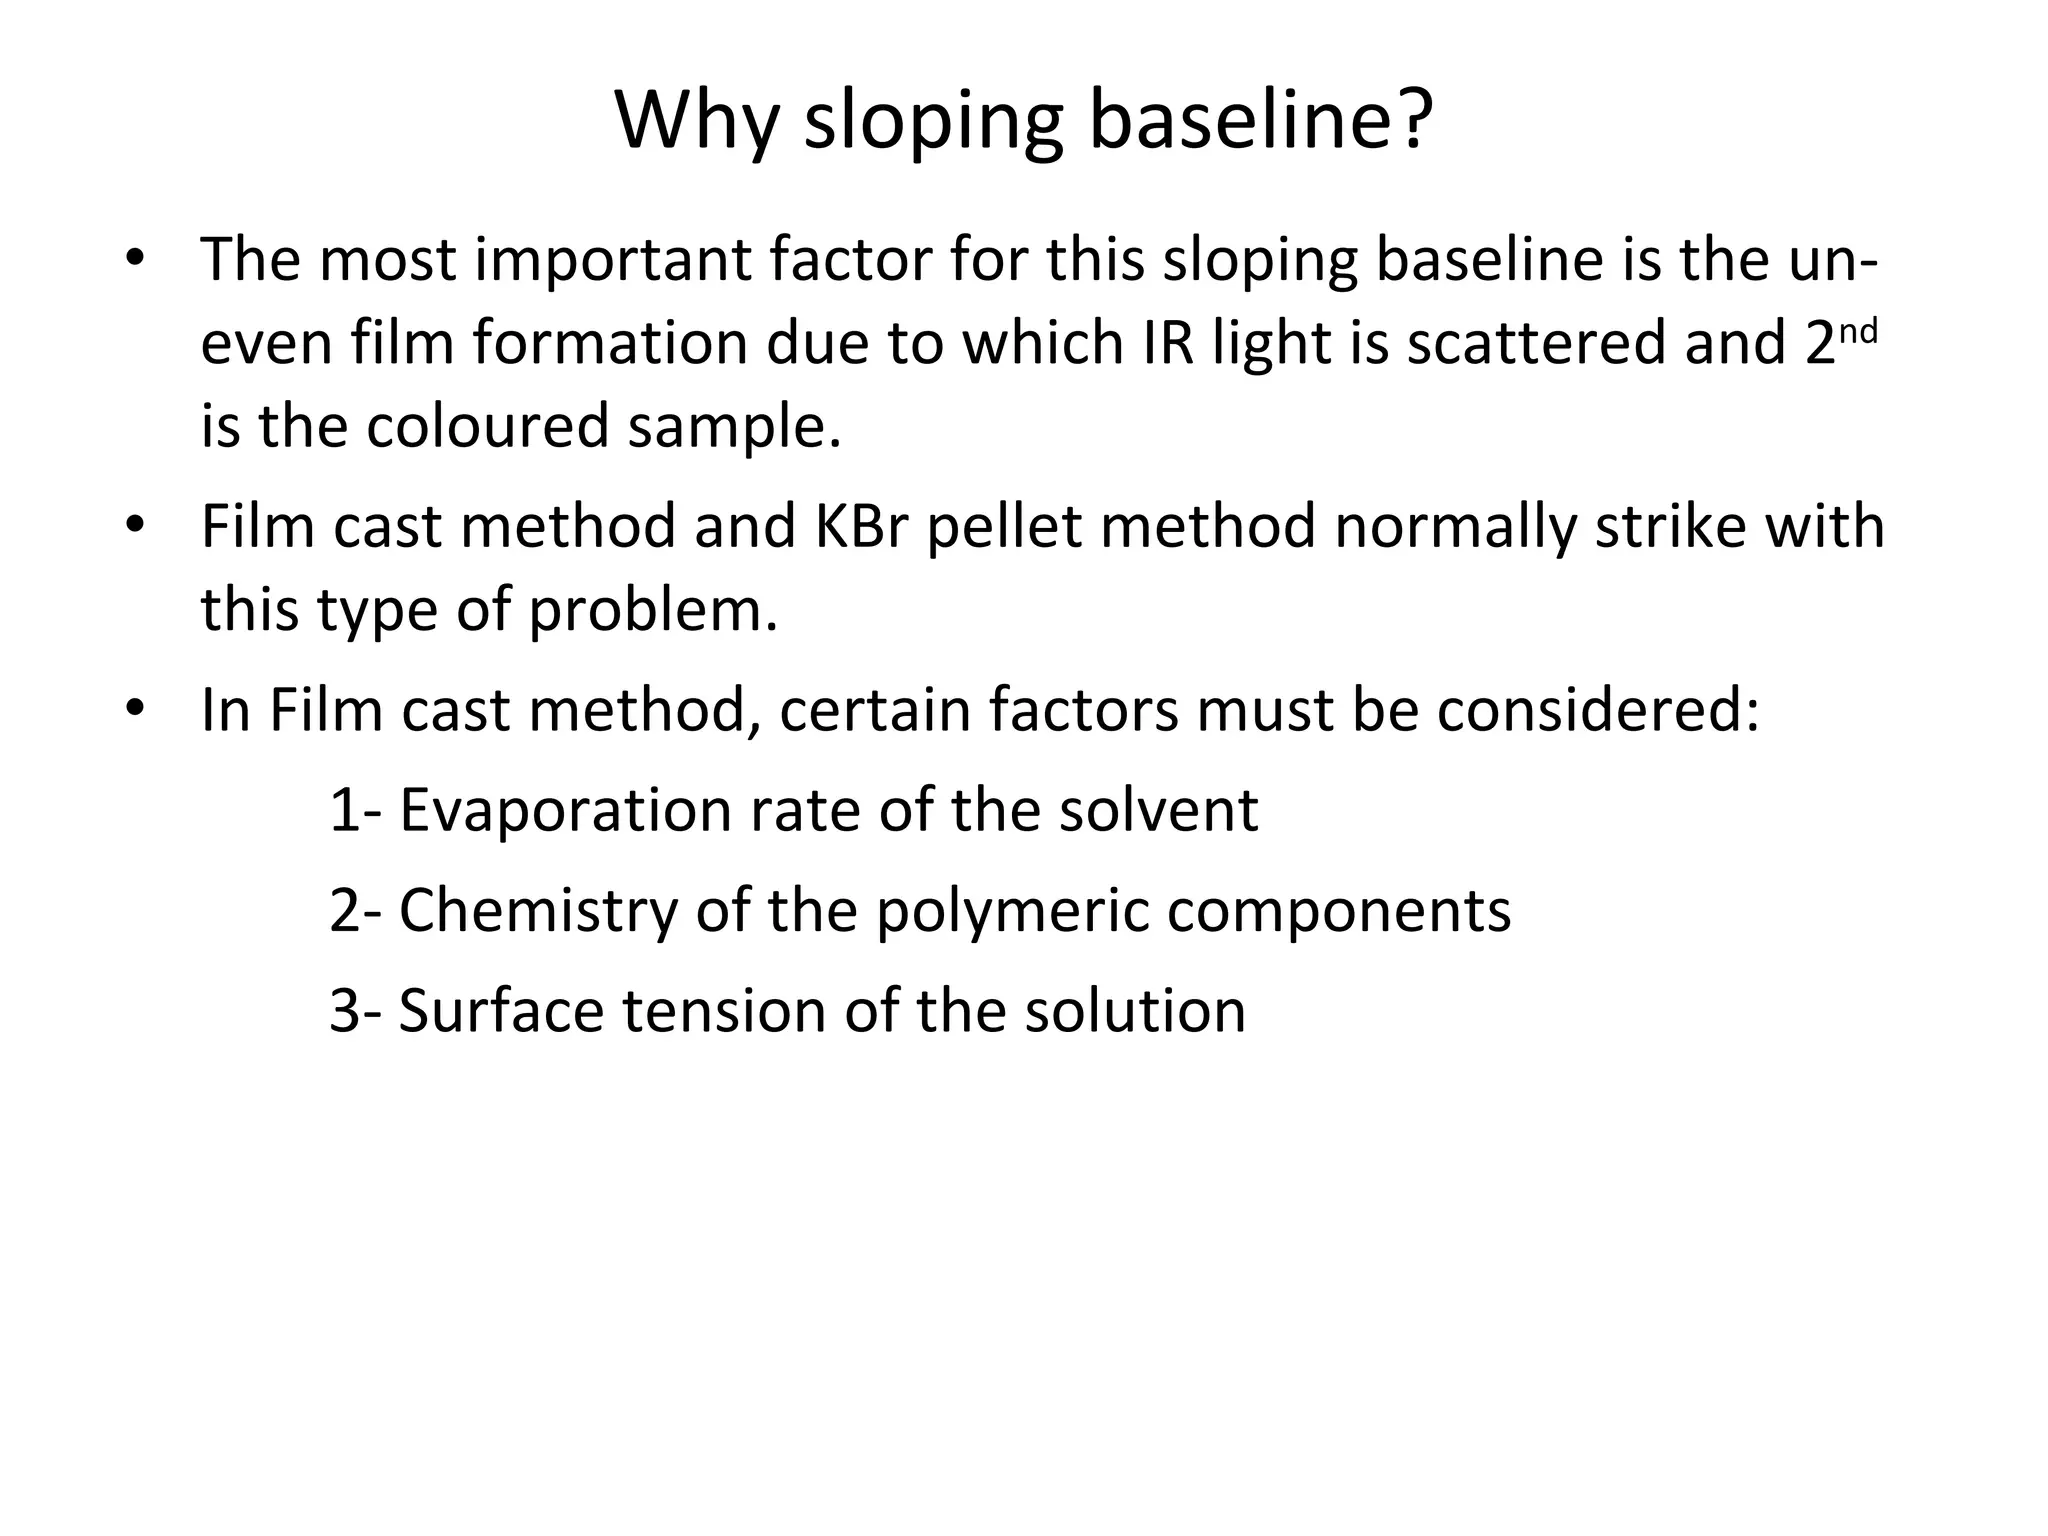
Why sloping baseline?The most important factor for this sloping baseline is the un-even film formation due to which IR light is scattered and 2 nd is the coloured sample. Film cast method and KBr pellet method normally strike with this type of problem. In Film cast method, certain factors must be considered: 1- Evaporation rate of the solvent 2- Chemistry of the polymeric components 3- Surface tension of the solution
14.
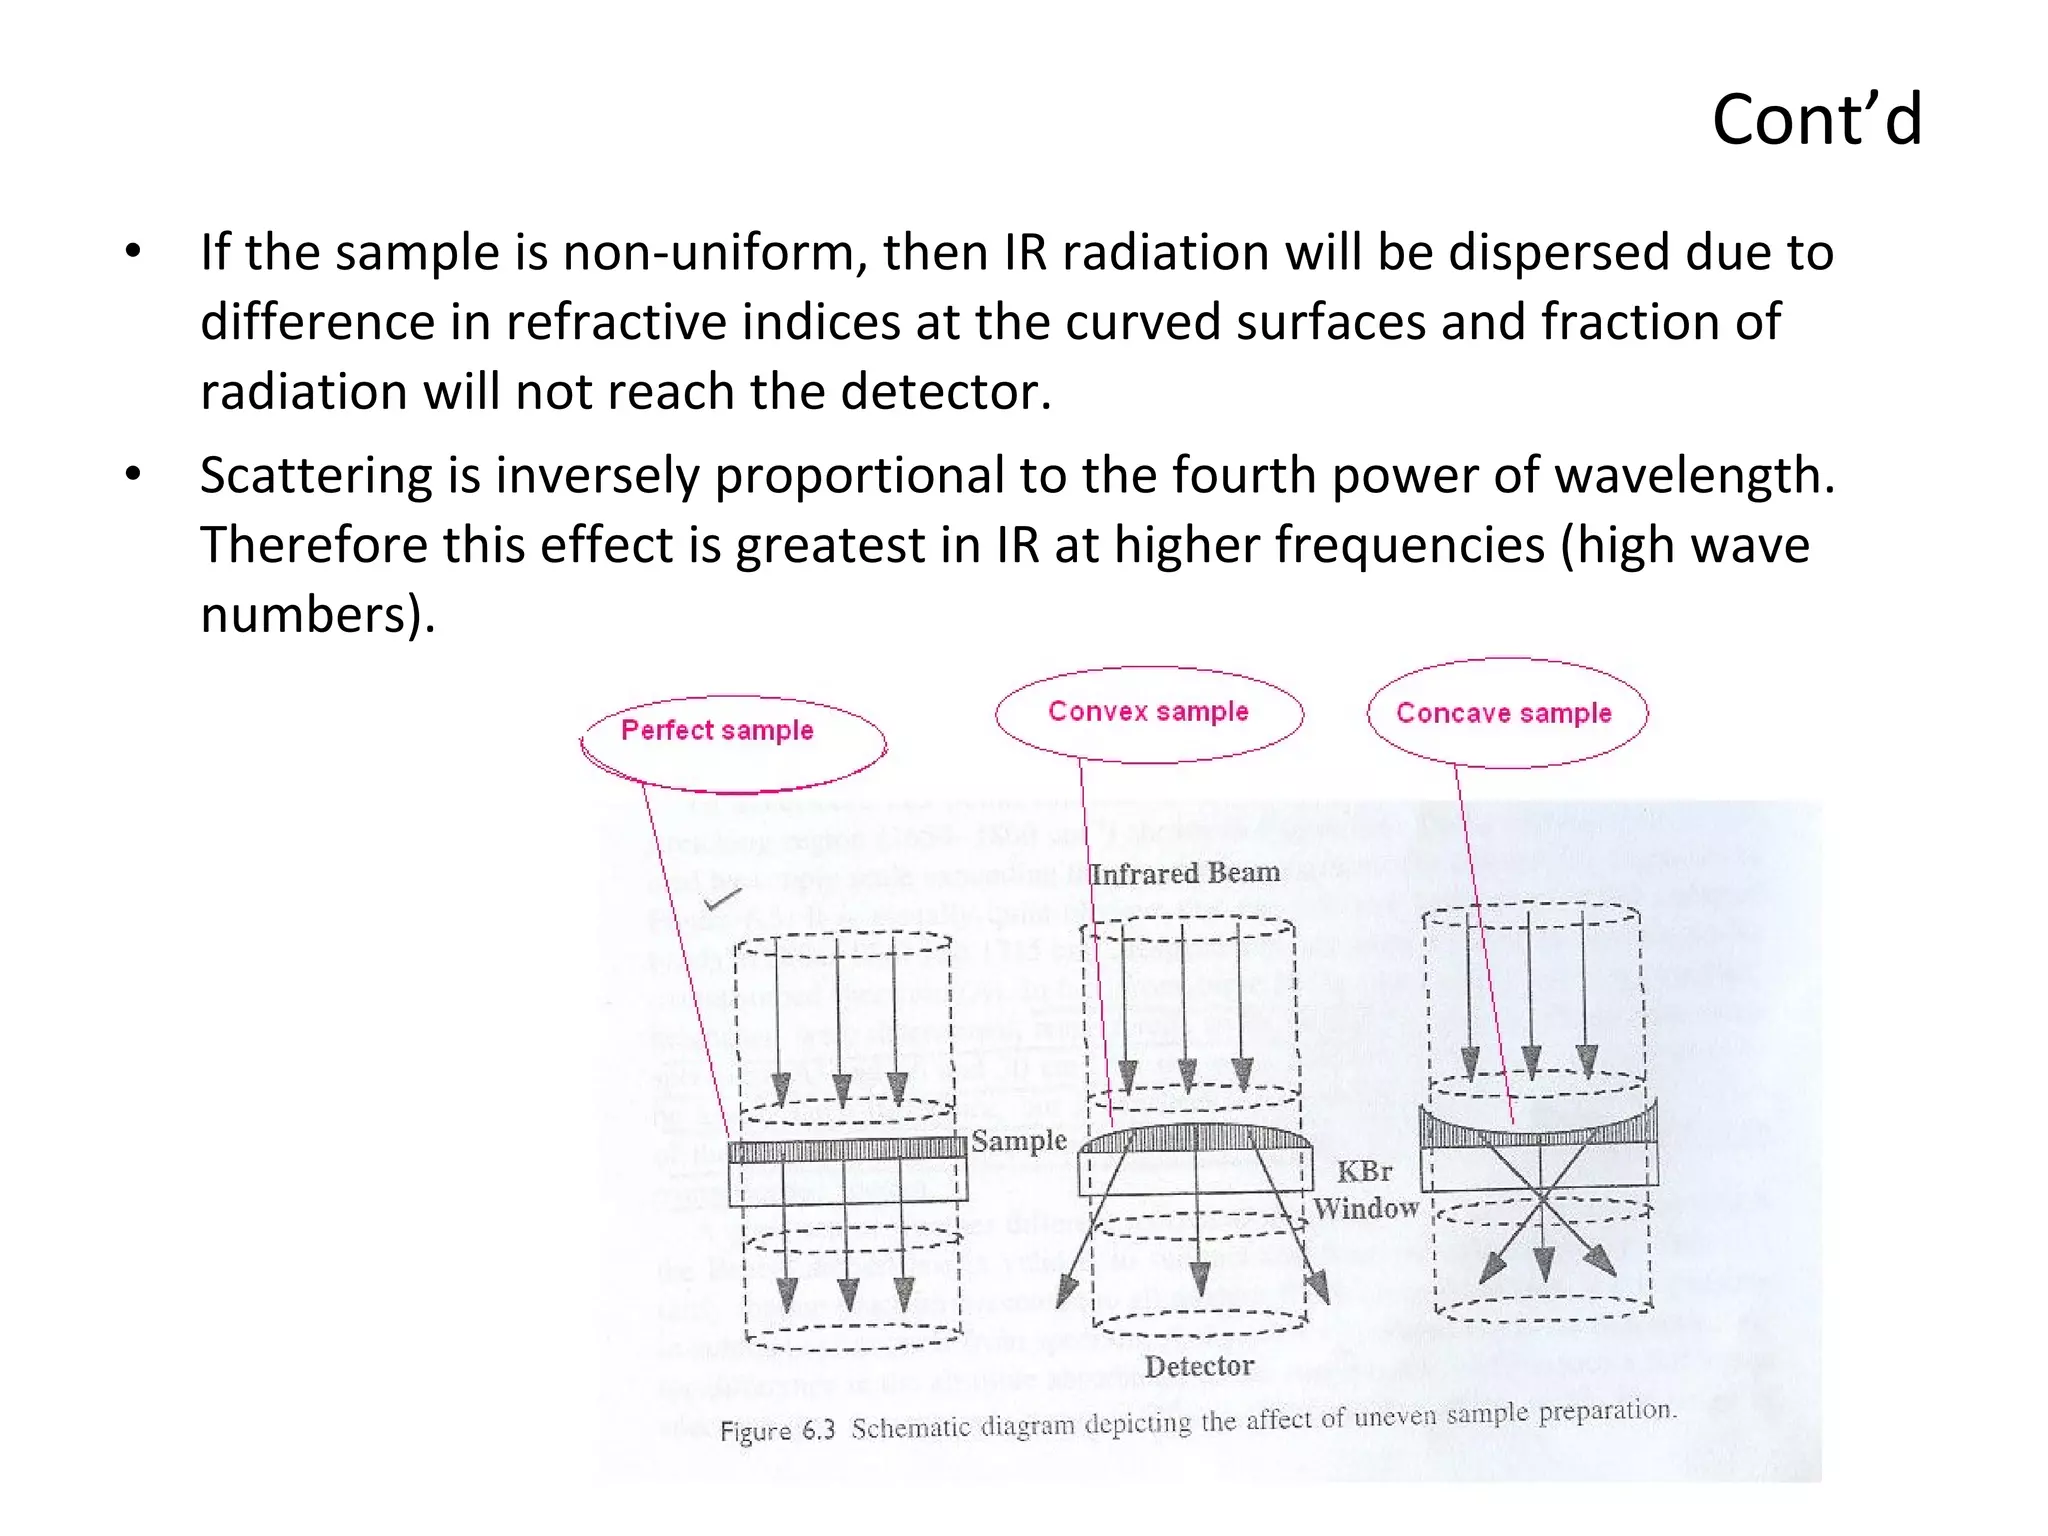
Cont’d If thesample is non-uniform, then IR radiation will be dispersed due to difference in refractive indices at the curved surfaces and fraction of radiation will not reach the detector. Scattering is inversely proportional to the fourth power of wavelength. Therefore this effect is greatest in IR at higher frequencies (high wave numbers).
15.
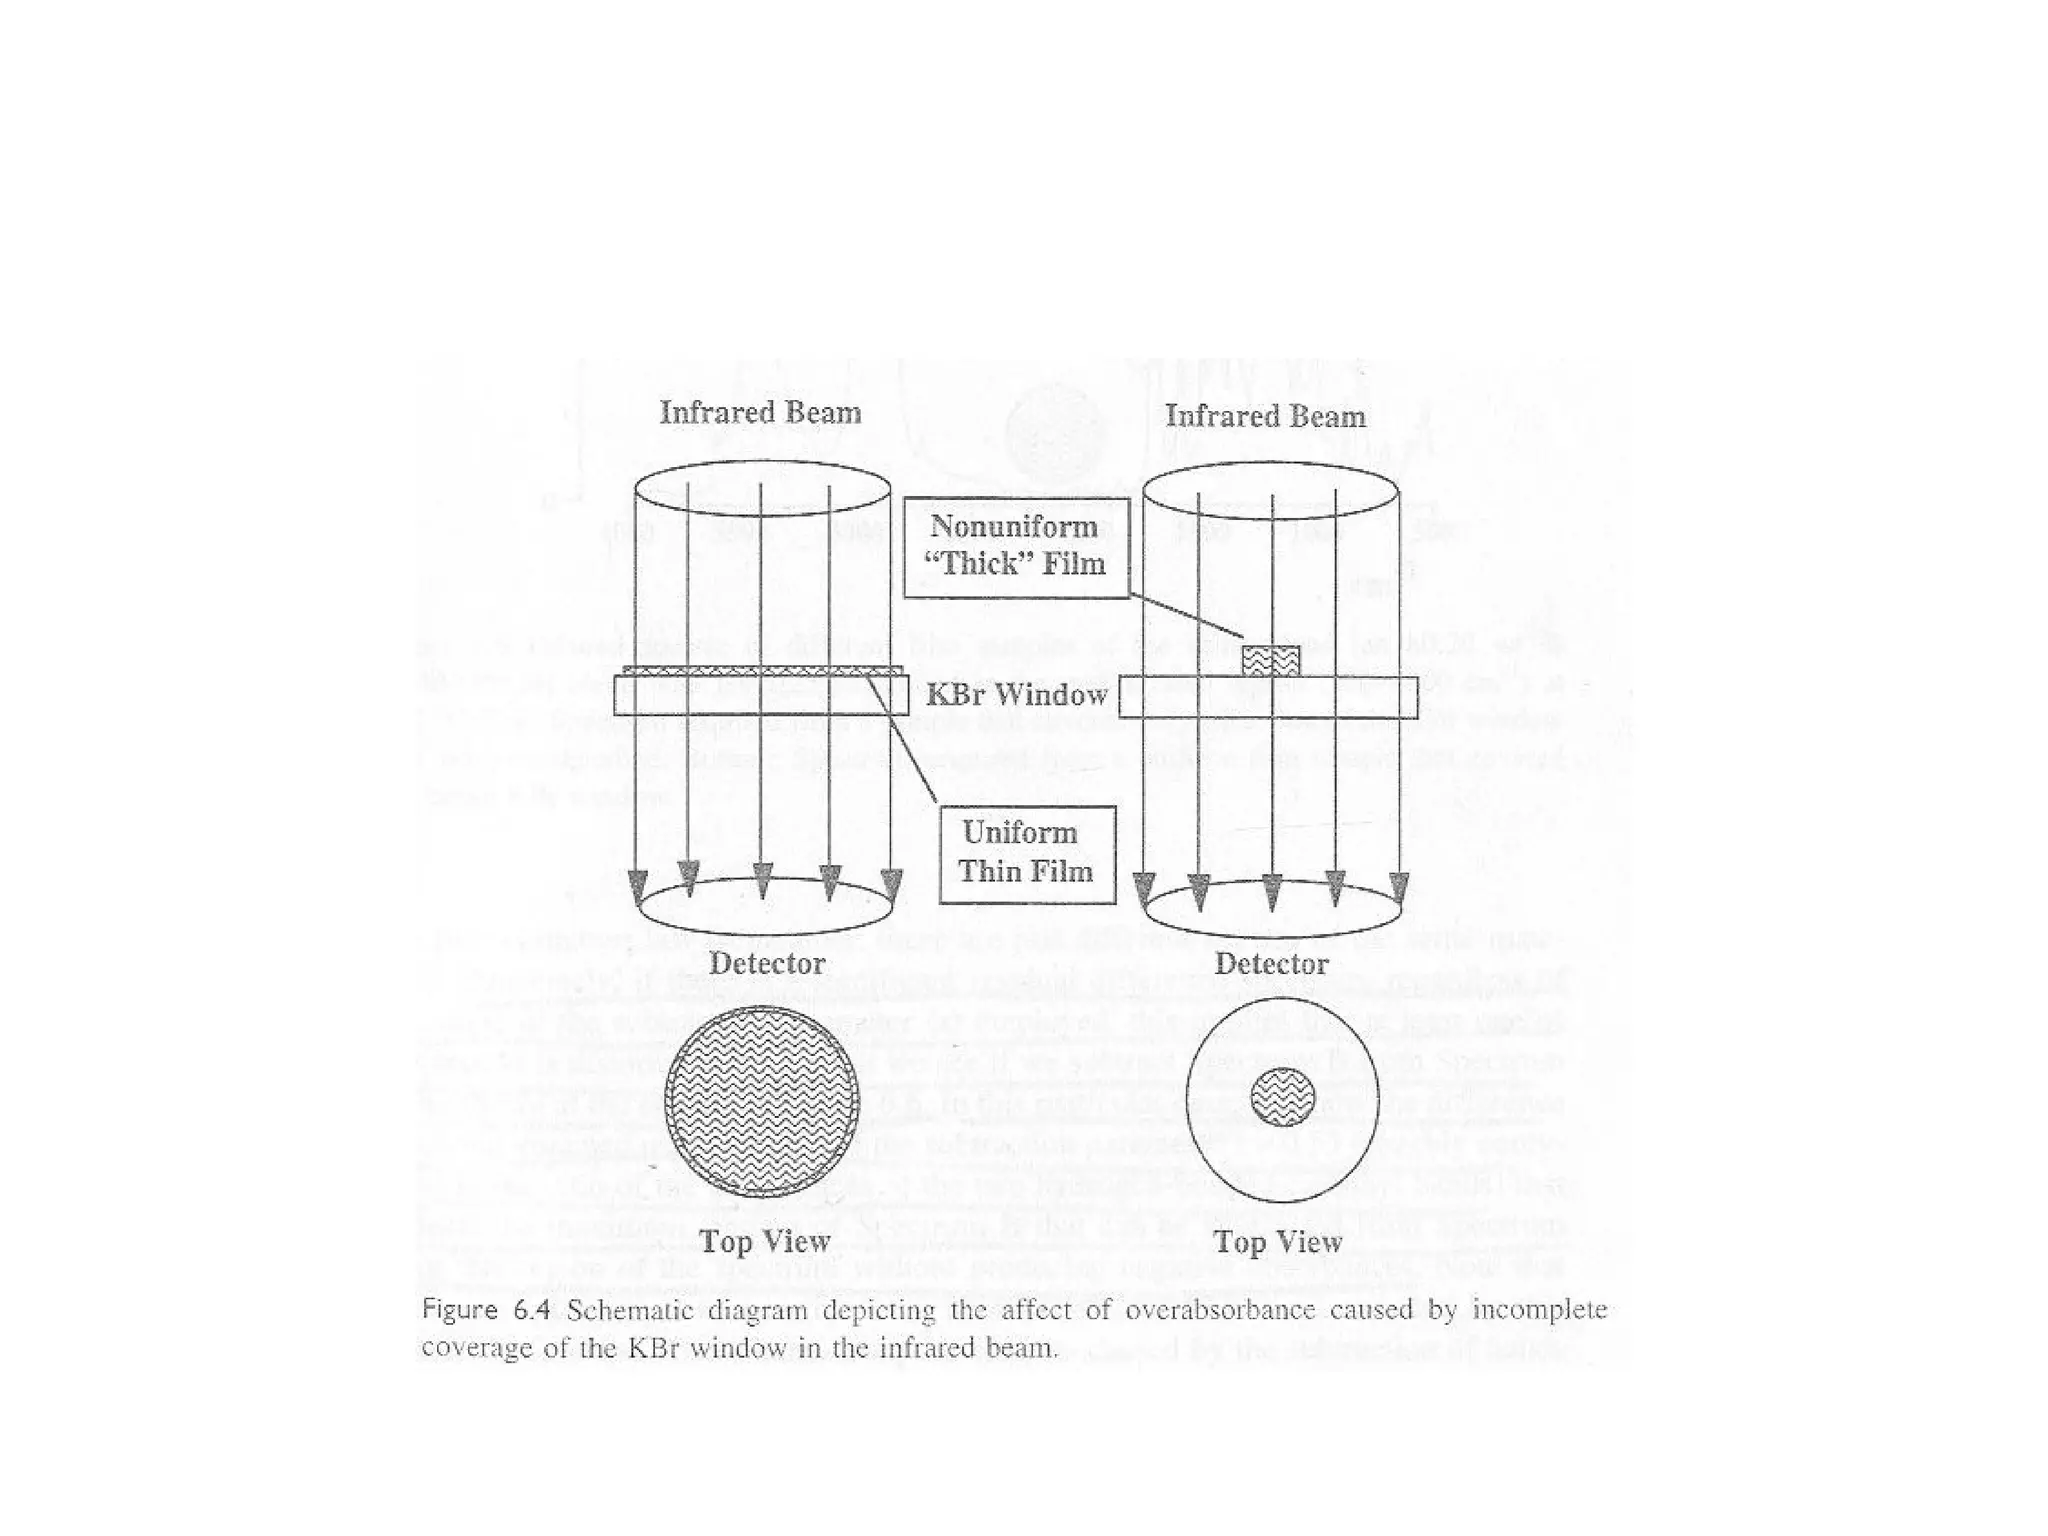
A good judgmentof the sample is that the absorbance should be with in 0.3-0.7 . Below 0.3, poor signals are observed which if interpreted would lead to serious errors. Modern FIR can go up to 0.05 absorbance units. But if more than 0.7, then bands are called over-absorbed and it goes out of Beer law range. This can never give good quantitative results. But if the following situation occurs:
16.
17.
18.
19.
The art ofCurve Fitting Sample baseline correction: First Step
20.
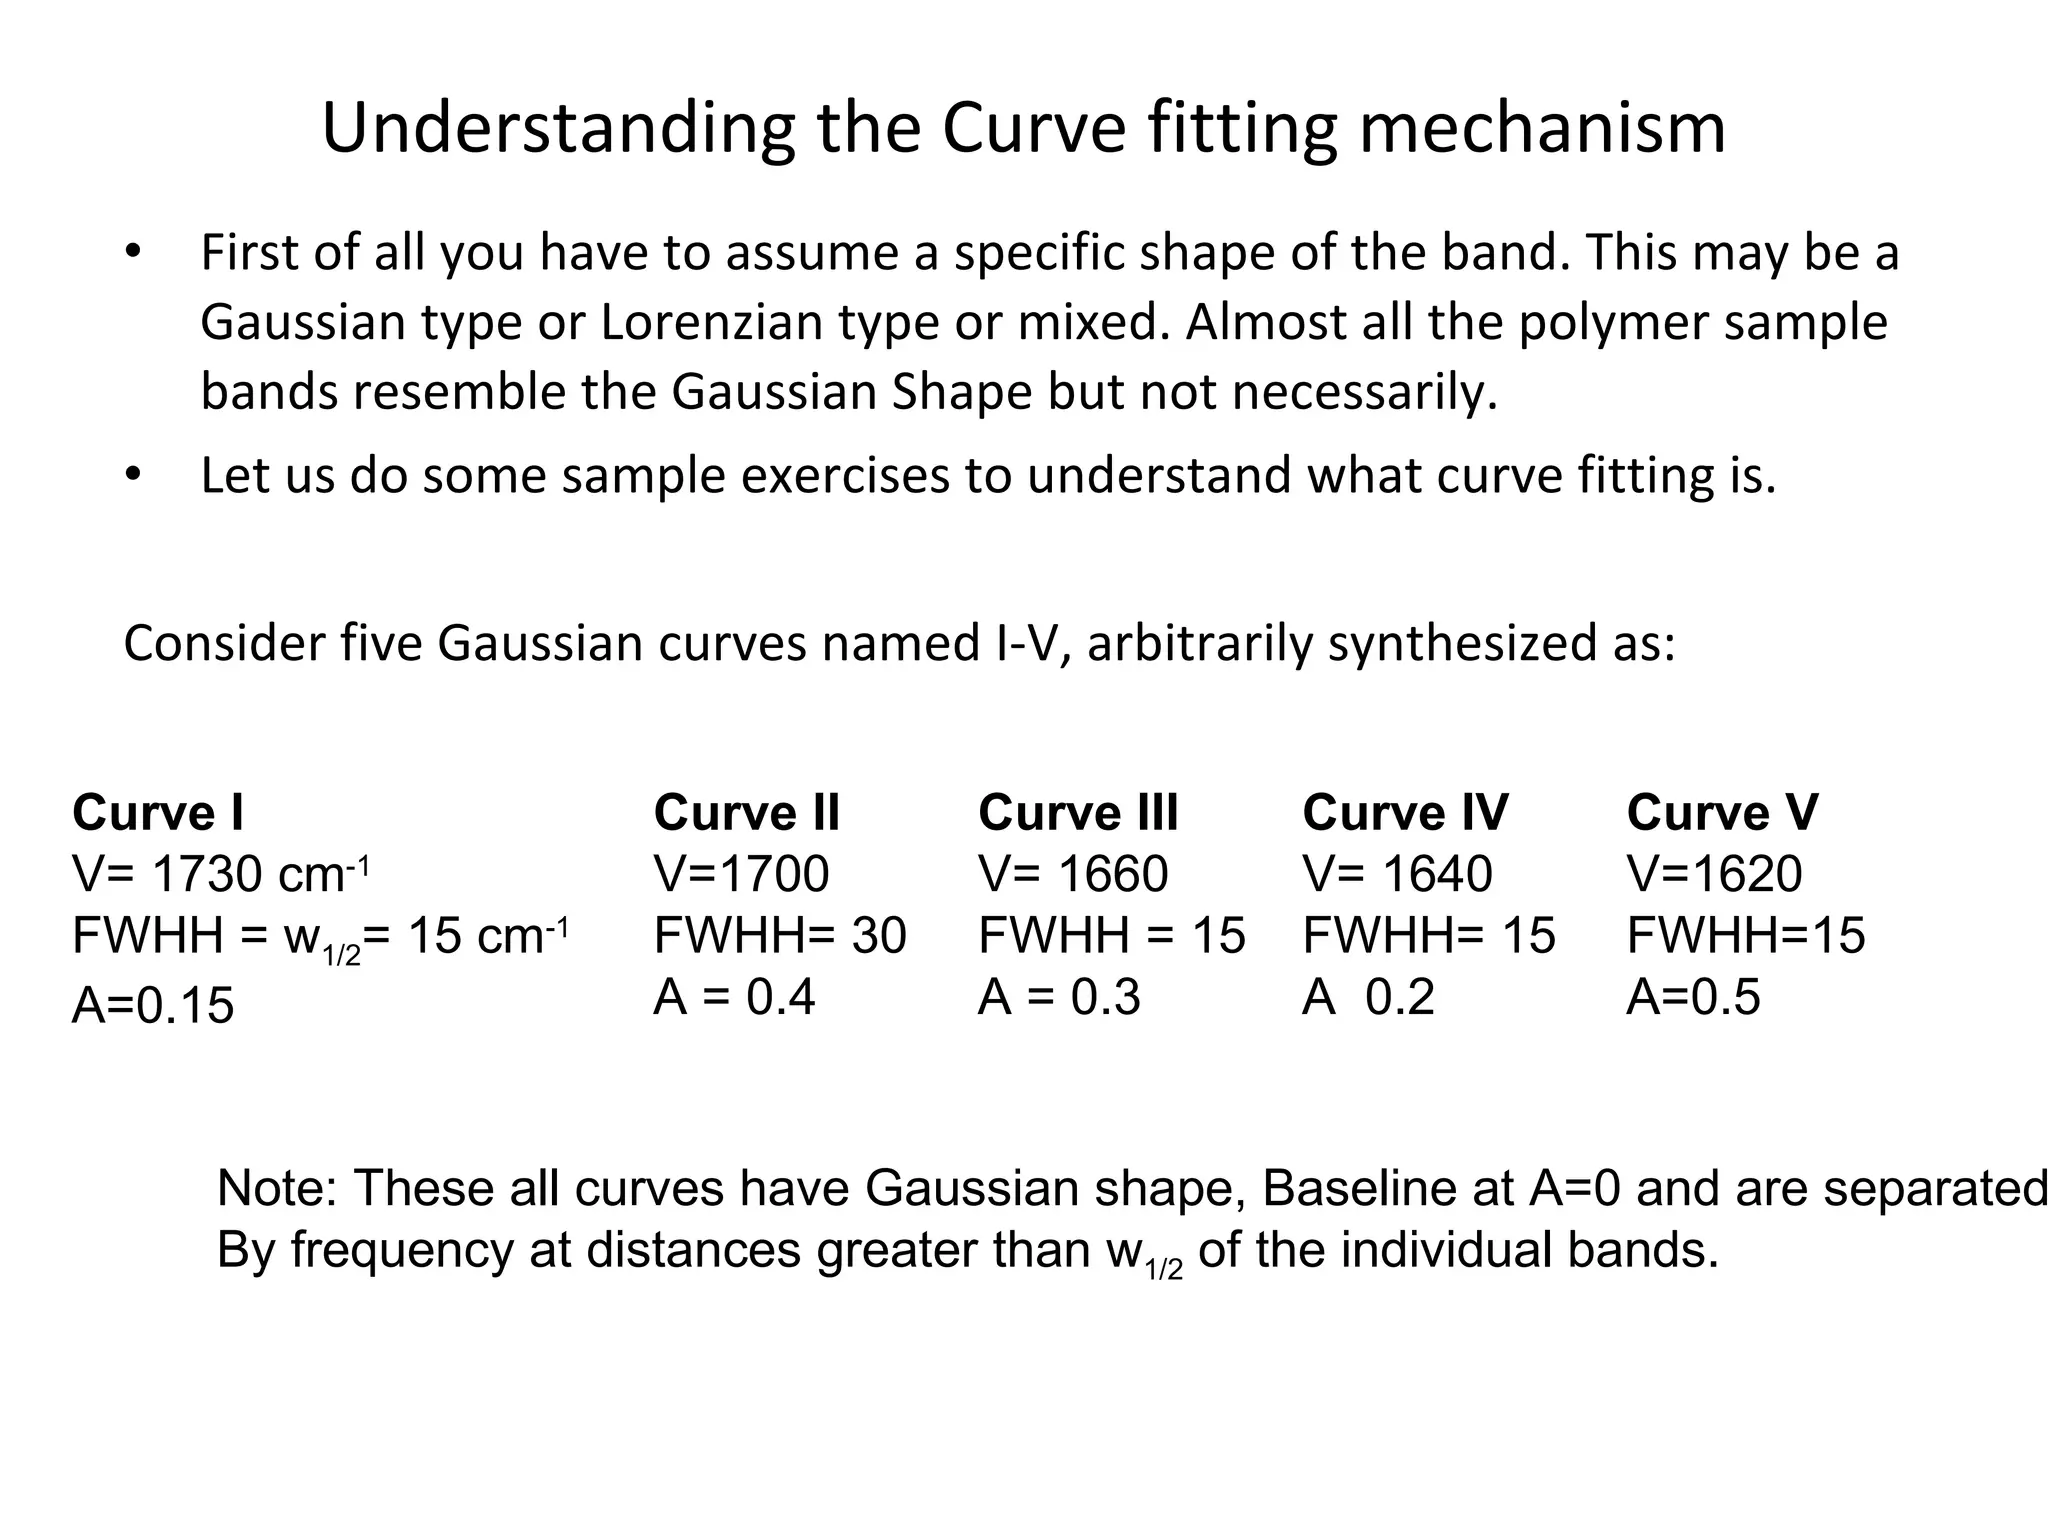
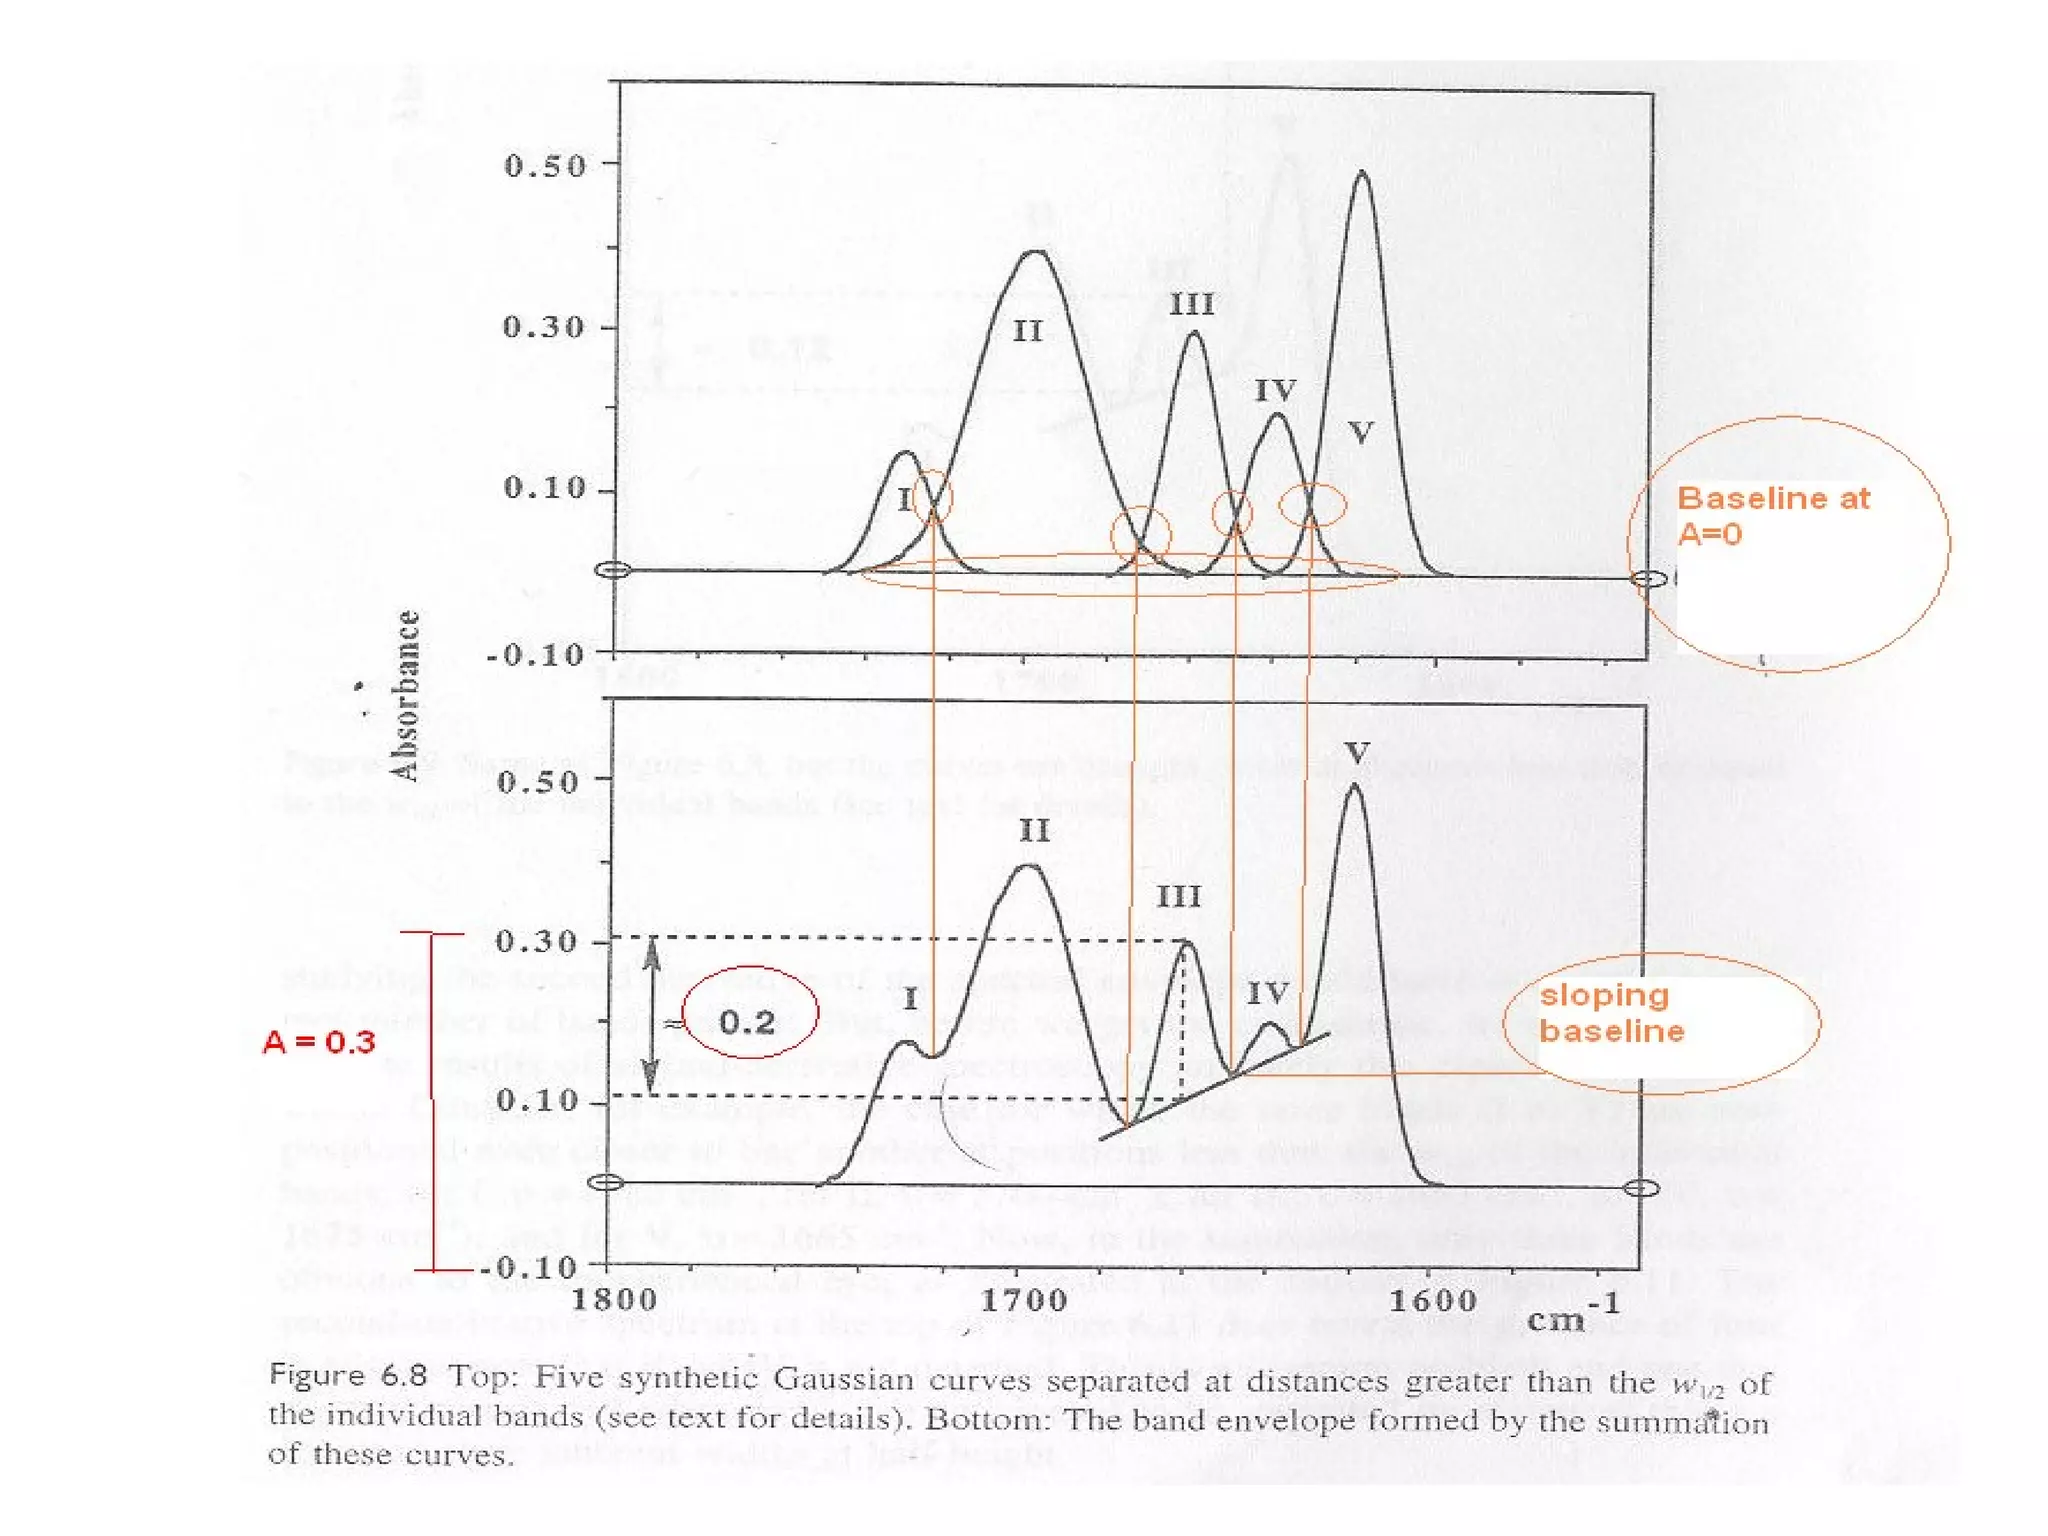
Understanding the Curvefitting mechanism First of all you have to assume a specific shape of the band. This may be a Gaussian type or Lorenzian type or mixed. Almost all the polymer sample bands resemble the Gaussian Shape but not necessarily. Let us do some sample exercises to understand what curve fitting is. Consider five Gaussian curves named I-V, arbitrarily synthesized as: Curve II V=1700 FWHH= 30 A = 0.4 Curve III V= 1660 FWHH = 15 A = 0.3 Curve IV V= 1640 FWHH= 15 A 0.2 Curve V V=1620 FWHH=15 A=0.5 Curve I V= 1730 cm -1 FWHH = w 1/2 = 15 cm -1 A=0.15 Note: These all curves have Gaussian shape, Baseline at A=0 and are separated By frequency at distances greater than w 1/2 of the individual bands.
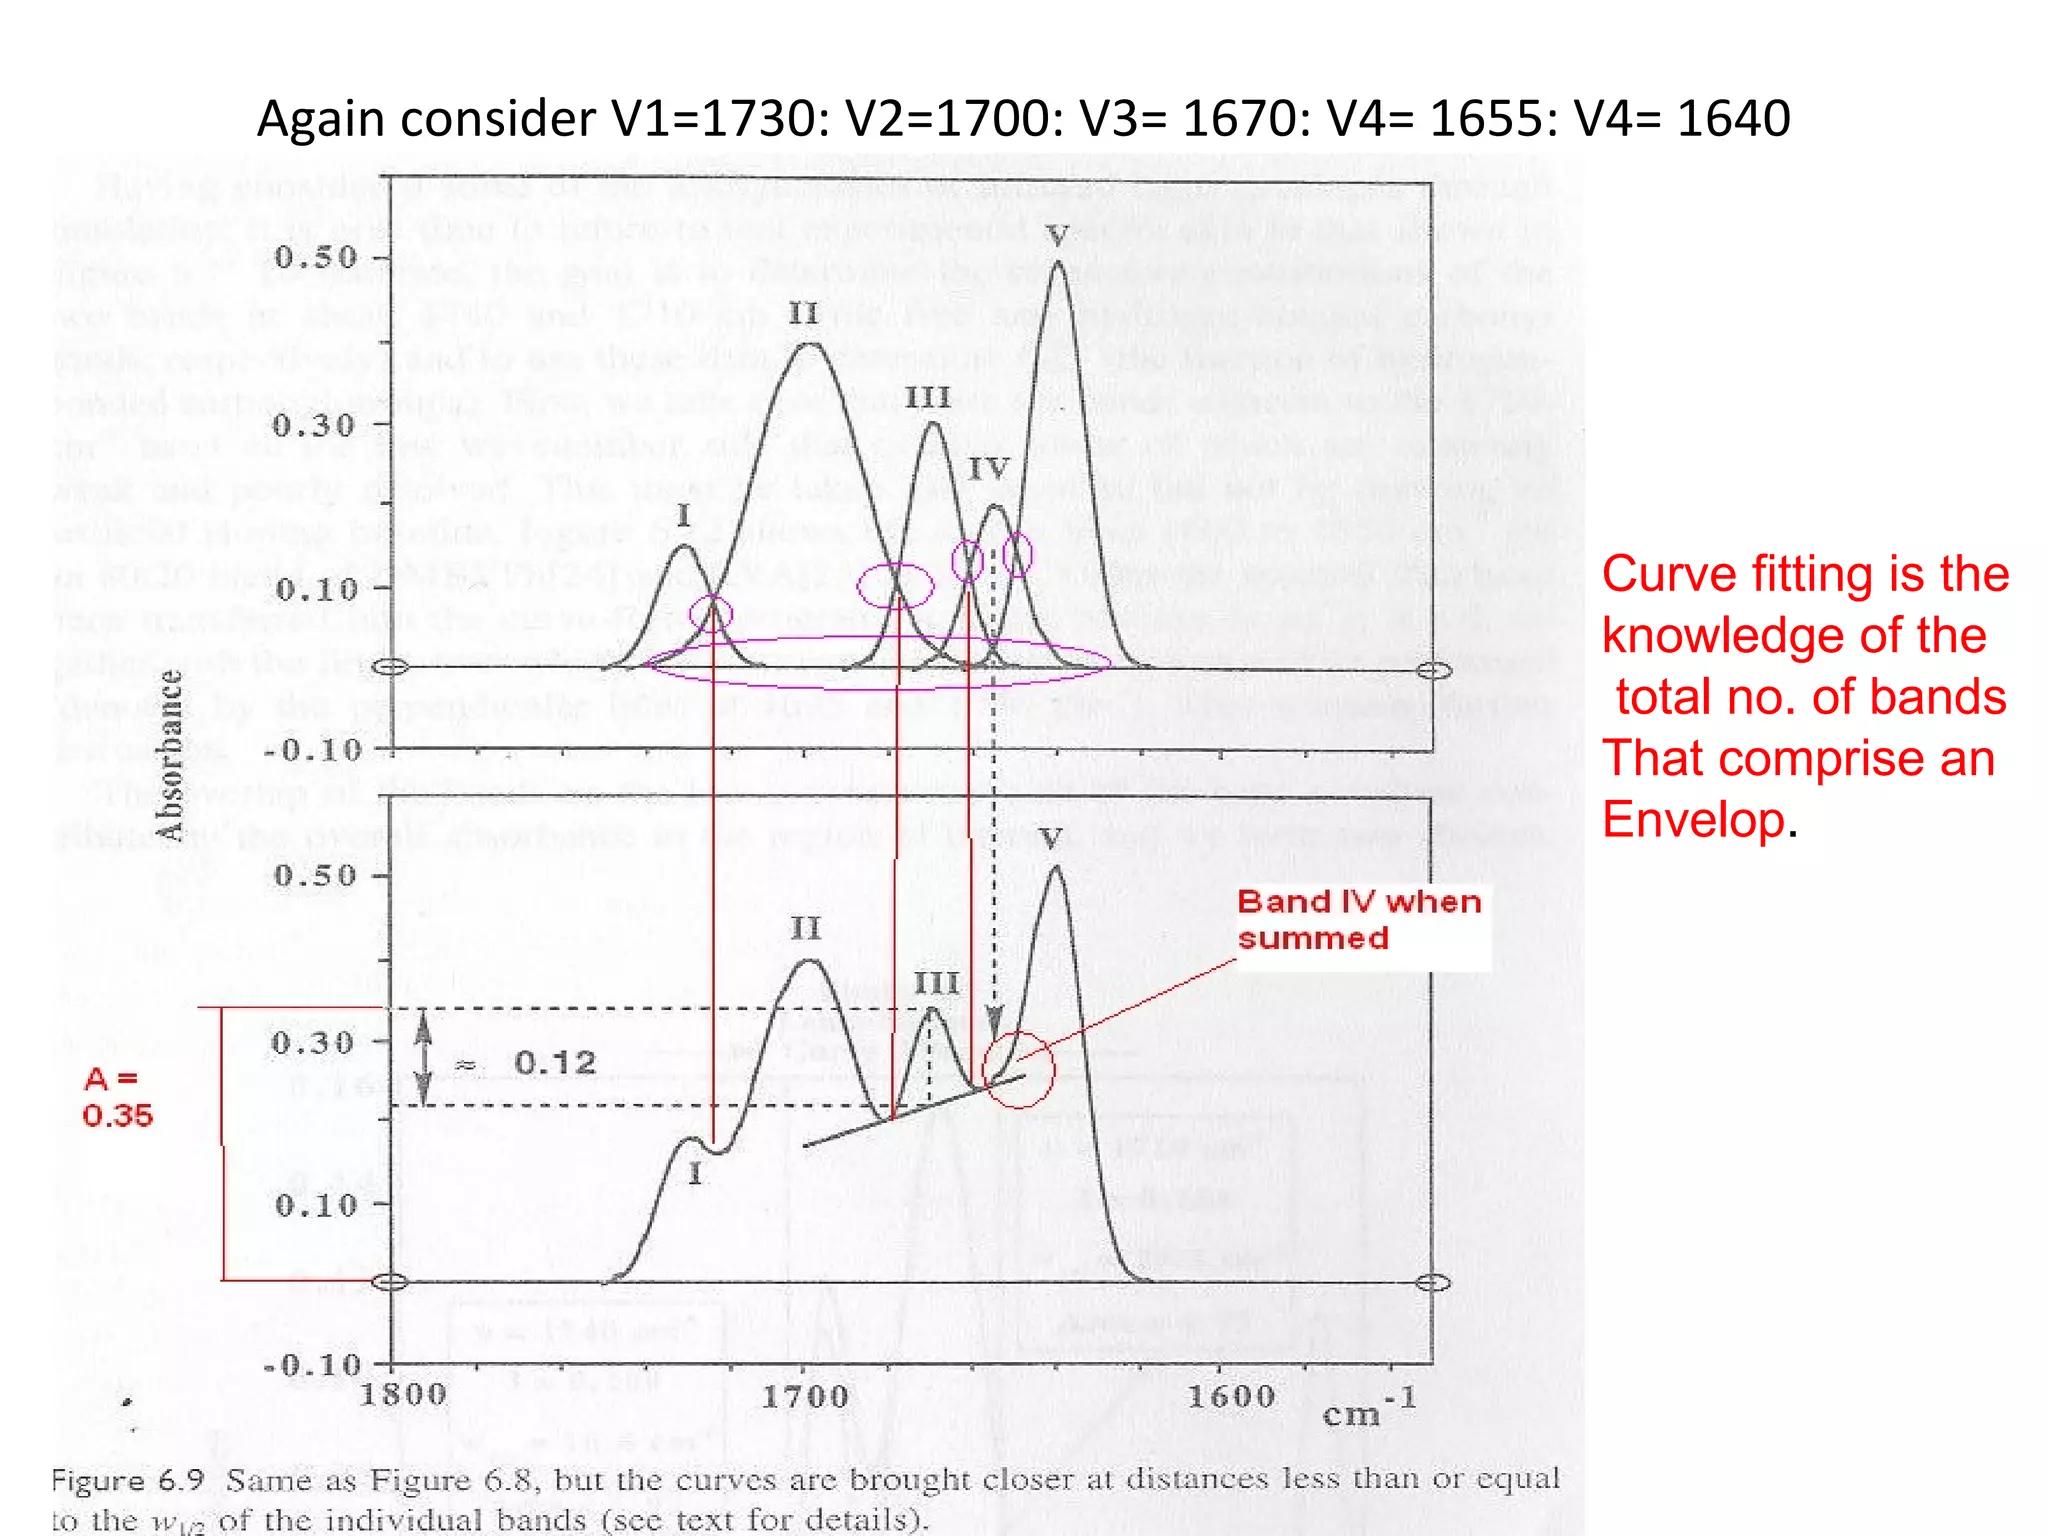
Again consider V1=1730:V2=1700: V3= 1670: V4= 1655: V4= 1640 Curve fitting is the knowledge of the total no. of bands That comprise an Envelop .
23.
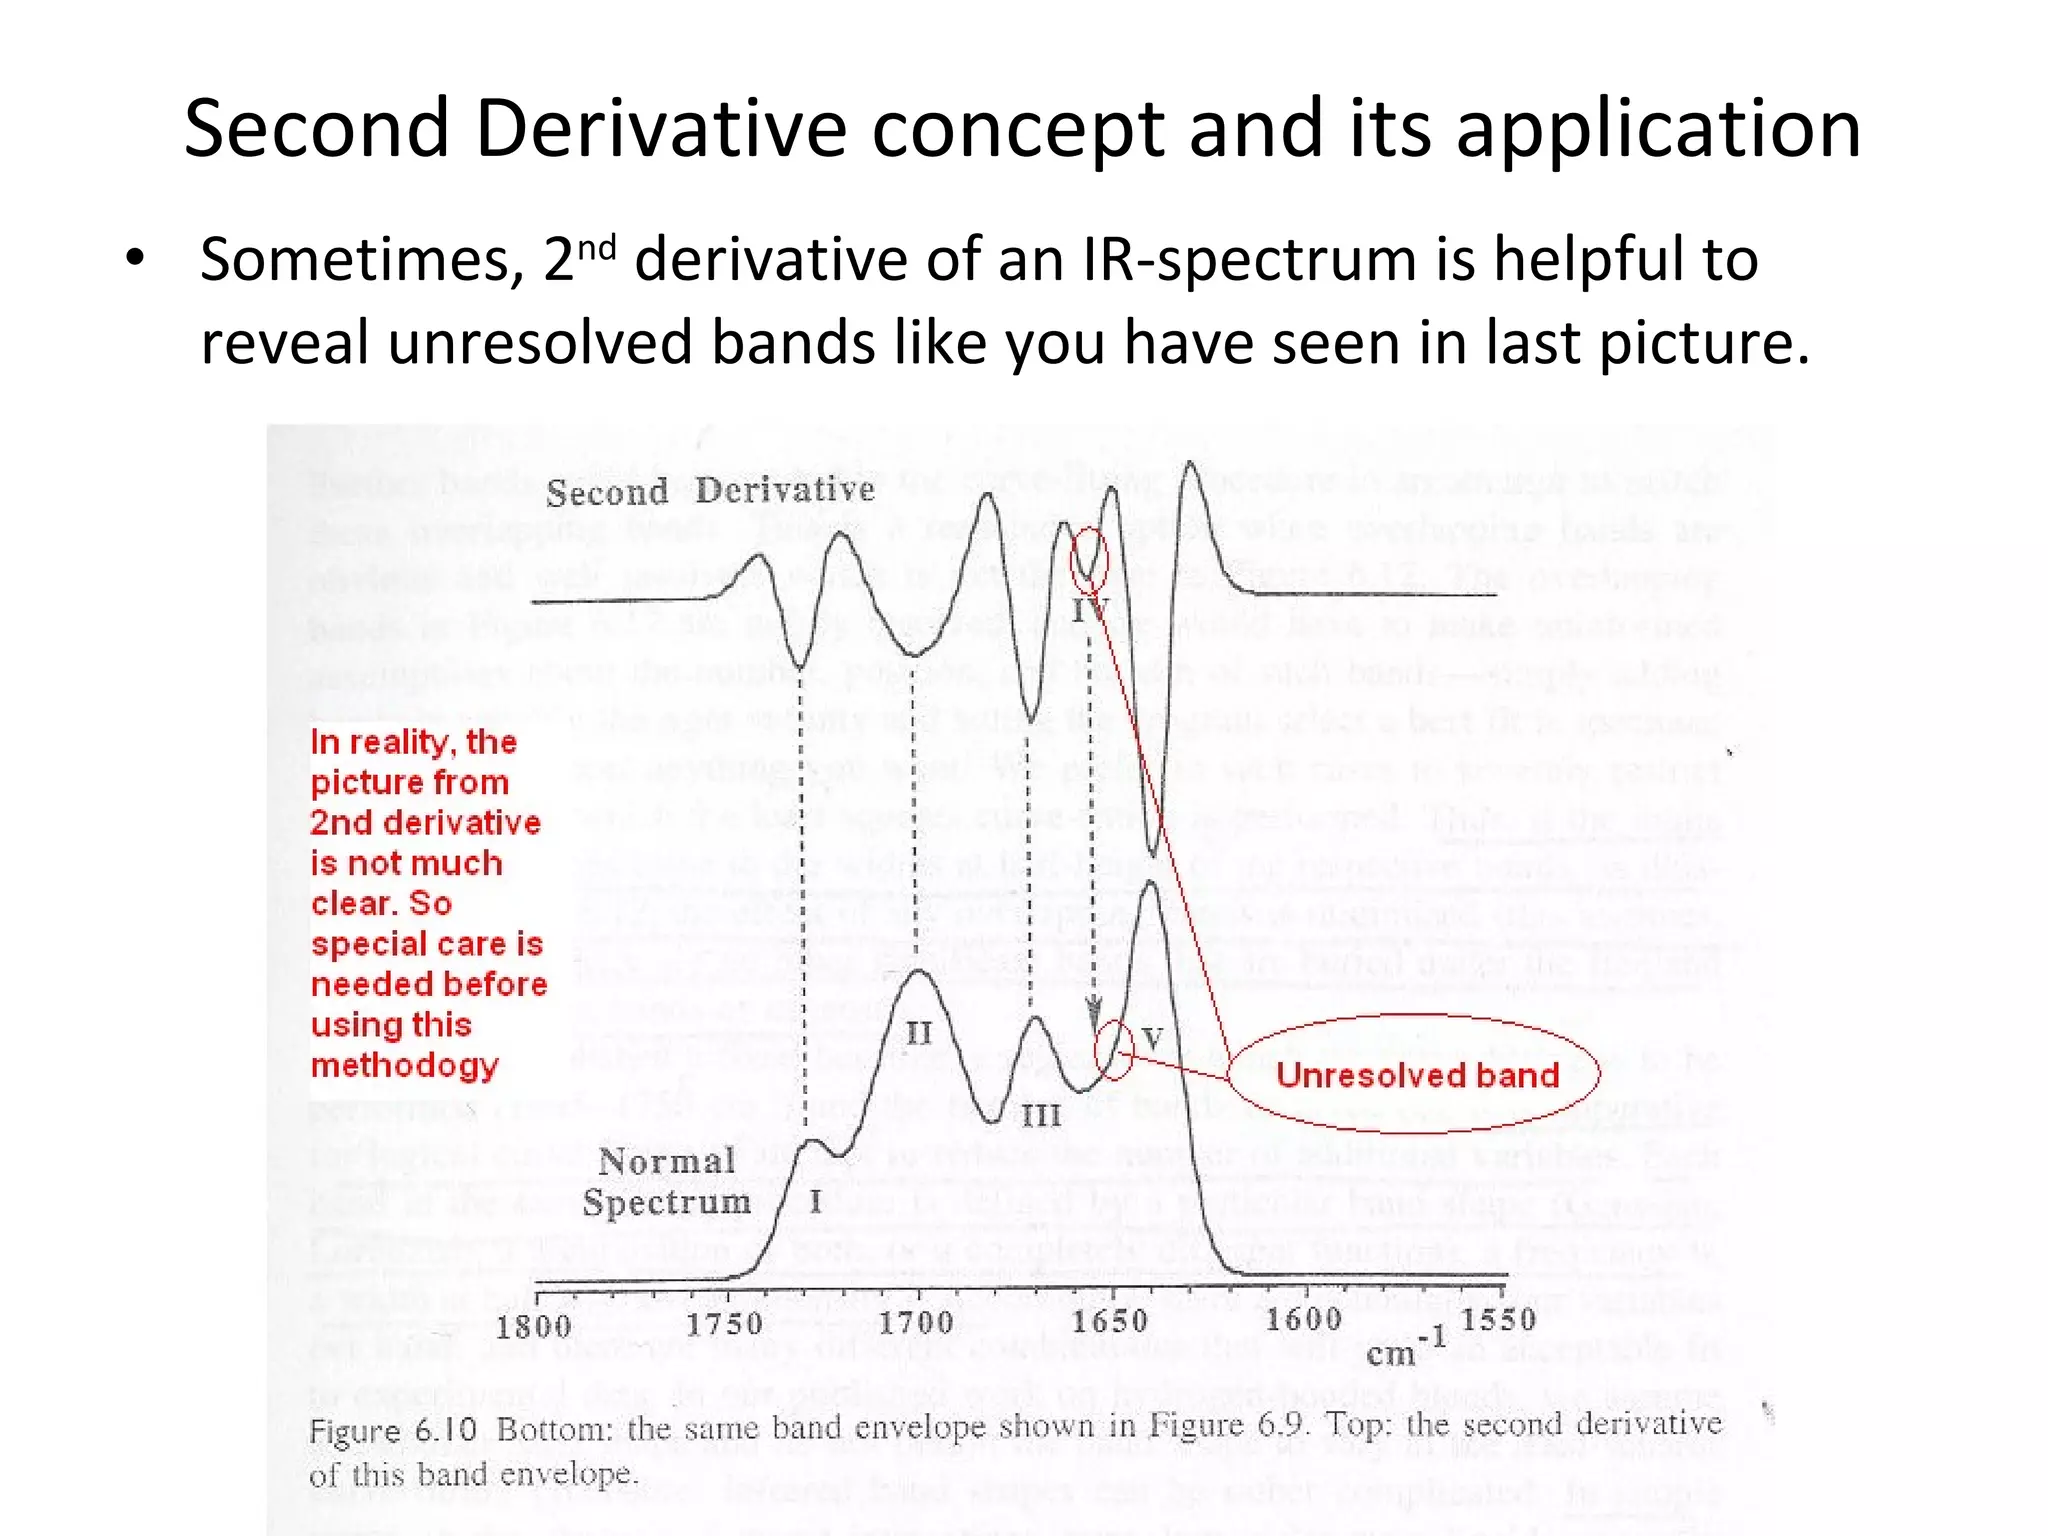
Second Derivative conceptand its application Sometimes, 2 nd derivative of an IR-spectrum is helpful to reveal unresolved bands like you have seen in last picture.


![THERMOGRAVIMETRY ANALYSIS [TGA] AS PER PCI[M.PHARM]](https://cdn.slidesharecdn.com/ss_thumbnails/49-191219085241-thumbnail.jpg?width=640&height=640&fit=bounds)


![UV SPECTROSCOPY [ULTRA-VIOLET SPECTROSCOPY]](https://cdn.slidesharecdn.com/ss_thumbnails/40-191218142647-thumbnail.jpg?width=640&height=640&fit=bounds)


