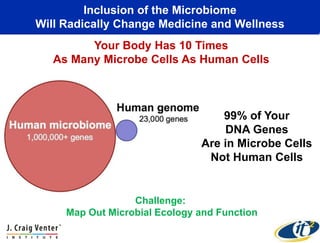
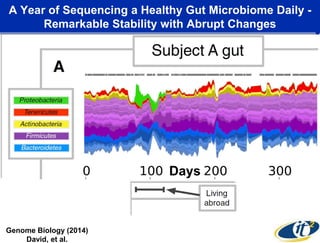
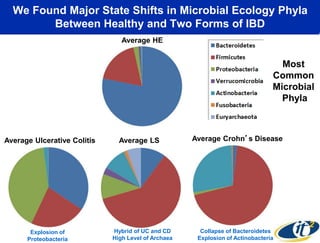
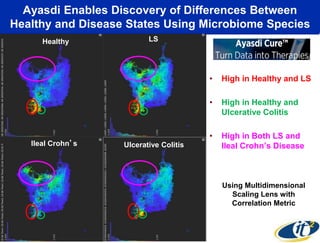
“Mapping the Human Gut Microbiome in Health and 
Disease Using Sequencing, Supercomputing, 
and Data Analysis” 
Invited Talk Delivered by Mehrdad Yazdani, Calit2 
Ayasdi Sponsored Lunch & Learn 
American Society of Human Genetics (ASHG) 
San Diego Convention Center 
October 19, 2014 
Dr. Larry Smarr 
Director, California Institute for Telecommunications and Information Technology 
Harry E. Gruber Professor, 
Dept. of Computer Science and Engineering 
Jacobs School of Engineering, UCSD 
http://lsmarr.calit2.net 
1
Inclusion of the Microbiome 
Will Radically Change Medicine and Wellness 
Your Body Has 10 Times 
As Many Microbe Cells As Human Cells 
99% of Your 
DNA Genes 
Are in Microbe Cells 
Not Human Cells 
Challenge: 
Map Out Microbial Ecology and Function
A Year of Sequencing a Healthy Gut Microbiome Daily - 
Remarkable Stability with Abrupt Changes 
Days 
Genome Biology (2014) 
David, et al.
To Map Out the Dynamics of Autoimmune Microbiome Ecology 
Couples Next Generation Genome Sequencers to Big Data Supercomputers 
• Metagenomic Sequencing 
– JCVI Produced ~150 Billion DNA Bases From 
Seven of LS Stool Samples Over 1.5 Years 
– We Downloaded ~3 Trillion DNA Bases 
From NIH Human Microbiome Program Data Base 
– 255 Healthy People, 21 with IBD 
• Supercomputing (Weizhong Li, JCVI/HLI/UCSD): 
– ~180,000 Core-Hours SDSC’s Gordon 
– ~35,000 Core-Hours Dell HPC Cloud 
• Produced Relative Abundance of ~10,000 Bacteria, 
Archaea, Viruses in ~300 People 
– ~3Million Filled Spreadsheet Cells 
Illumina HiSeq 2000 at JCVI 
SDSC Gordon Data Supercomputer
We Found Major State Shifts in Microbial Ecology Phyla 
Between Healthy and Two Forms of IBD 
Most 
Common 
Microbial 
Phyla 
Average HE 
Average Ulcerative Colitis Average LS Average Crohn’s Disease 
Collapse of Bacteroidetes 
Explosion of Actinobacteria 
Explosion of 
Proteobacteria 
Hybrid of UC and CD 
High Level of Archaea
Using Ayasdi to Discover 
Hidden Patterns in Our Data 
topological data analysis
Categorical Data Lens to Separate 
Healthy from Disease States 
All Healthy 
All Healthy 
All Ileal Crohn’s 
Healthy, Ulcerative 
Colitis, and LS 
All Healthy
Group Comparisons using 
Ayasdi’s Statistical Tools
Ayasdi Enables Discovery of Differences Between 
Healthy and Disease States Using Microbiome Species 
• High in Healthy and LS 
• High in Healthy and 
Ulcerative Colitis 
• High in Both LS and 
Ileal Crohn’s Disease 
Healthy LS 
Ileal Crohn’s Ulcerative Colitis 
Using Multidimensional 
Scaling Lens with 
Correlation Metric
Moving from Ecological Taxonomy 
to Cellular Pathways 
Dataset from Larry Smarr Team 
With 60 Subjects (HE, CD, UC, LS) 
Each with 10,000 KEGGs - 
600,000 Cells 
Source: Pek Lum, Chief Data Scientist, Ayasdi
Next Step: Apply What We Have Learned 
to New Microbiome Datasets 
• Larry Smarr is a Member of the Pioneer 100 
• Our Team Now Has the Gut Microbiomes of the Pioneer 100 
• We Plan to Analyze Them for Differences Using Ayasdi Tools 
• Do Metagenomics on Those Who Are Outliers 
Will Grow to 1000, then 10,000 
http://isbmolecularme.com/tag/100-pioneers/
Thanks to Our Great Team! 
UCSD Metagenomics Team 
Weizhong Li 
Sitao Wu 
Calit2@UCSD 
Future Patient Team 
Jerry Sheehan 
Tom DeFanti 
Kevin Patrick 
Jurgen Schulze 
Andrew Prudhomme 
Philip Weber 
Fred Raab 
Joe Keefe 
Ernesto Ramirez 
Ayasdi 
Devi 
Sanjnan 
Pek 
JCVI Team 
Karen Nelson 
Shibu Yooseph 
Manolito Torralba 
SDSC Team 
Michael Norman 
Mahidhar Tatineni 
Robert Sinkovits 
UCSD Health Sciences Team 
William J. Sandborn 
Elisabeth Evans 
John Chang 
Brigid Boland 
David Brenner

Mapping the Human Gut Microbiome in Health and Disease Using Sequencing, Supercomputing, and Data Analysis

  • 1.
    “Mapping the HumanGut Microbiome in Health and Disease Using Sequencing, Supercomputing, and Data Analysis” Invited Talk Delivered by Mehrdad Yazdani, Calit2 Ayasdi Sponsored Lunch & Learn American Society of Human Genetics (ASHG) San Diego Convention Center October 19, 2014 Dr. Larry Smarr Director, California Institute for Telecommunications and Information Technology Harry E. Gruber Professor, Dept. of Computer Science and Engineering Jacobs School of Engineering, UCSD http://lsmarr.calit2.net 1
  • 2.
    Inclusion of theMicrobiome Will Radically Change Medicine and Wellness Your Body Has 10 Times As Many Microbe Cells As Human Cells 99% of Your DNA Genes Are in Microbe Cells Not Human Cells Challenge: Map Out Microbial Ecology and Function
  • 3.
    A Year ofSequencing a Healthy Gut Microbiome Daily - Remarkable Stability with Abrupt Changes Days Genome Biology (2014) David, et al.
  • 4.
    To Map Outthe Dynamics of Autoimmune Microbiome Ecology Couples Next Generation Genome Sequencers to Big Data Supercomputers • Metagenomic Sequencing – JCVI Produced ~150 Billion DNA Bases From Seven of LS Stool Samples Over 1.5 Years – We Downloaded ~3 Trillion DNA Bases From NIH Human Microbiome Program Data Base – 255 Healthy People, 21 with IBD • Supercomputing (Weizhong Li, JCVI/HLI/UCSD): – ~180,000 Core-Hours SDSC’s Gordon – ~35,000 Core-Hours Dell HPC Cloud • Produced Relative Abundance of ~10,000 Bacteria, Archaea, Viruses in ~300 People – ~3Million Filled Spreadsheet Cells Illumina HiSeq 2000 at JCVI SDSC Gordon Data Supercomputer
  • 5.
    We Found MajorState Shifts in Microbial Ecology Phyla Between Healthy and Two Forms of IBD Most Common Microbial Phyla Average HE Average Ulcerative Colitis Average LS Average Crohn’s Disease Collapse of Bacteroidetes Explosion of Actinobacteria Explosion of Proteobacteria Hybrid of UC and CD High Level of Archaea
  • 6.
    Using Ayasdi toDiscover Hidden Patterns in Our Data topological data analysis
  • 7.
    Categorical Data Lensto Separate Healthy from Disease States All Healthy All Healthy All Ileal Crohn’s Healthy, Ulcerative Colitis, and LS All Healthy
  • 8.
    Group Comparisons using Ayasdi’s Statistical Tools
  • 9.
    Ayasdi Enables Discoveryof Differences Between Healthy and Disease States Using Microbiome Species • High in Healthy and LS • High in Healthy and Ulcerative Colitis • High in Both LS and Ileal Crohn’s Disease Healthy LS Ileal Crohn’s Ulcerative Colitis Using Multidimensional Scaling Lens with Correlation Metric
  • 10.
    Moving from EcologicalTaxonomy to Cellular Pathways Dataset from Larry Smarr Team With 60 Subjects (HE, CD, UC, LS) Each with 10,000 KEGGs - 600,000 Cells Source: Pek Lum, Chief Data Scientist, Ayasdi
  • 11.
    Next Step: ApplyWhat We Have Learned to New Microbiome Datasets • Larry Smarr is a Member of the Pioneer 100 • Our Team Now Has the Gut Microbiomes of the Pioneer 100 • We Plan to Analyze Them for Differences Using Ayasdi Tools • Do Metagenomics on Those Who Are Outliers Will Grow to 1000, then 10,000 http://isbmolecularme.com/tag/100-pioneers/
  • 12.
    Thanks to OurGreat Team! UCSD Metagenomics Team Weizhong Li Sitao Wu Calit2@UCSD Future Patient Team Jerry Sheehan Tom DeFanti Kevin Patrick Jurgen Schulze Andrew Prudhomme Philip Weber Fred Raab Joe Keefe Ernesto Ramirez Ayasdi Devi Sanjnan Pek JCVI Team Karen Nelson Shibu Yooseph Manolito Torralba SDSC Team Michael Norman Mahidhar Tatineni Robert Sinkovits UCSD Health Sciences Team William J. Sandborn Elisabeth Evans John Chang Brigid Boland David Brenner