Download to read offline

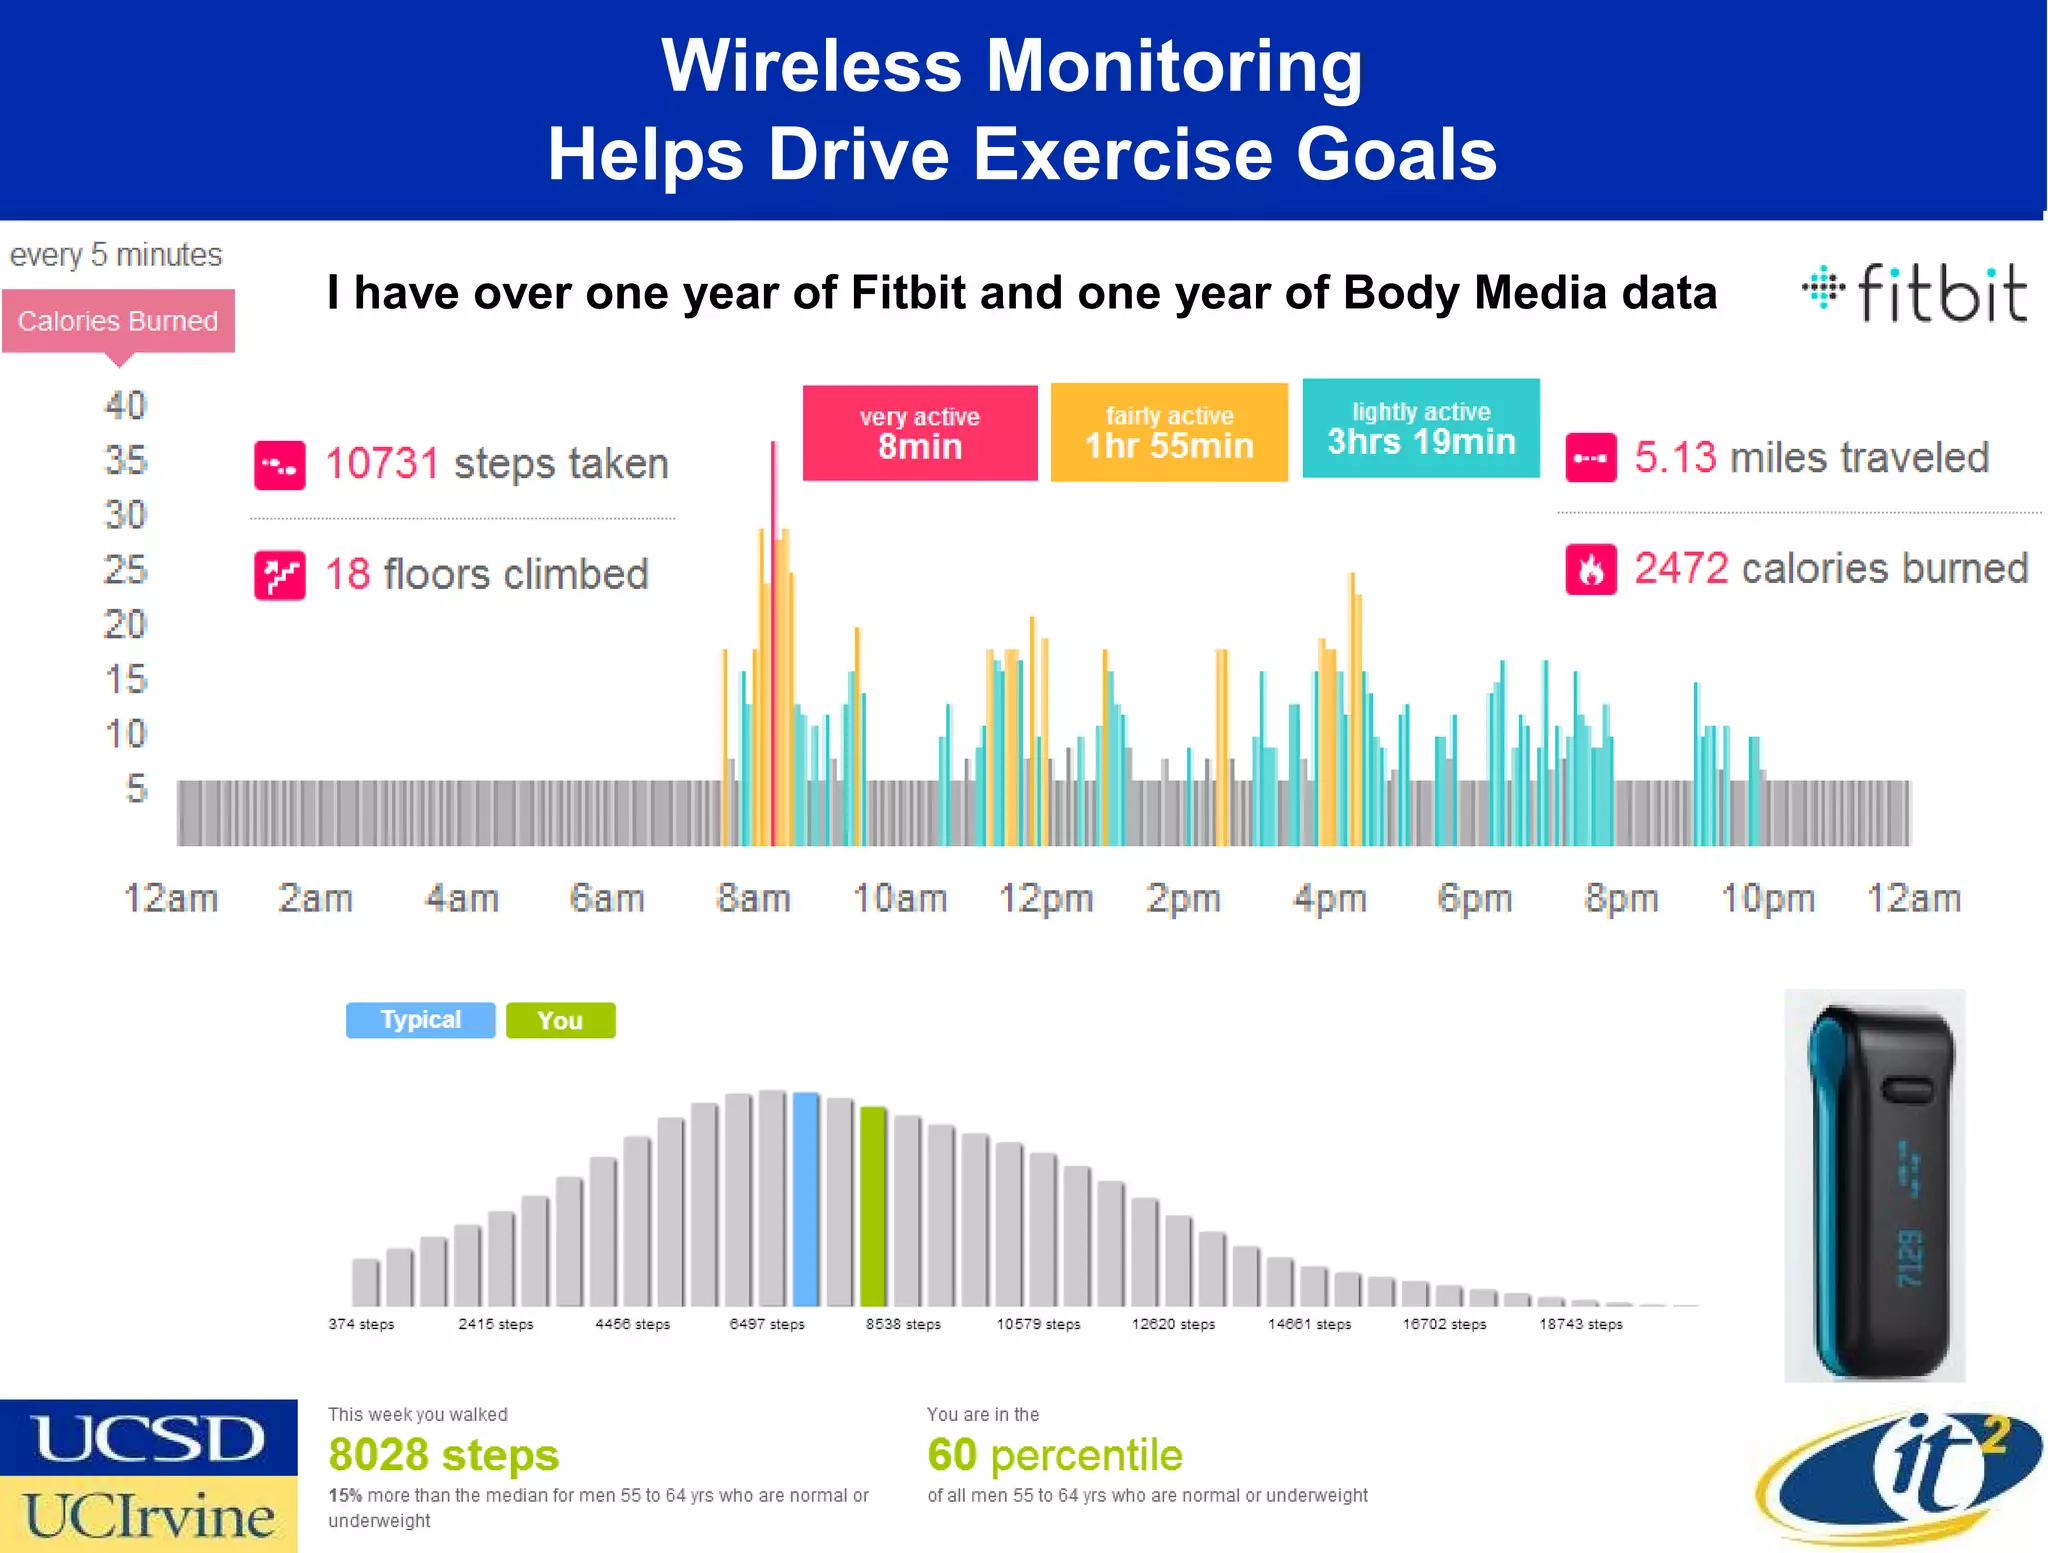
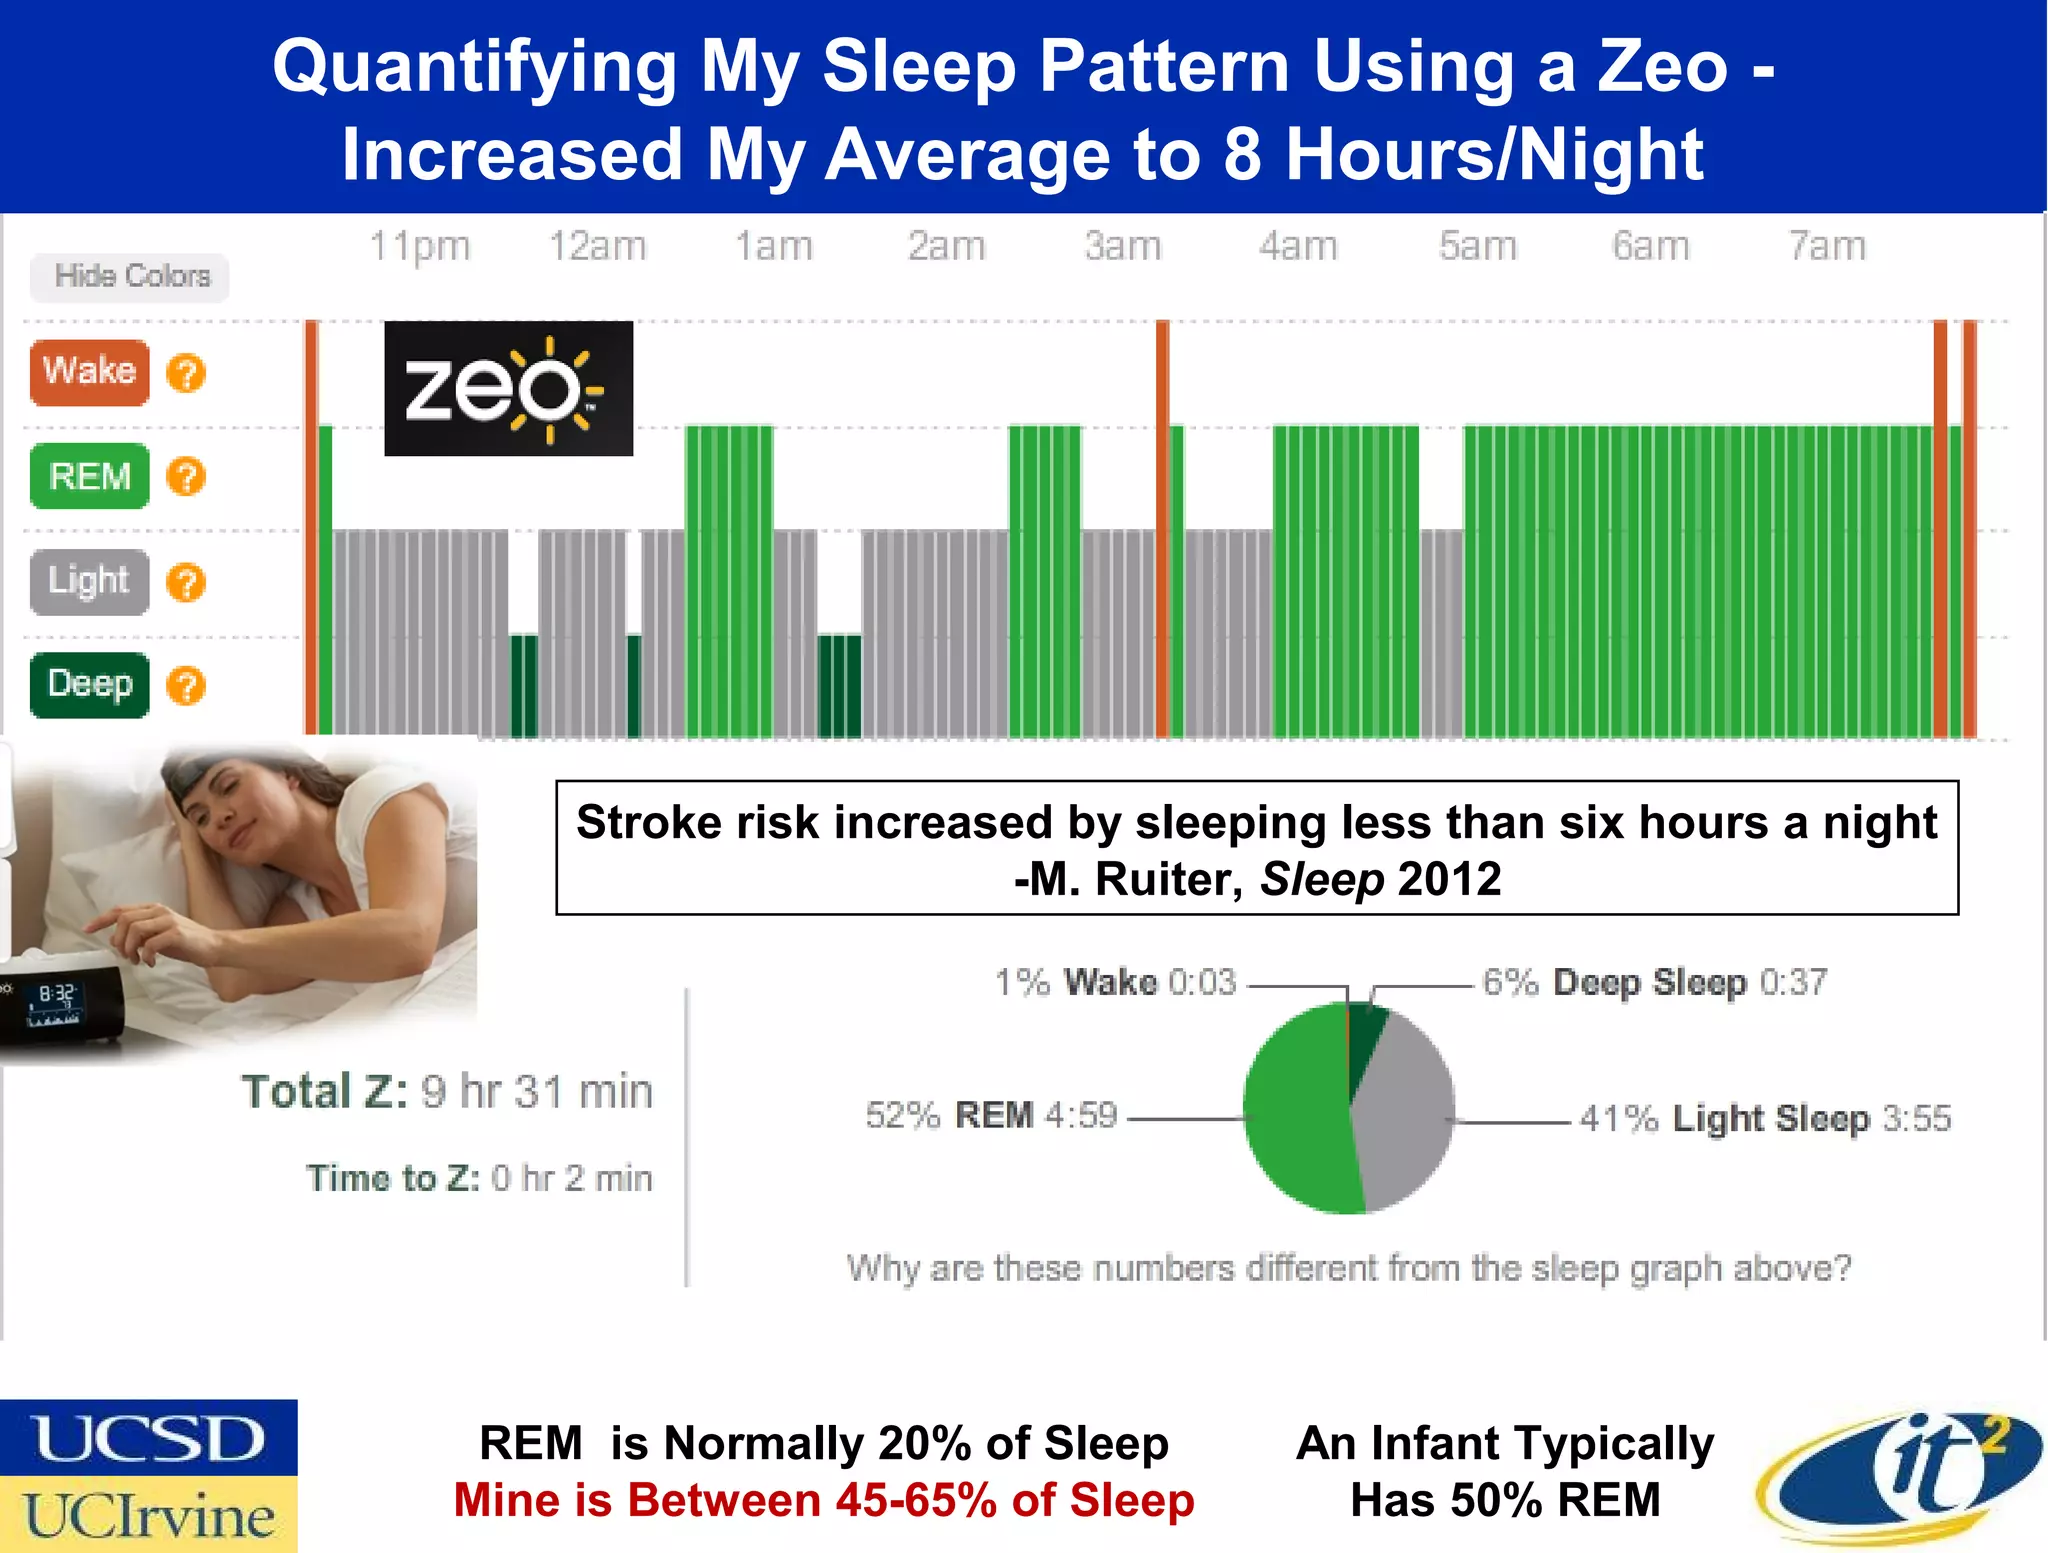
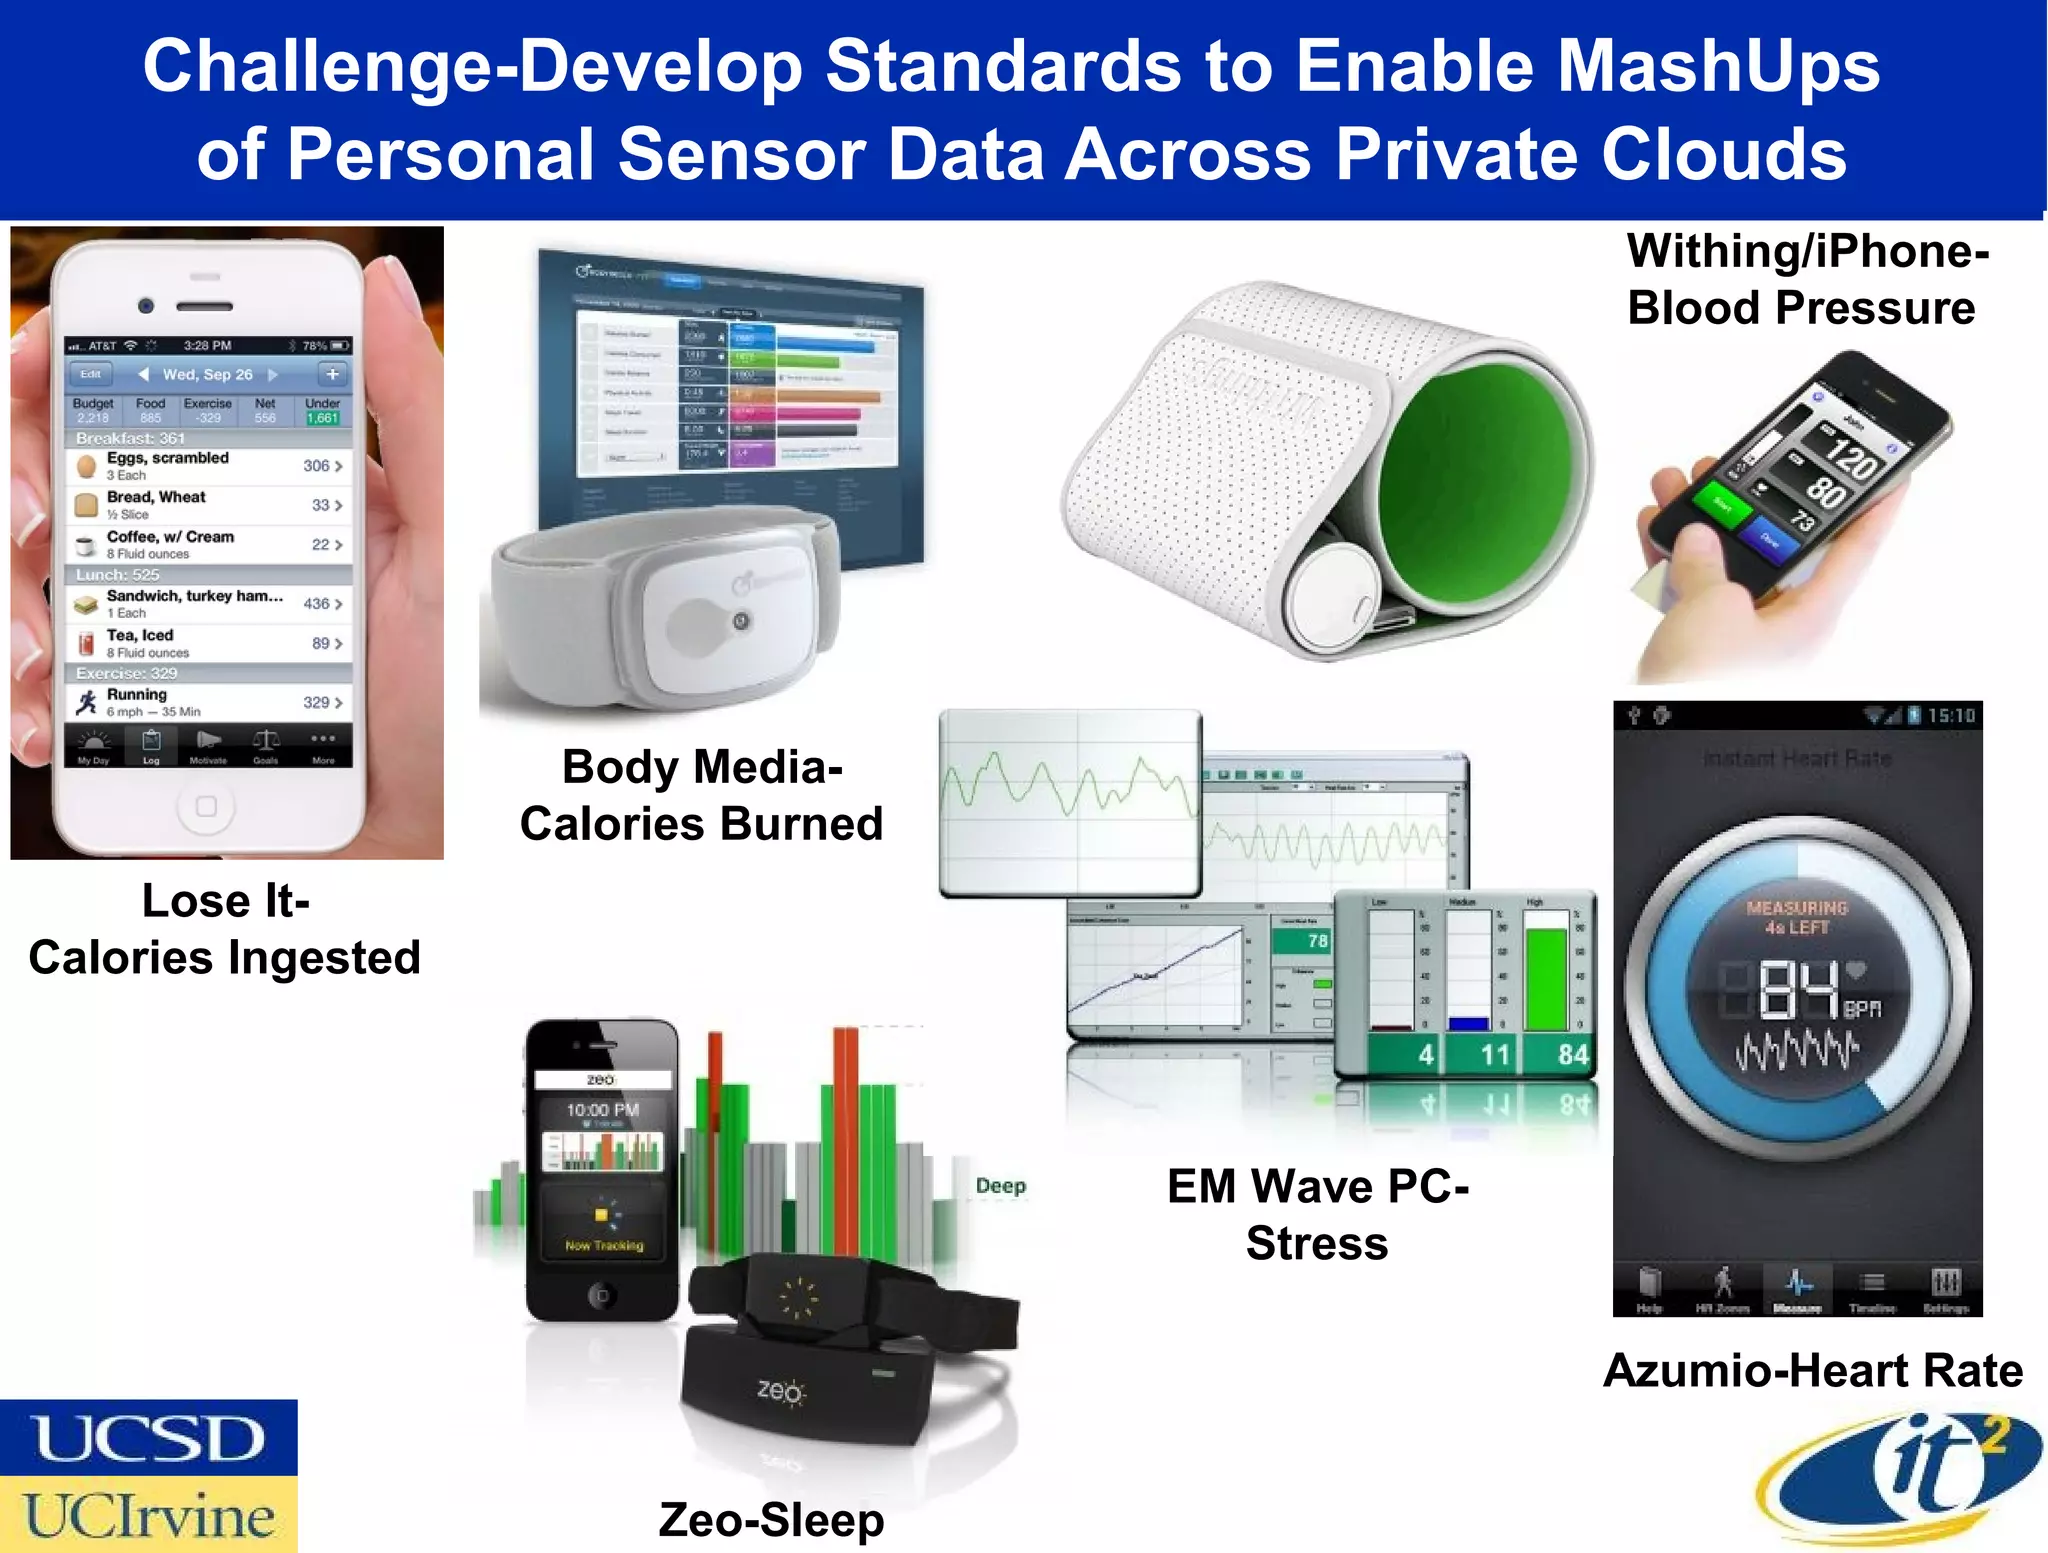
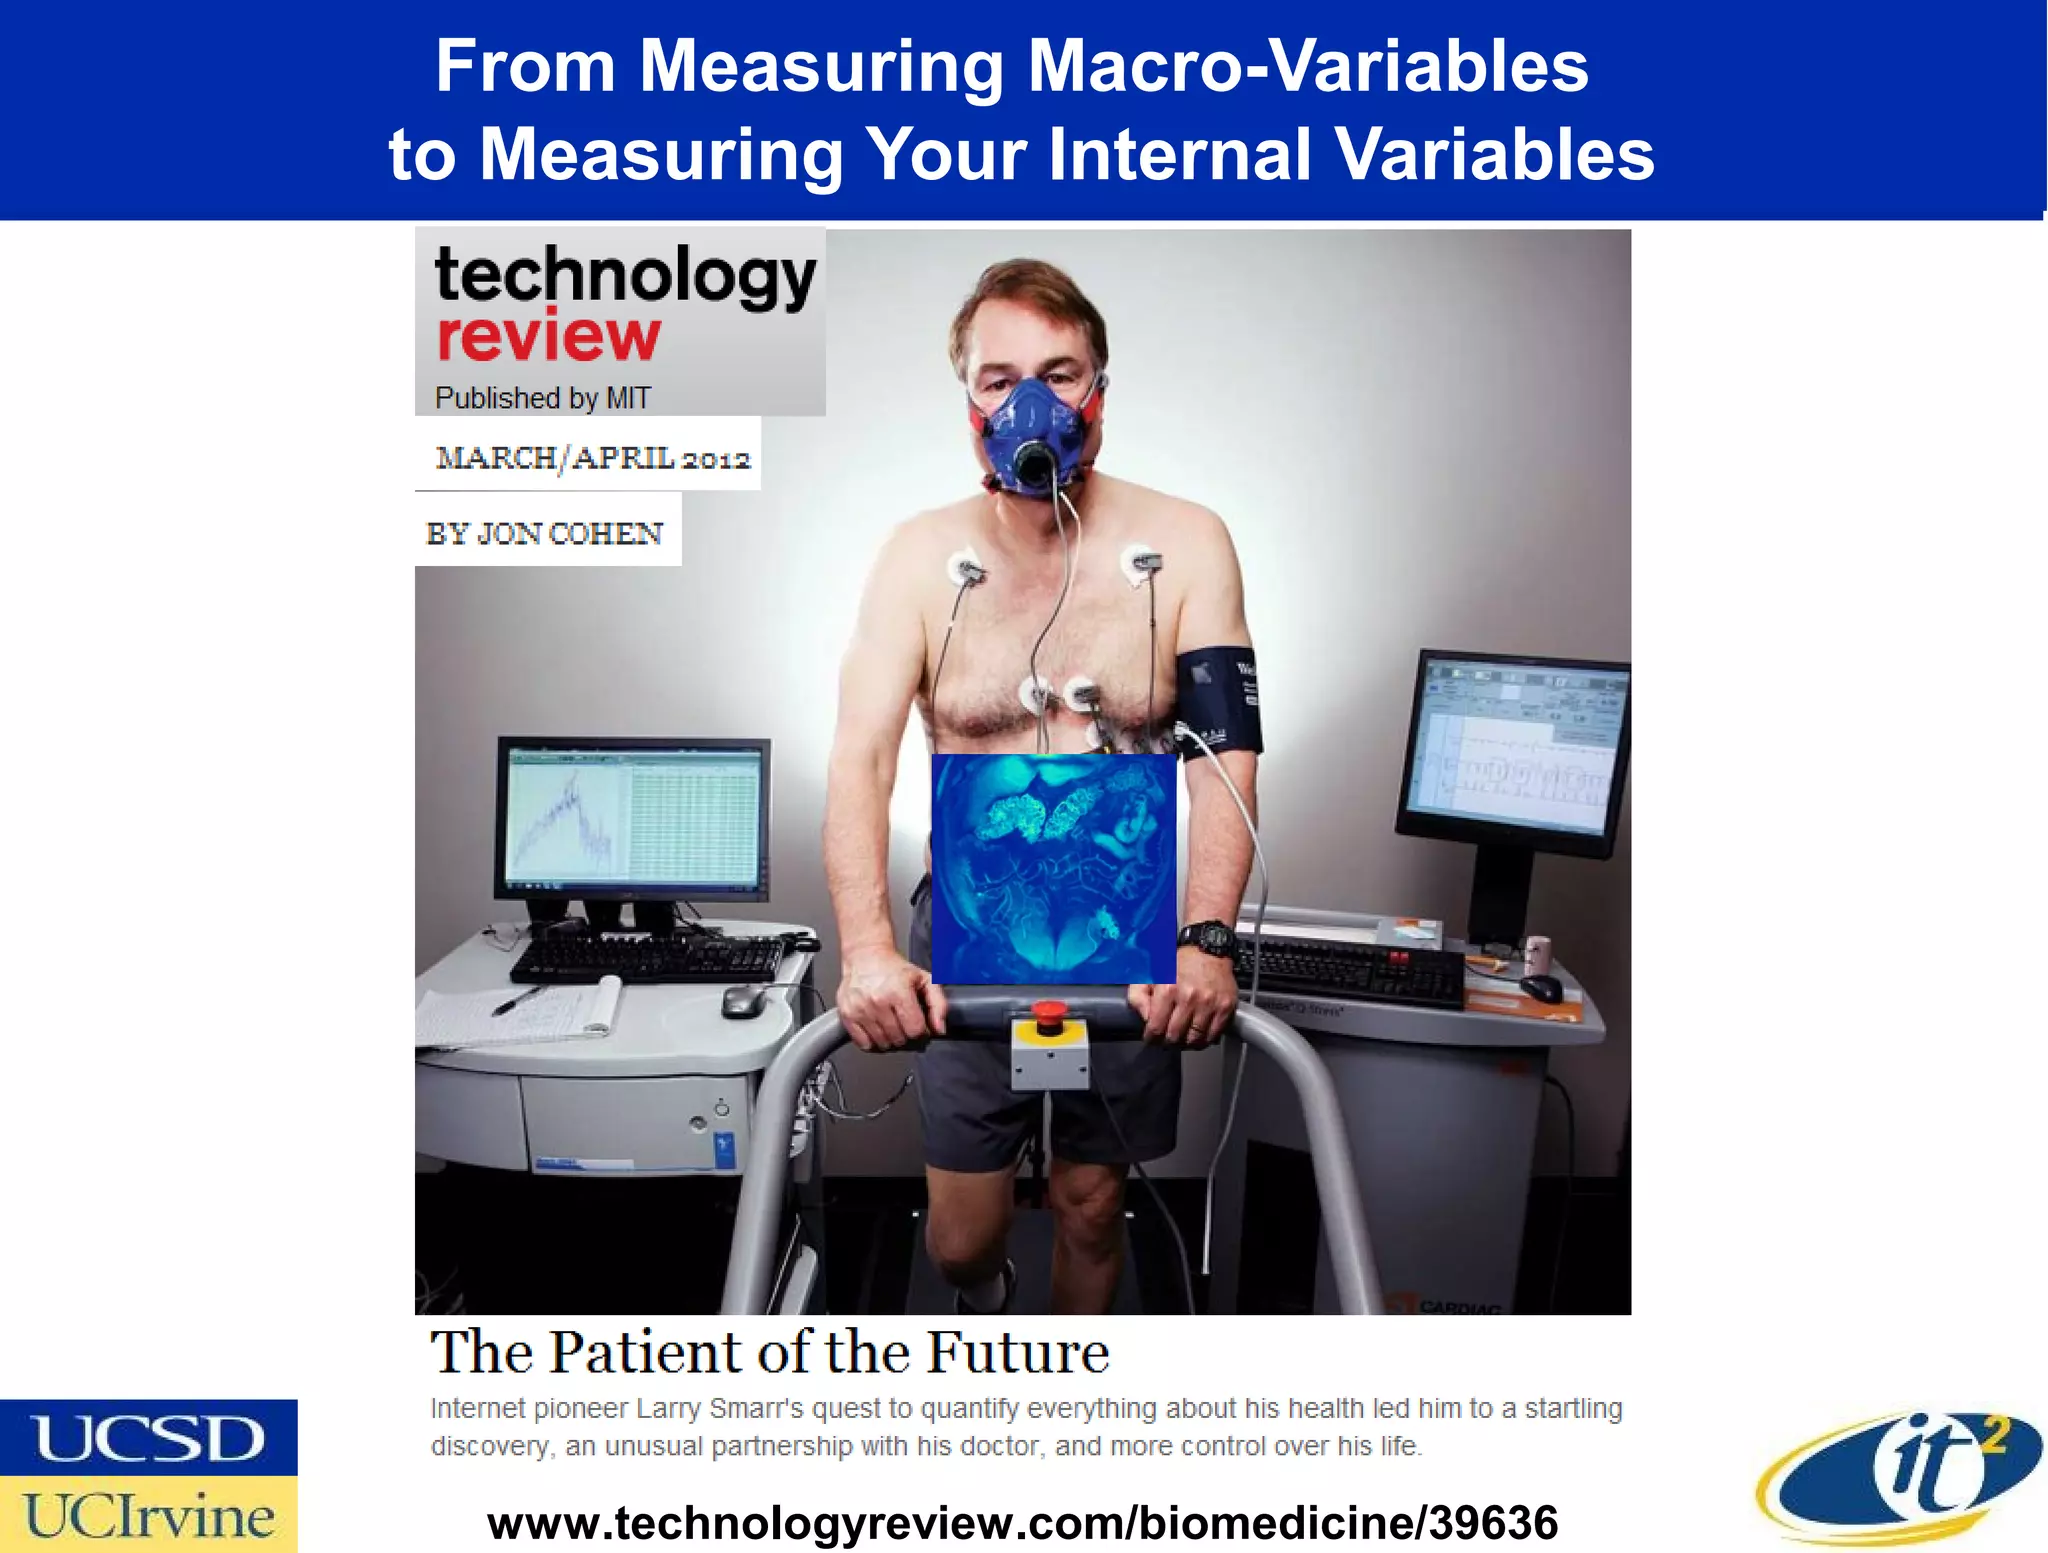
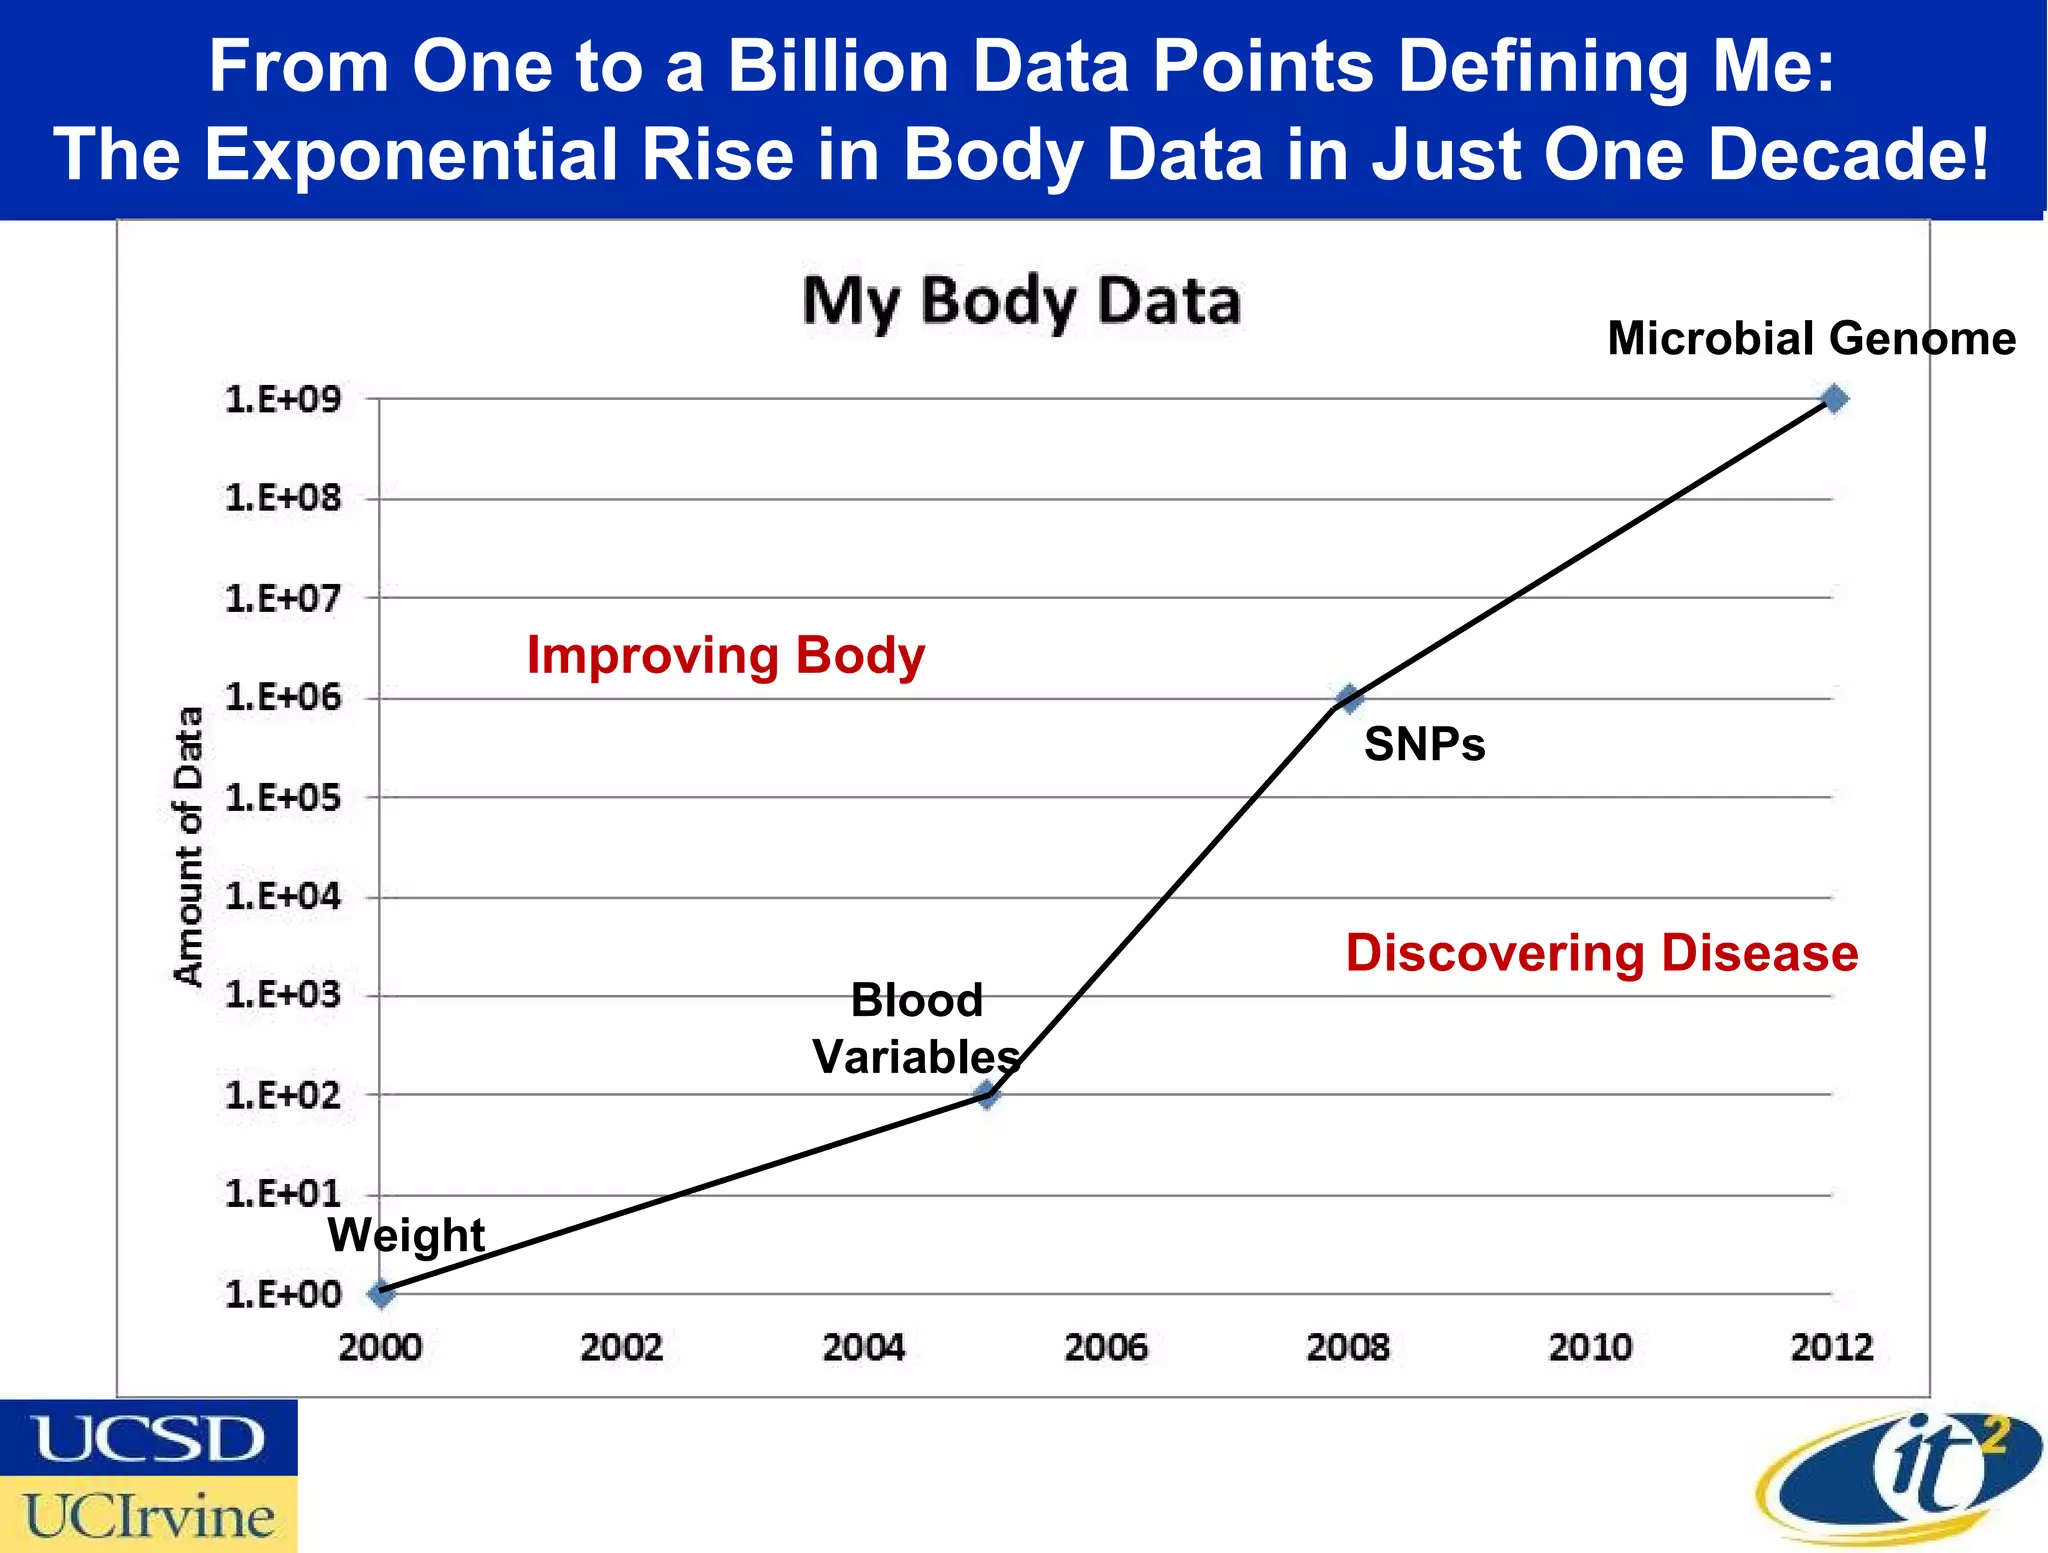
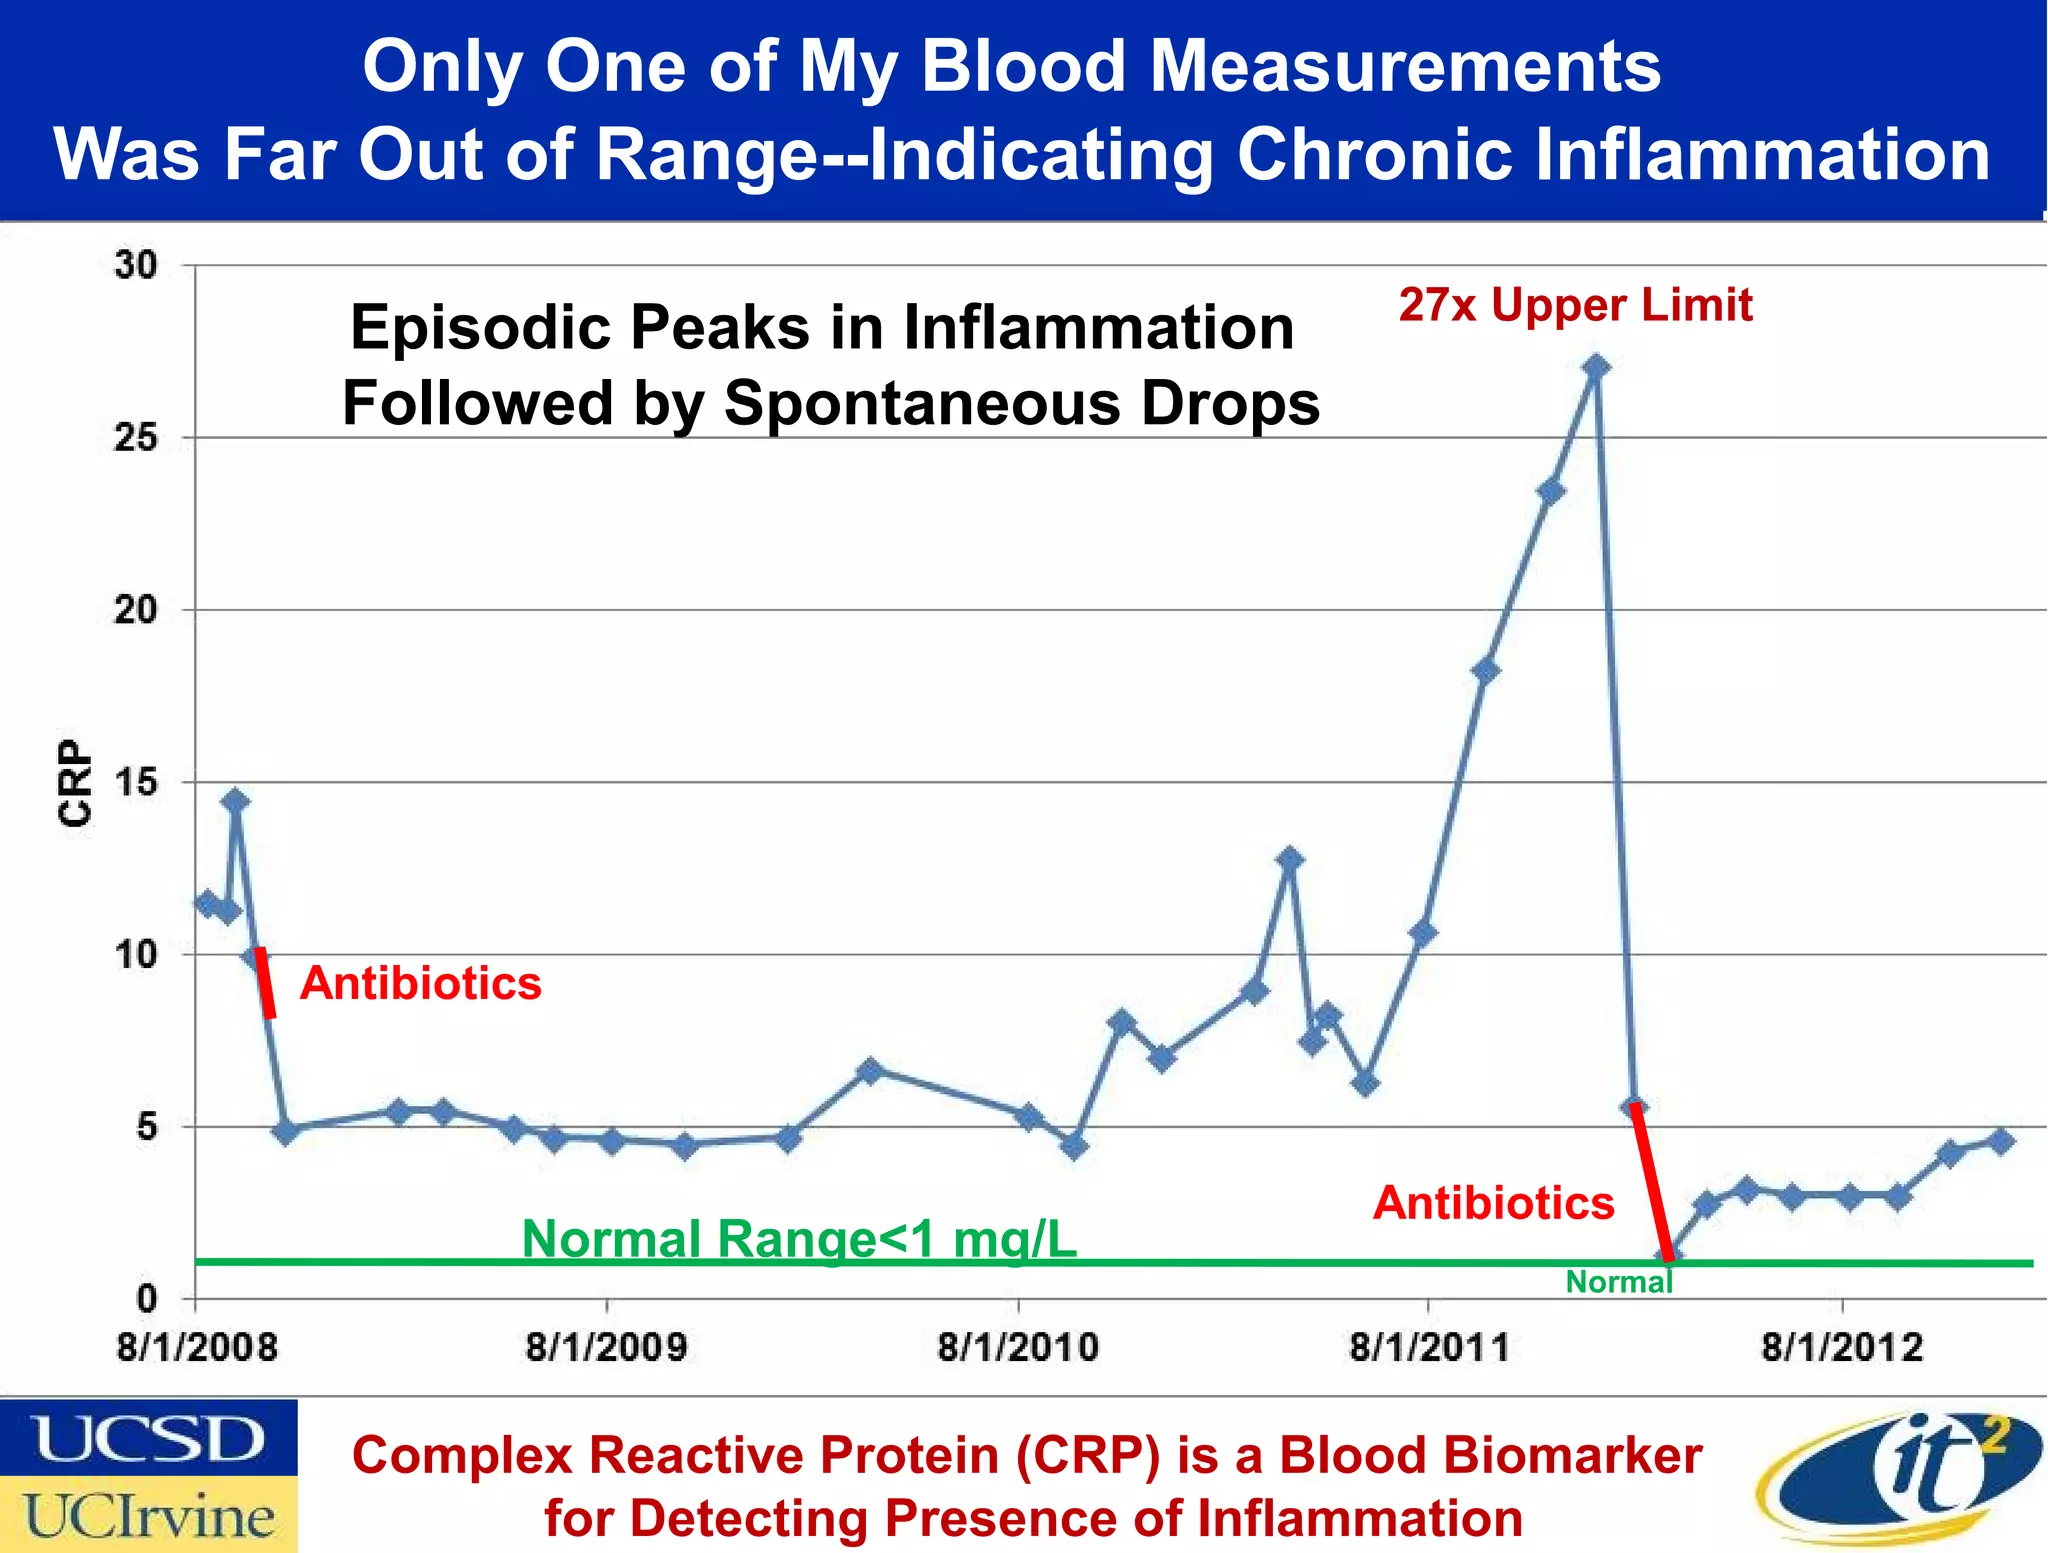


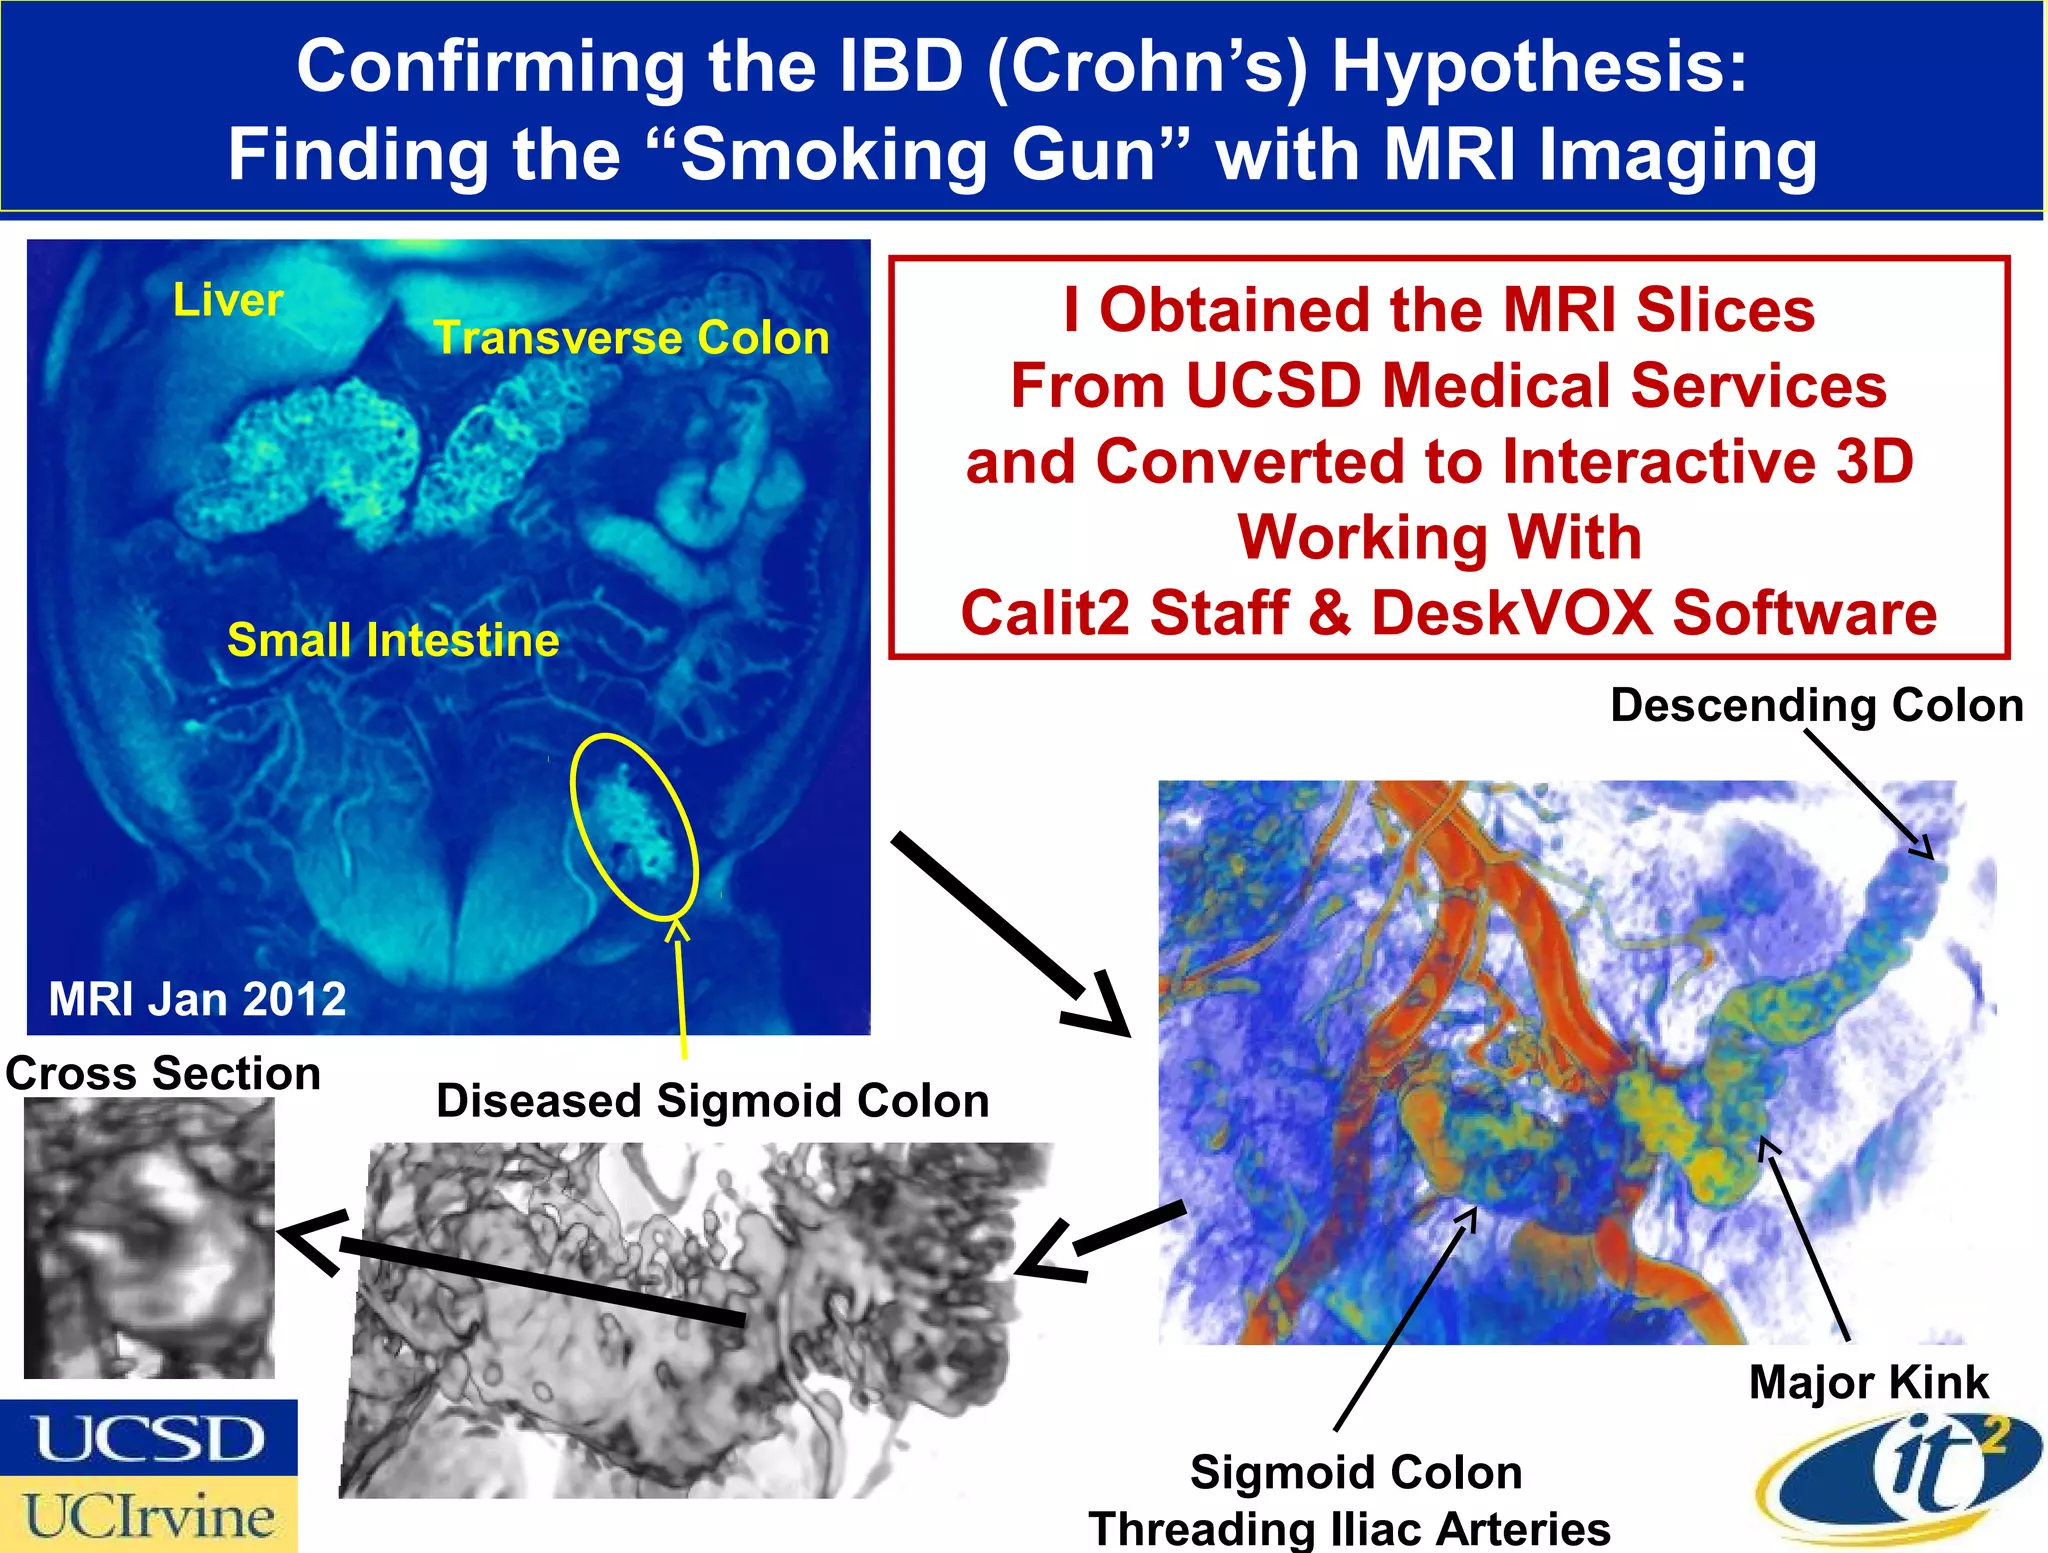
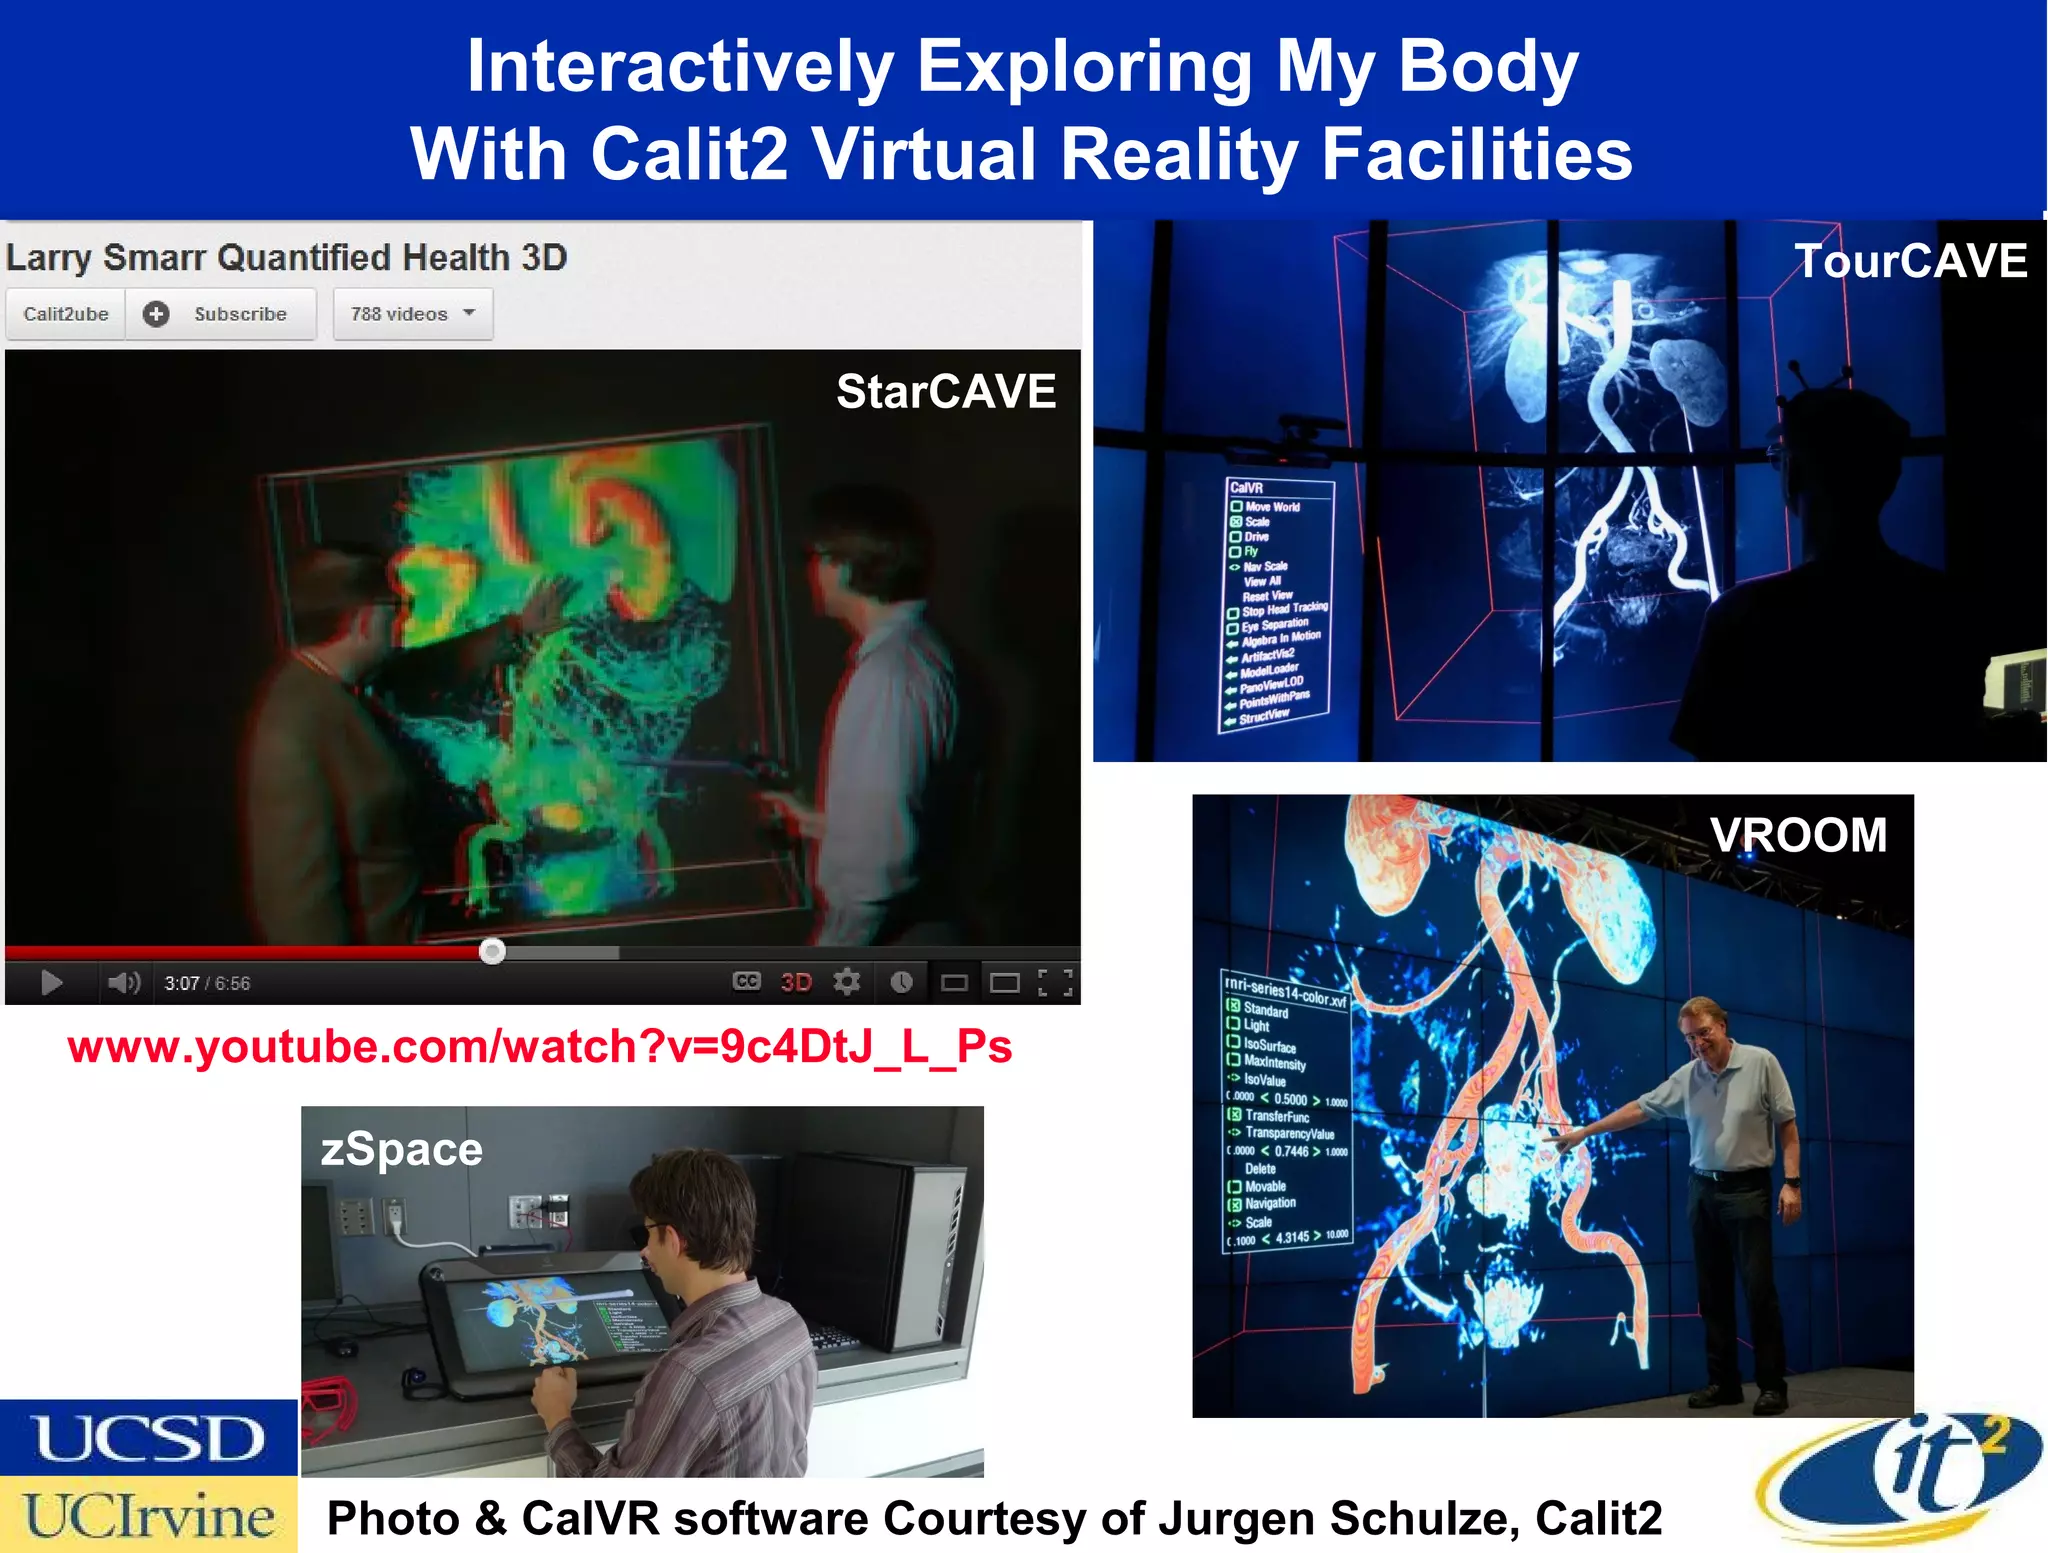
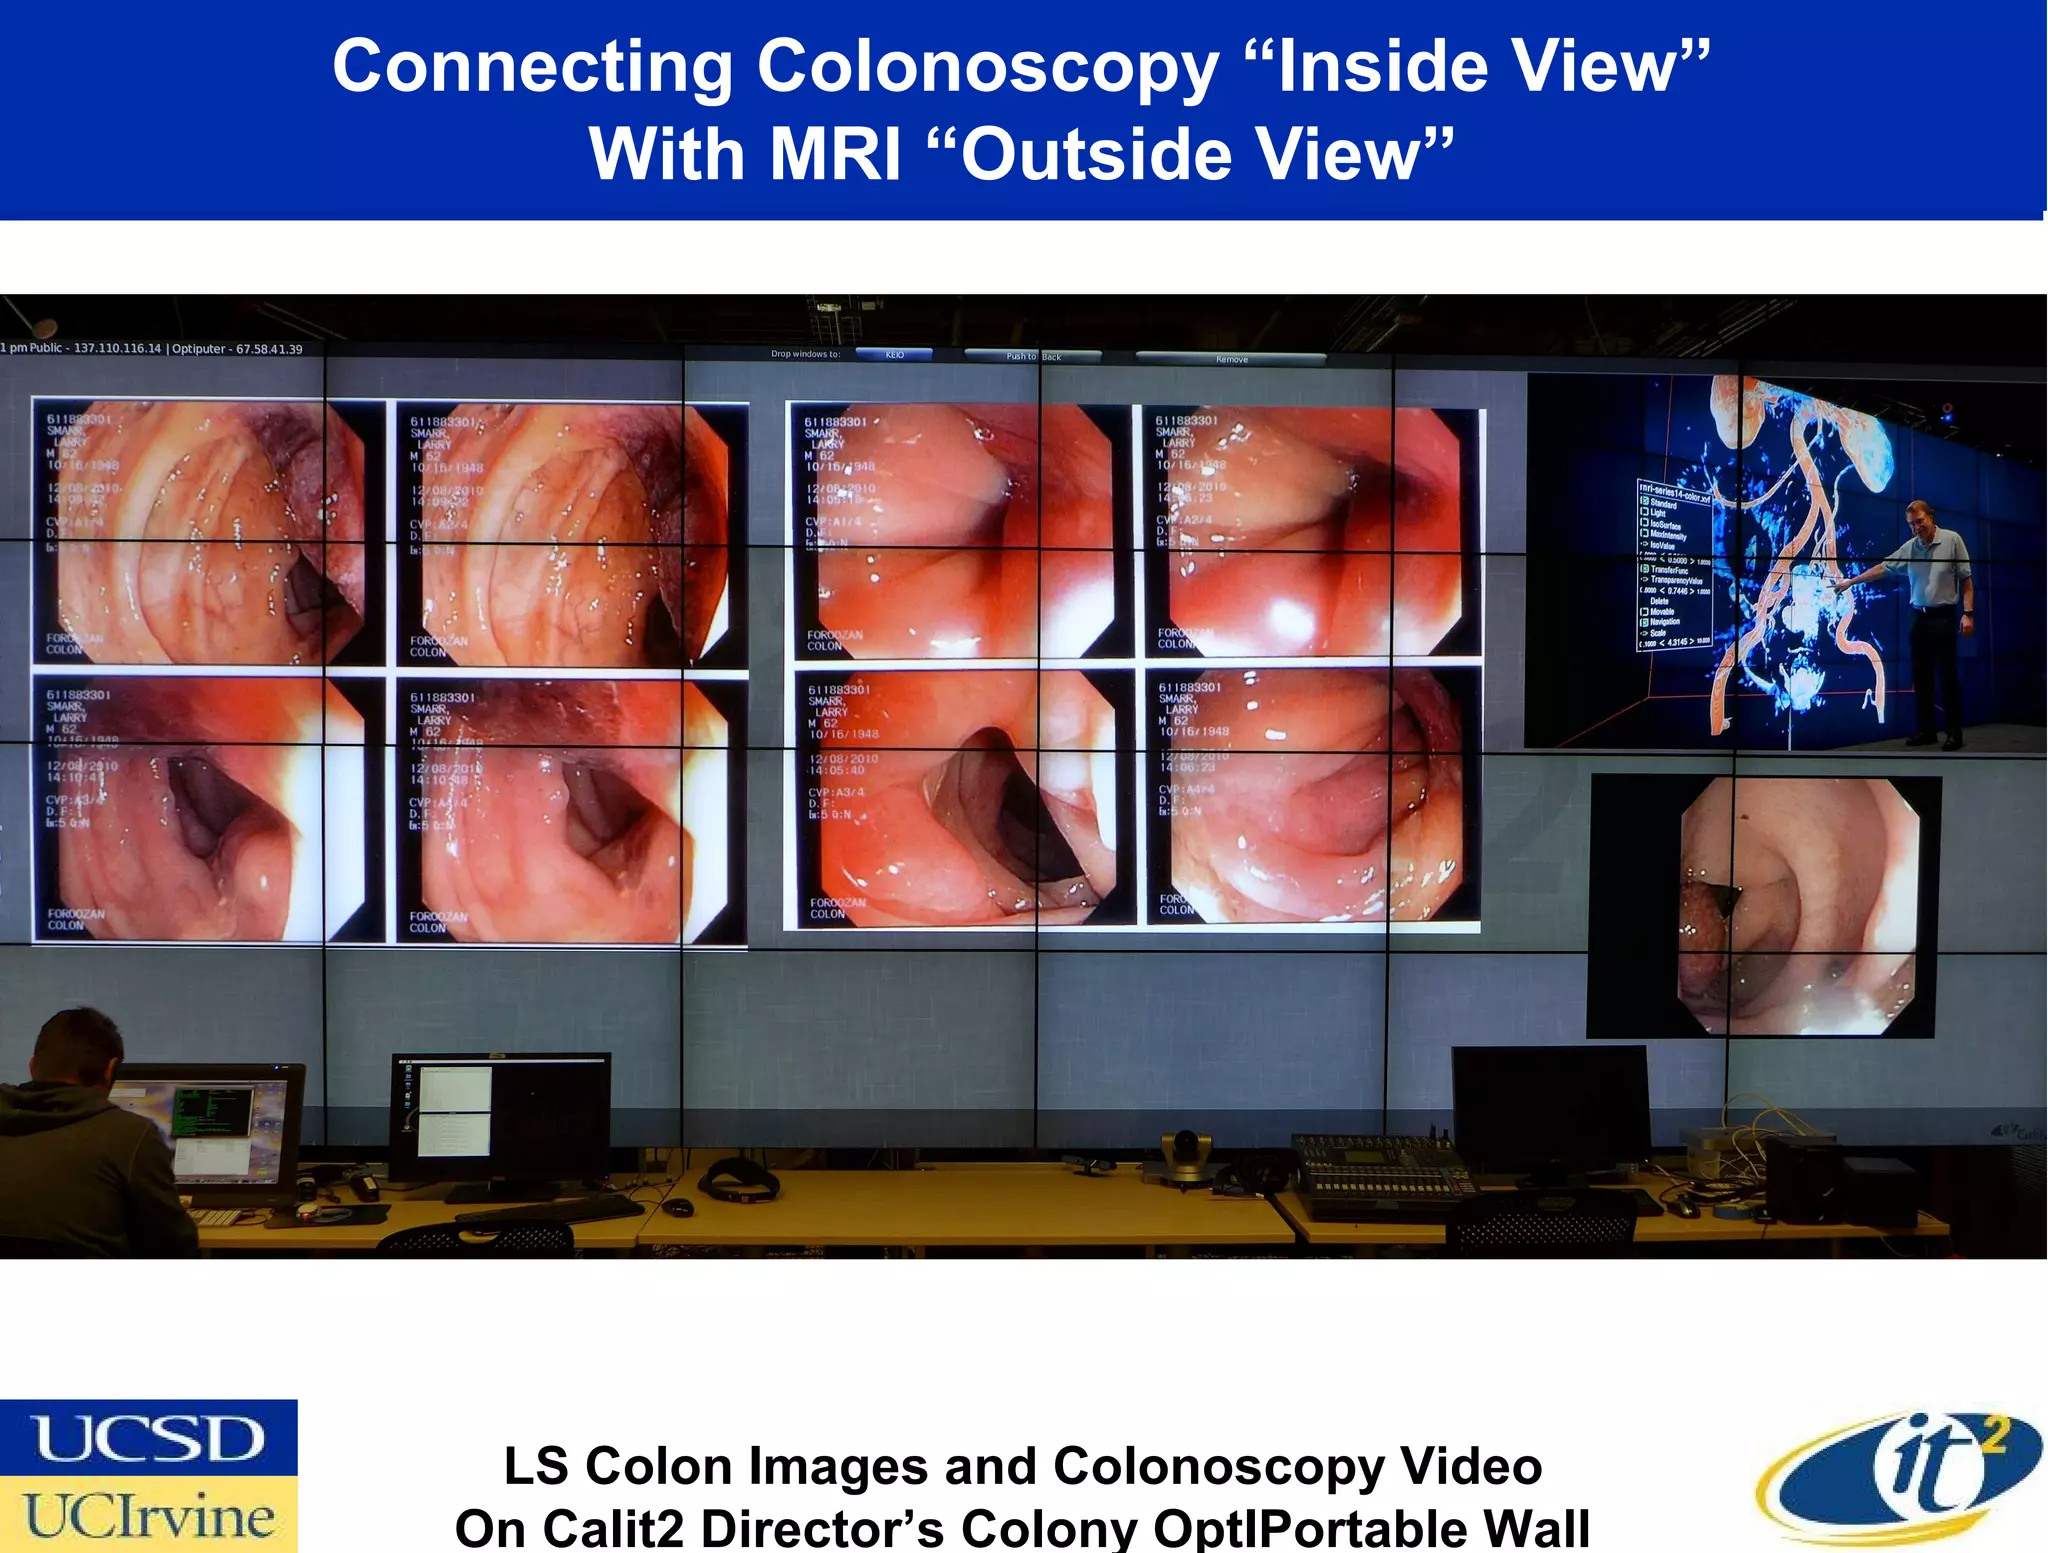

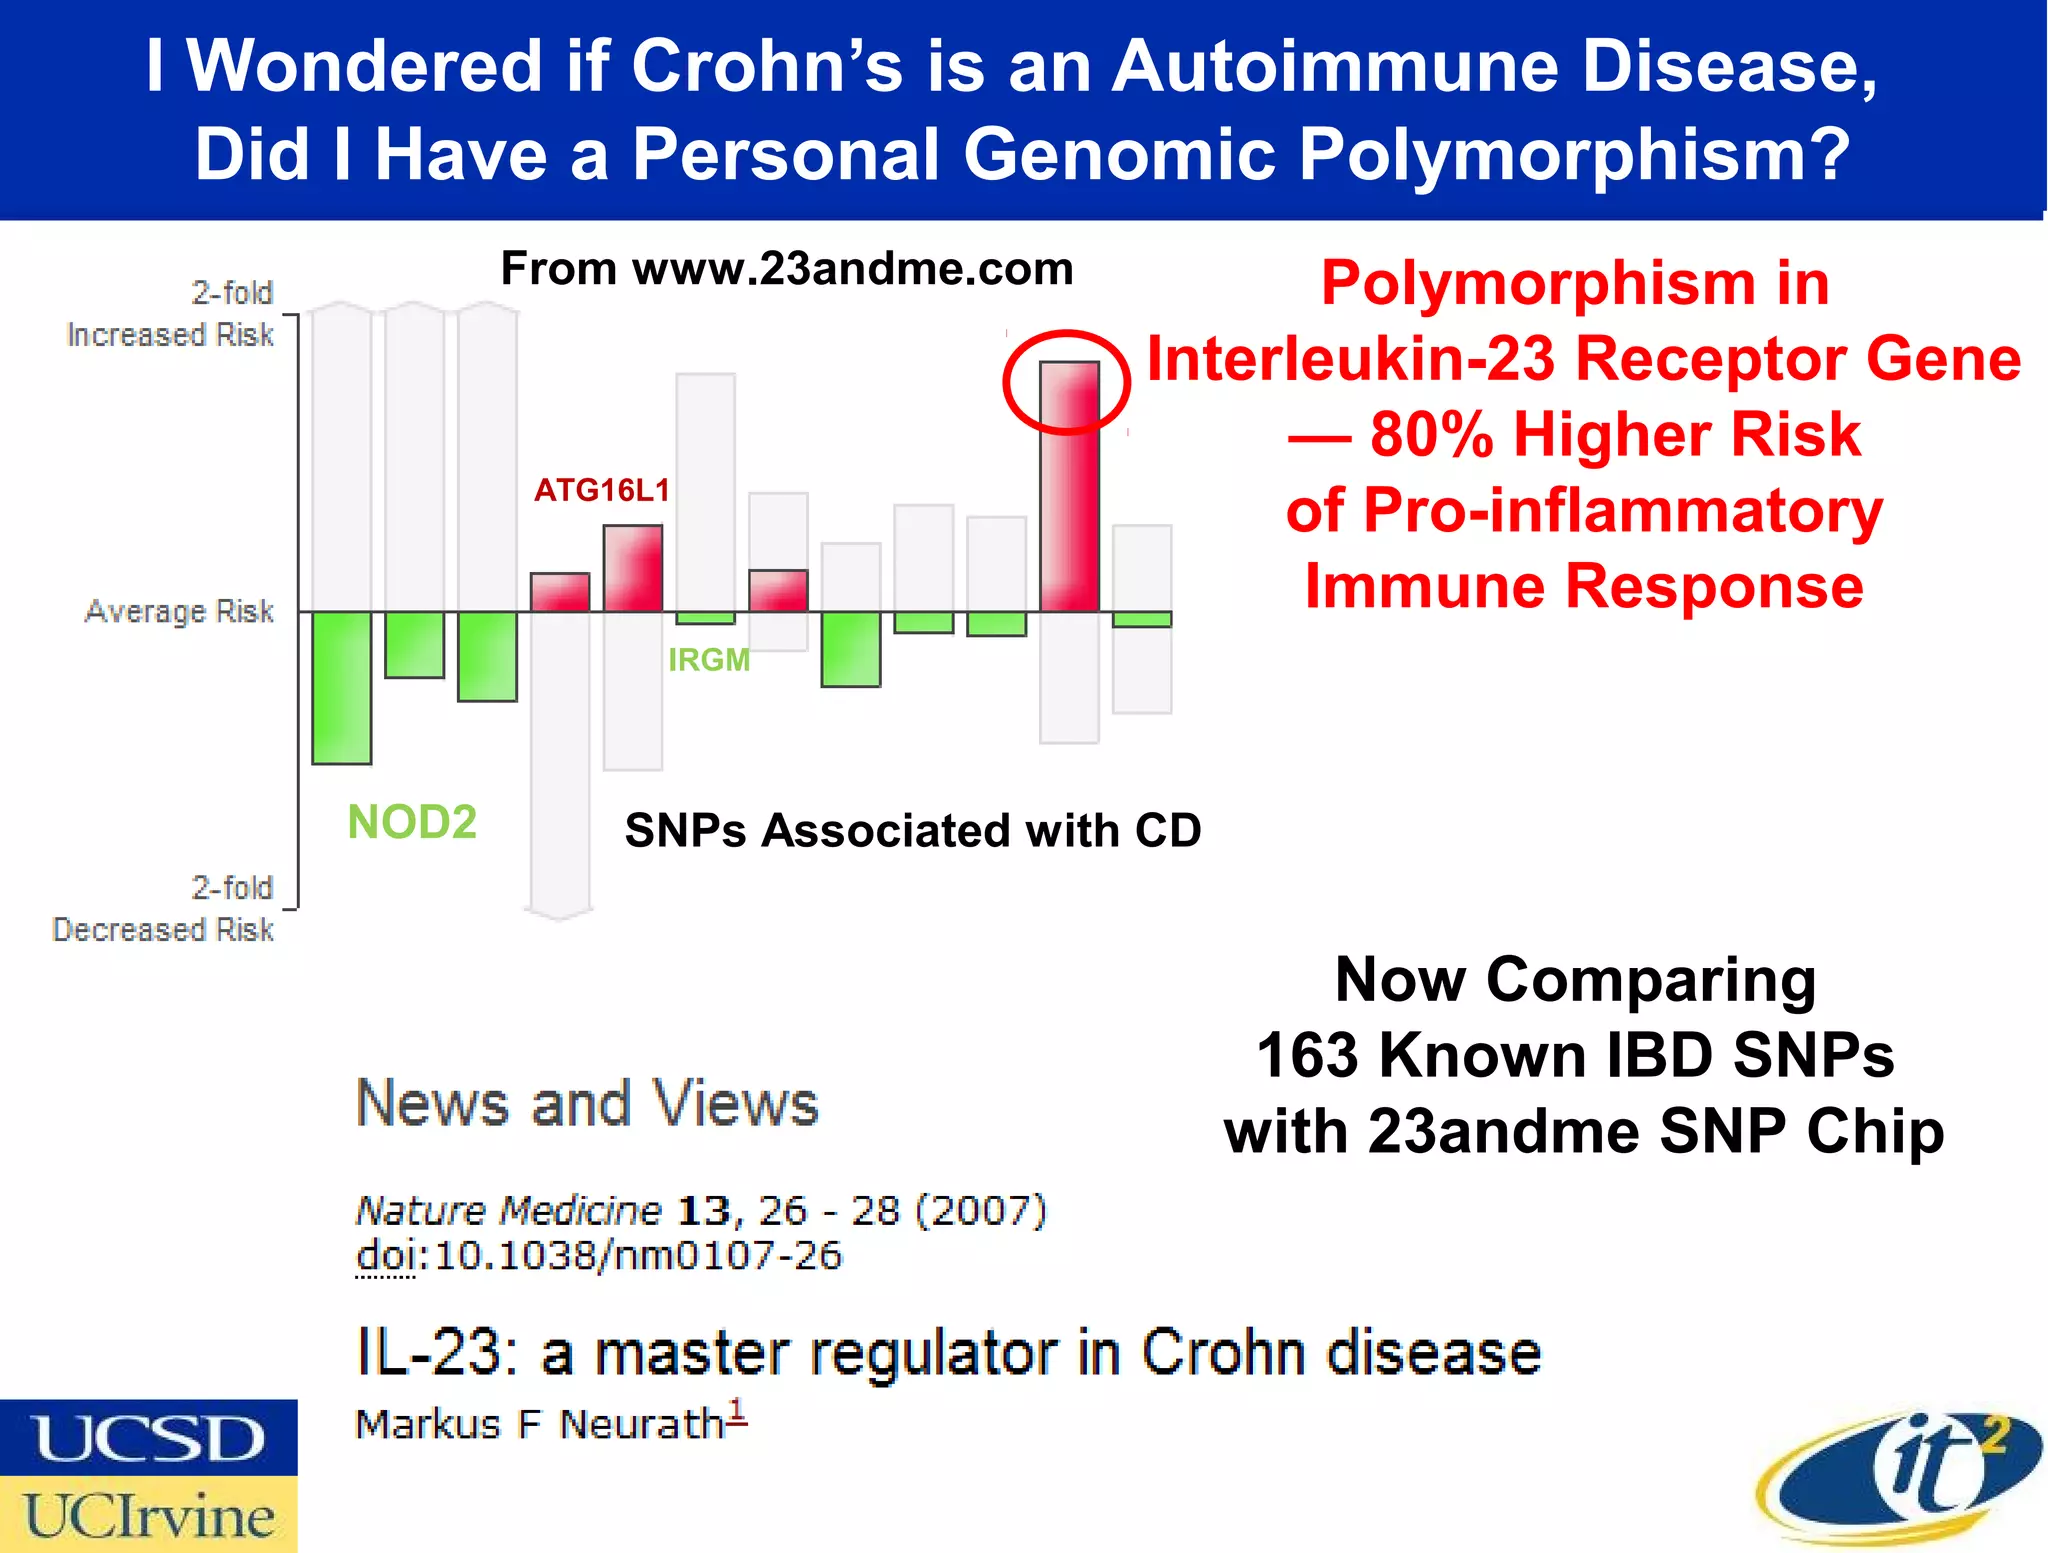


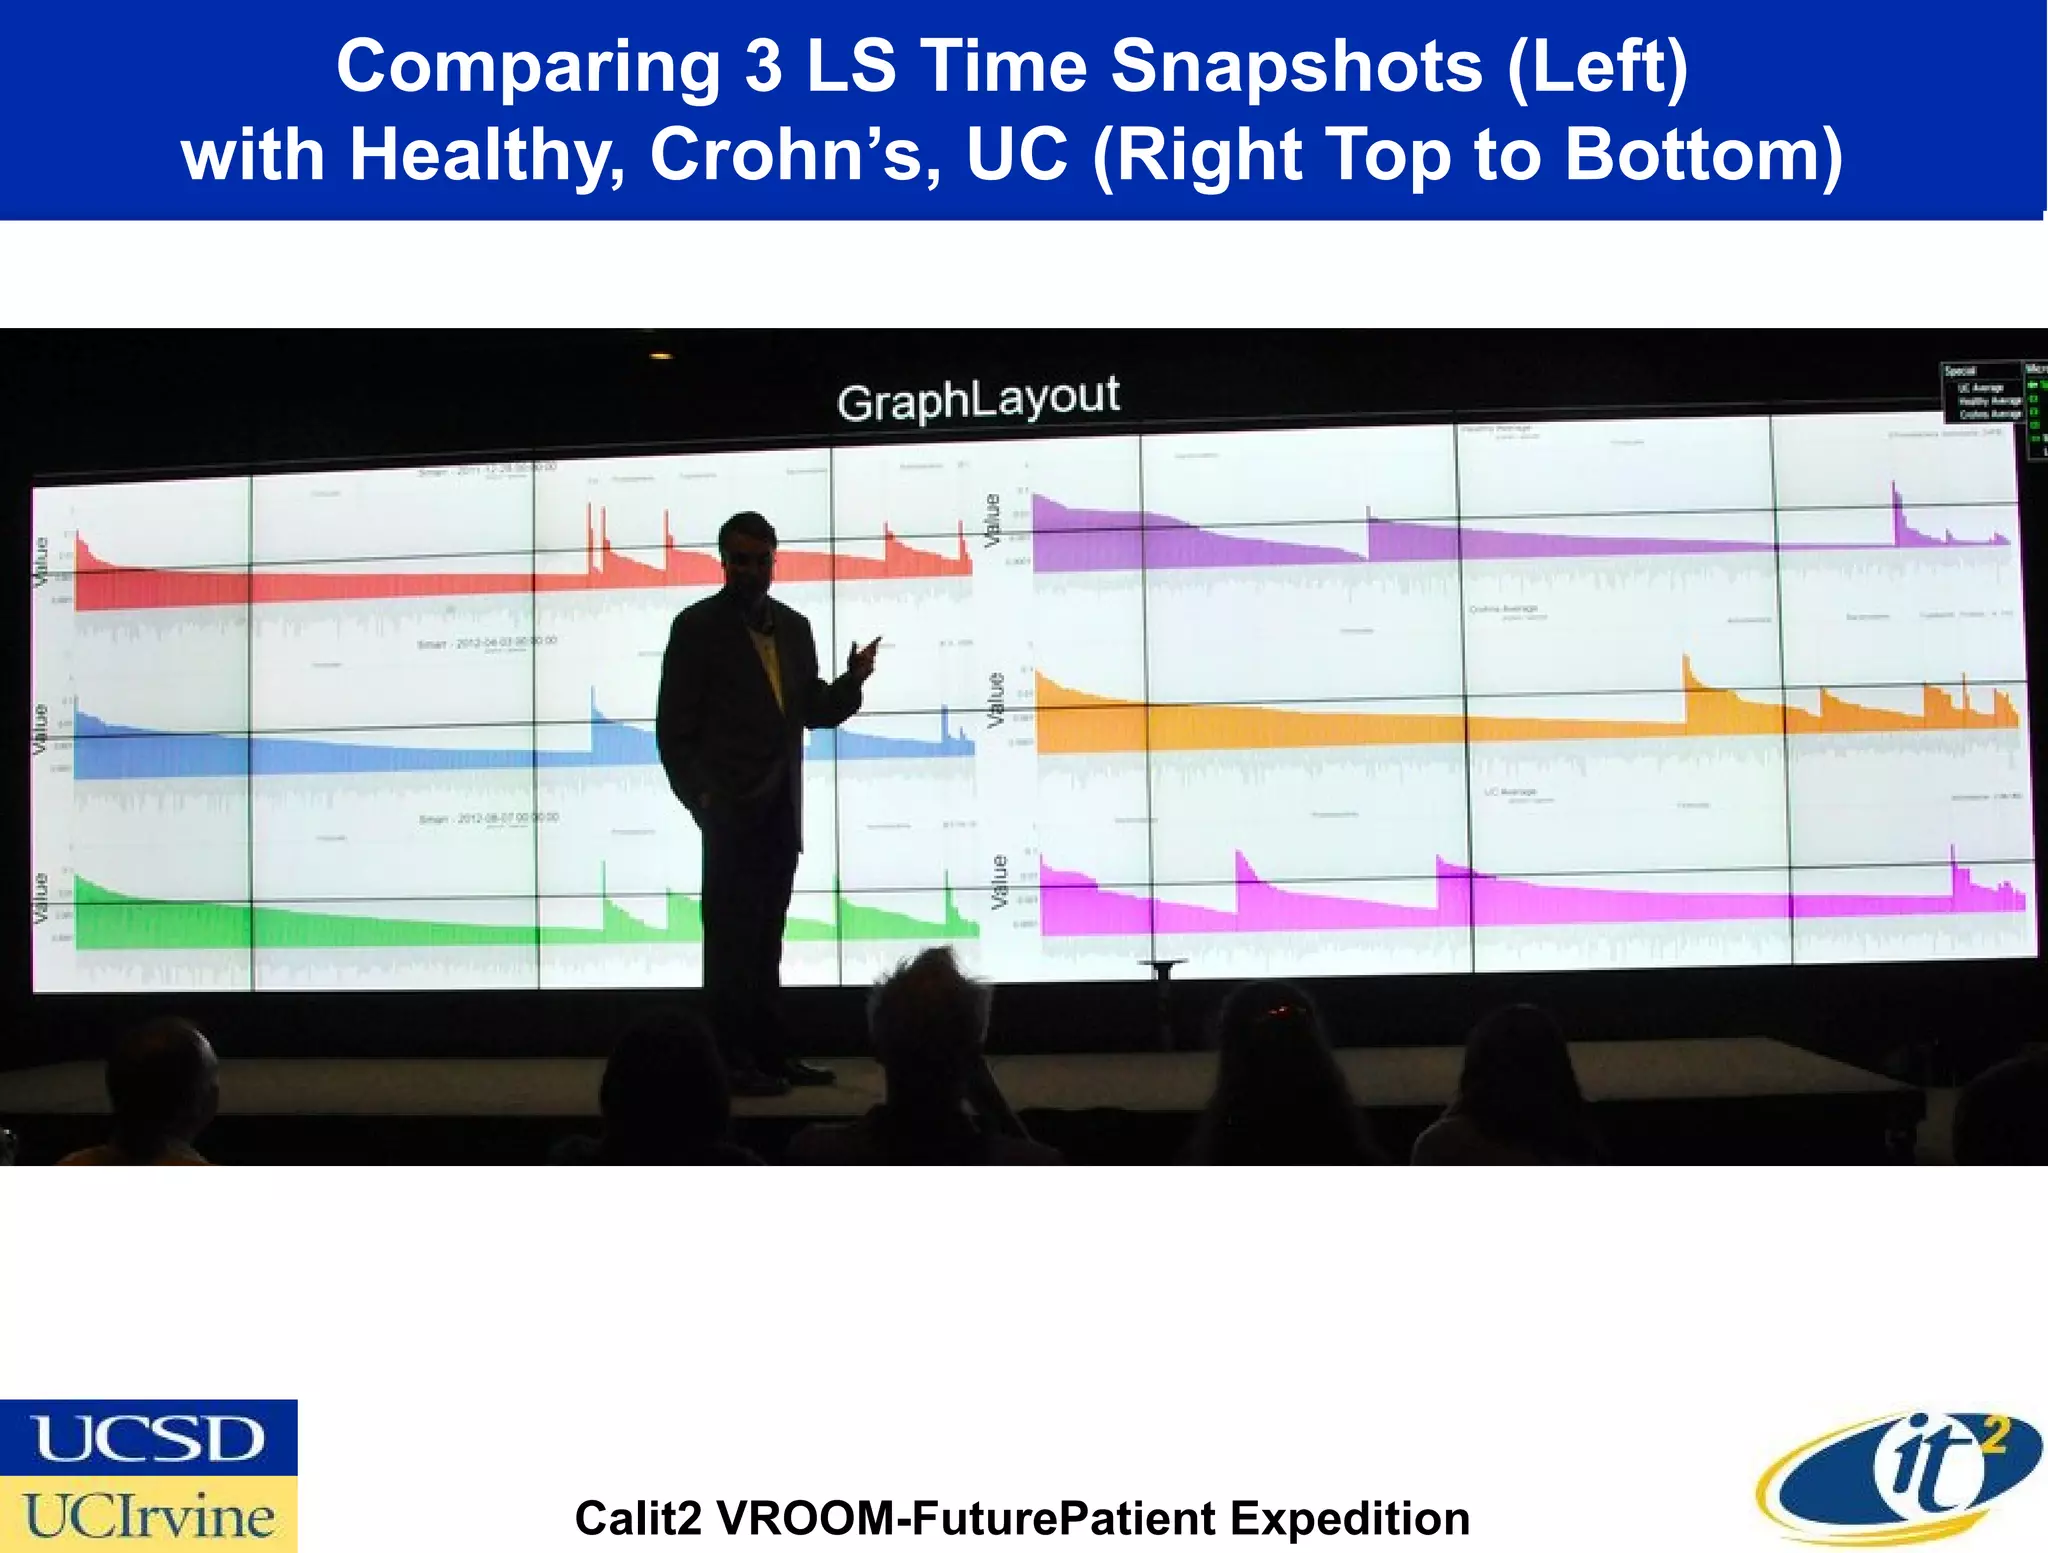


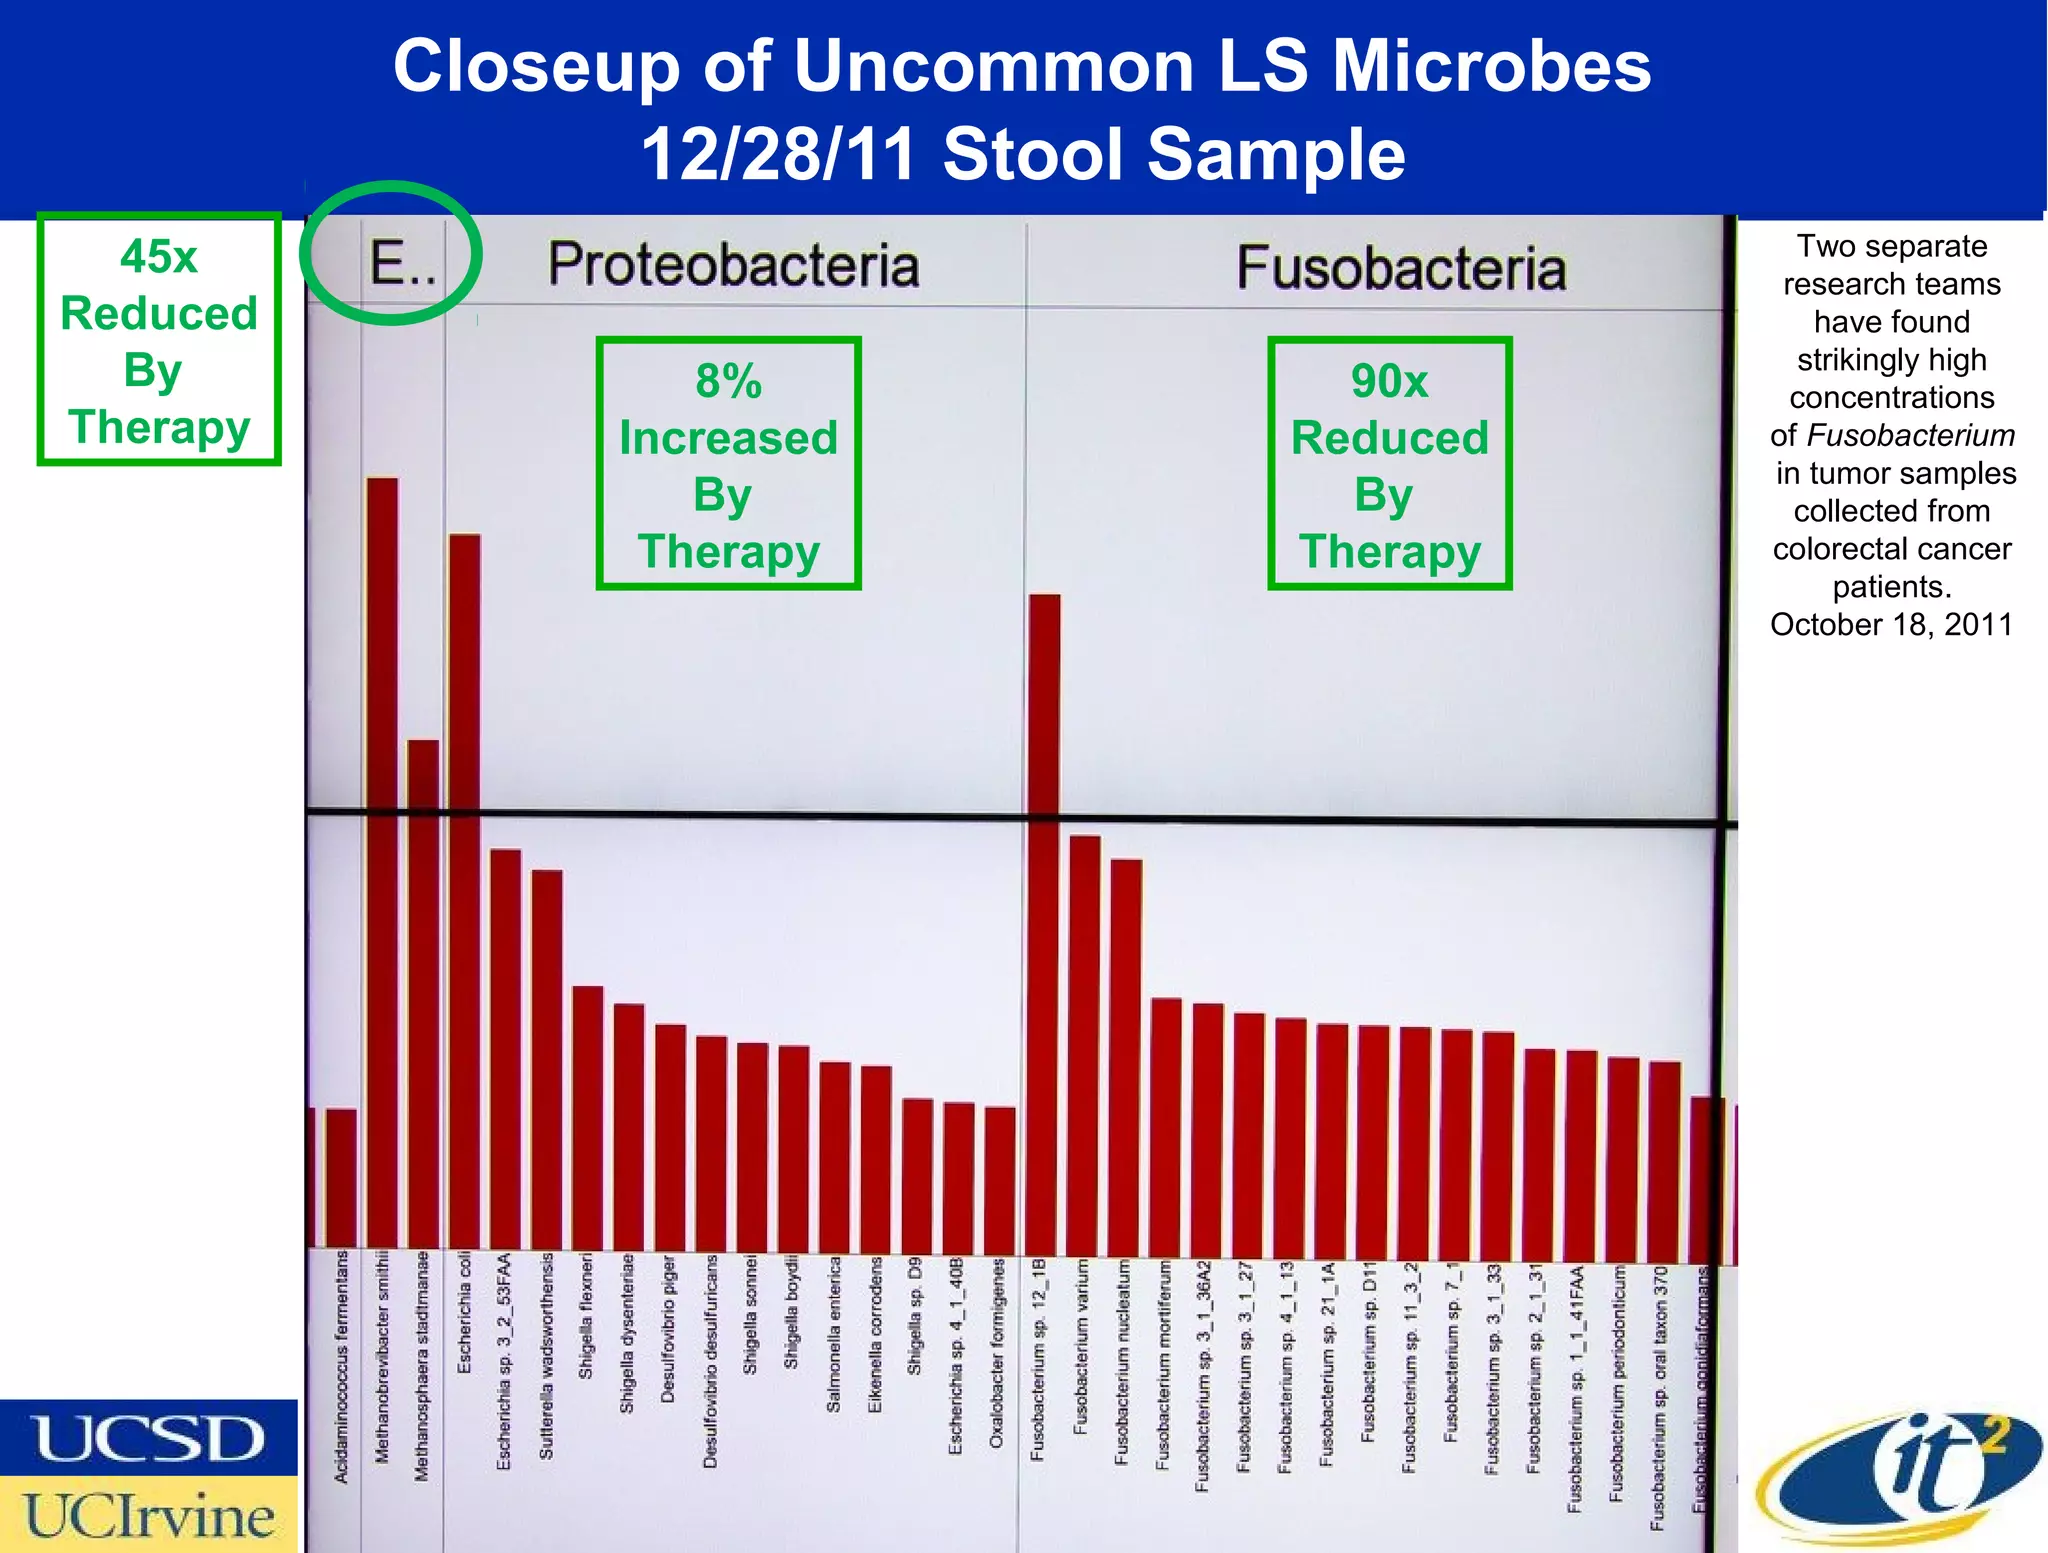

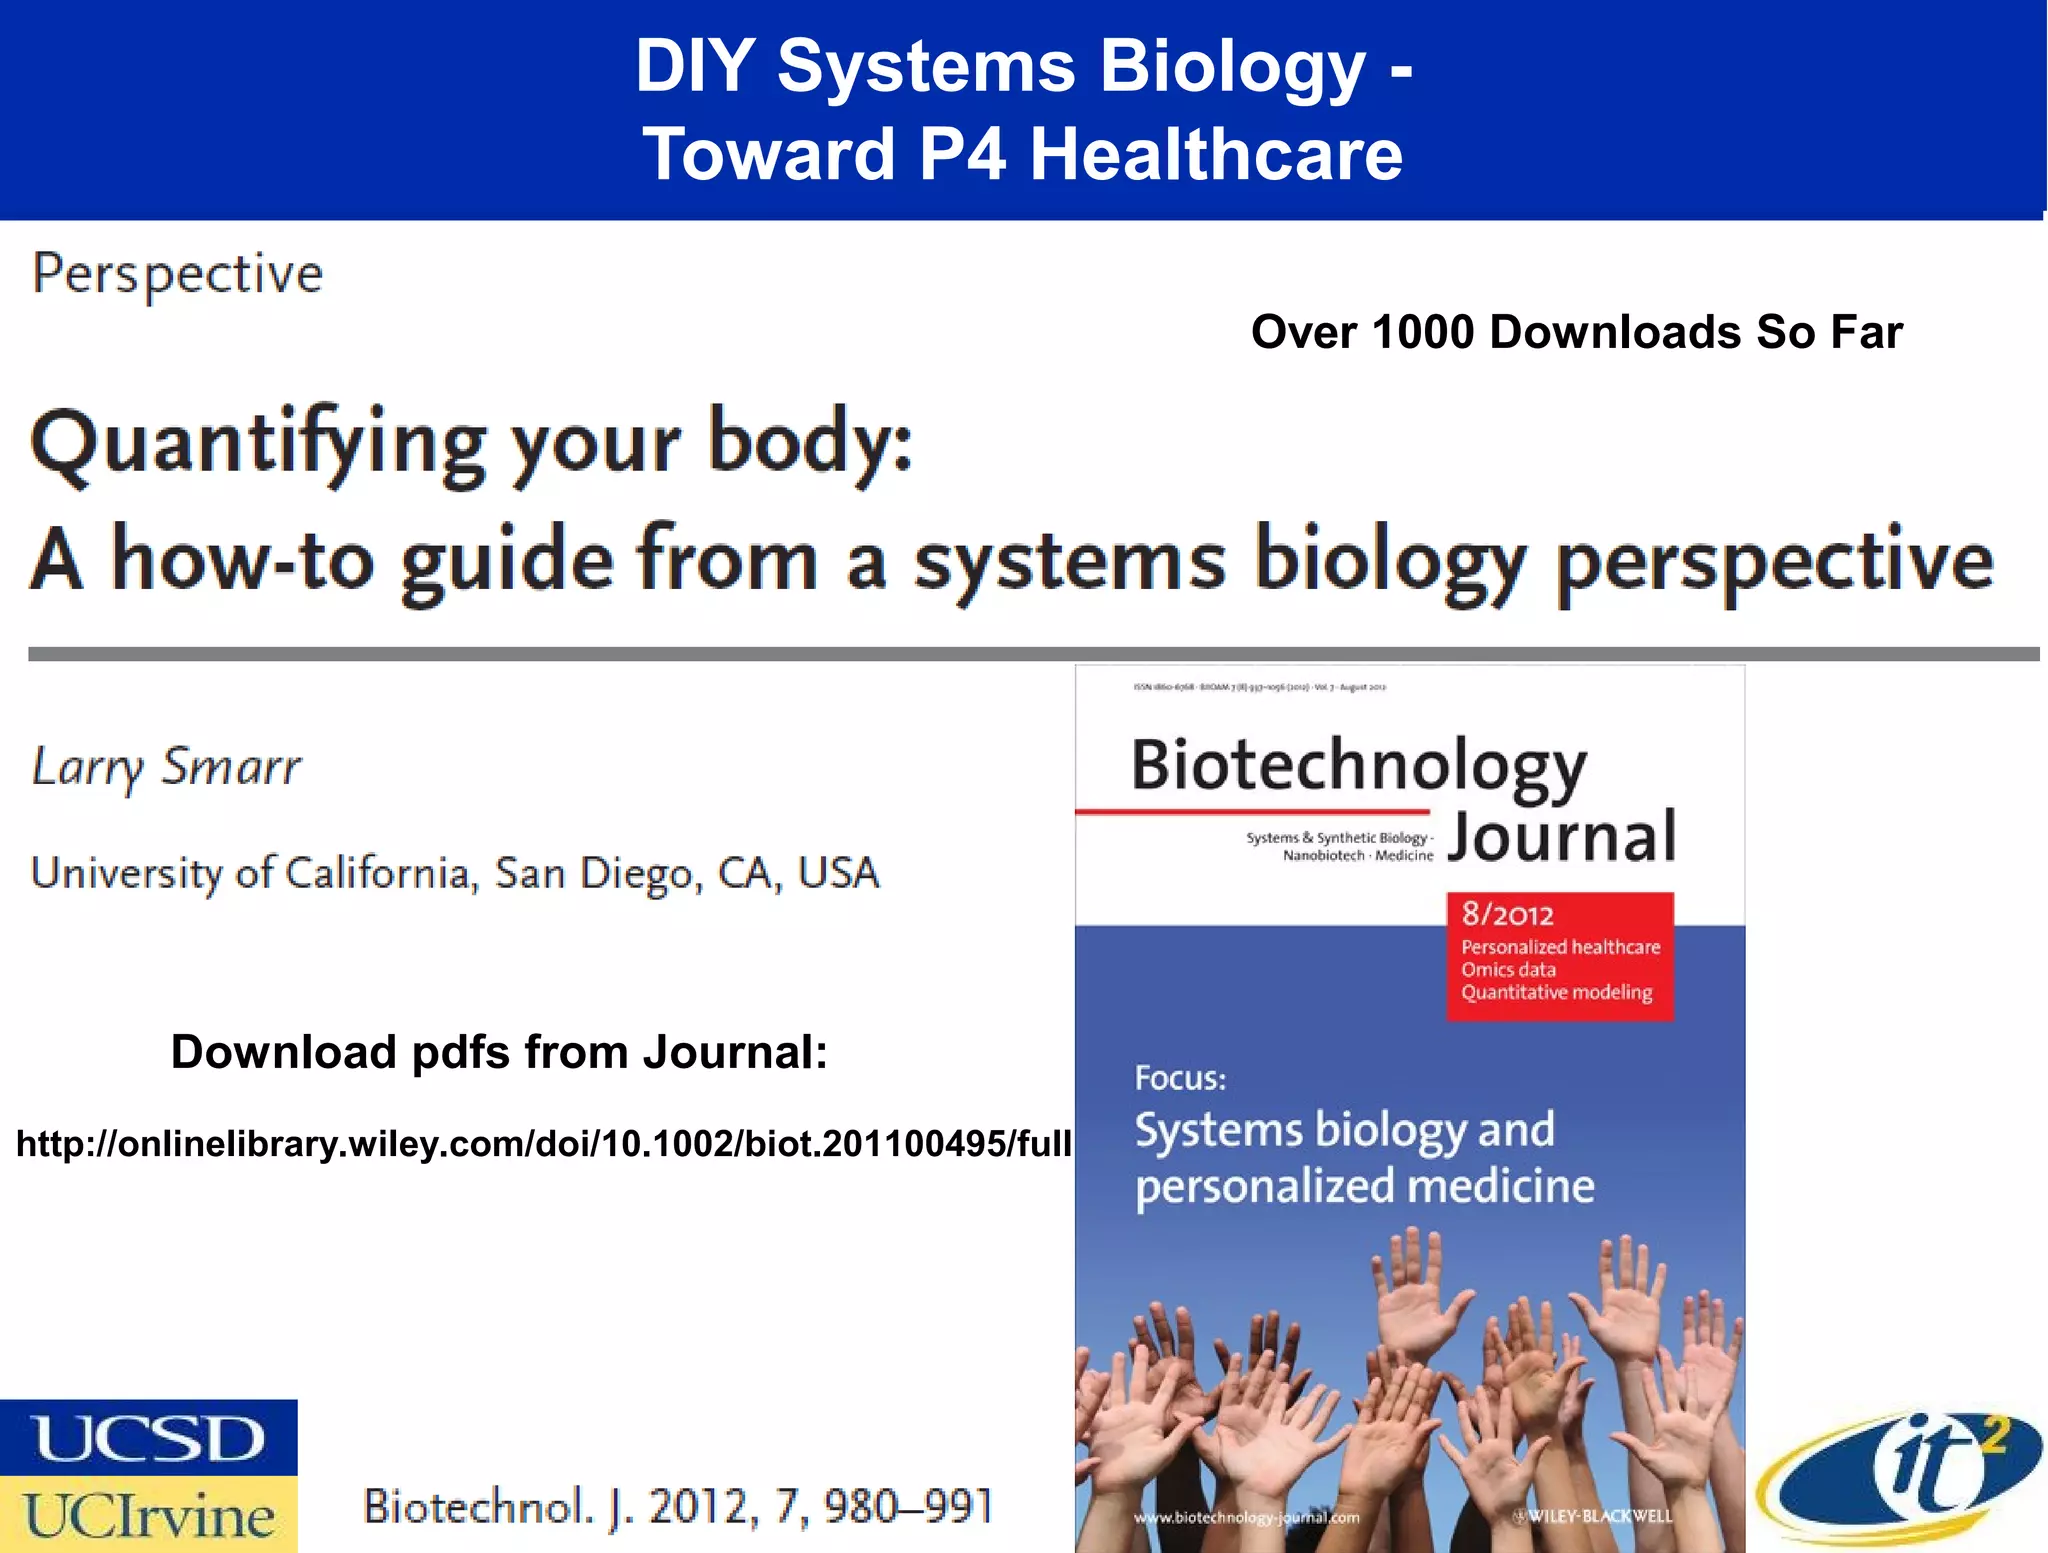
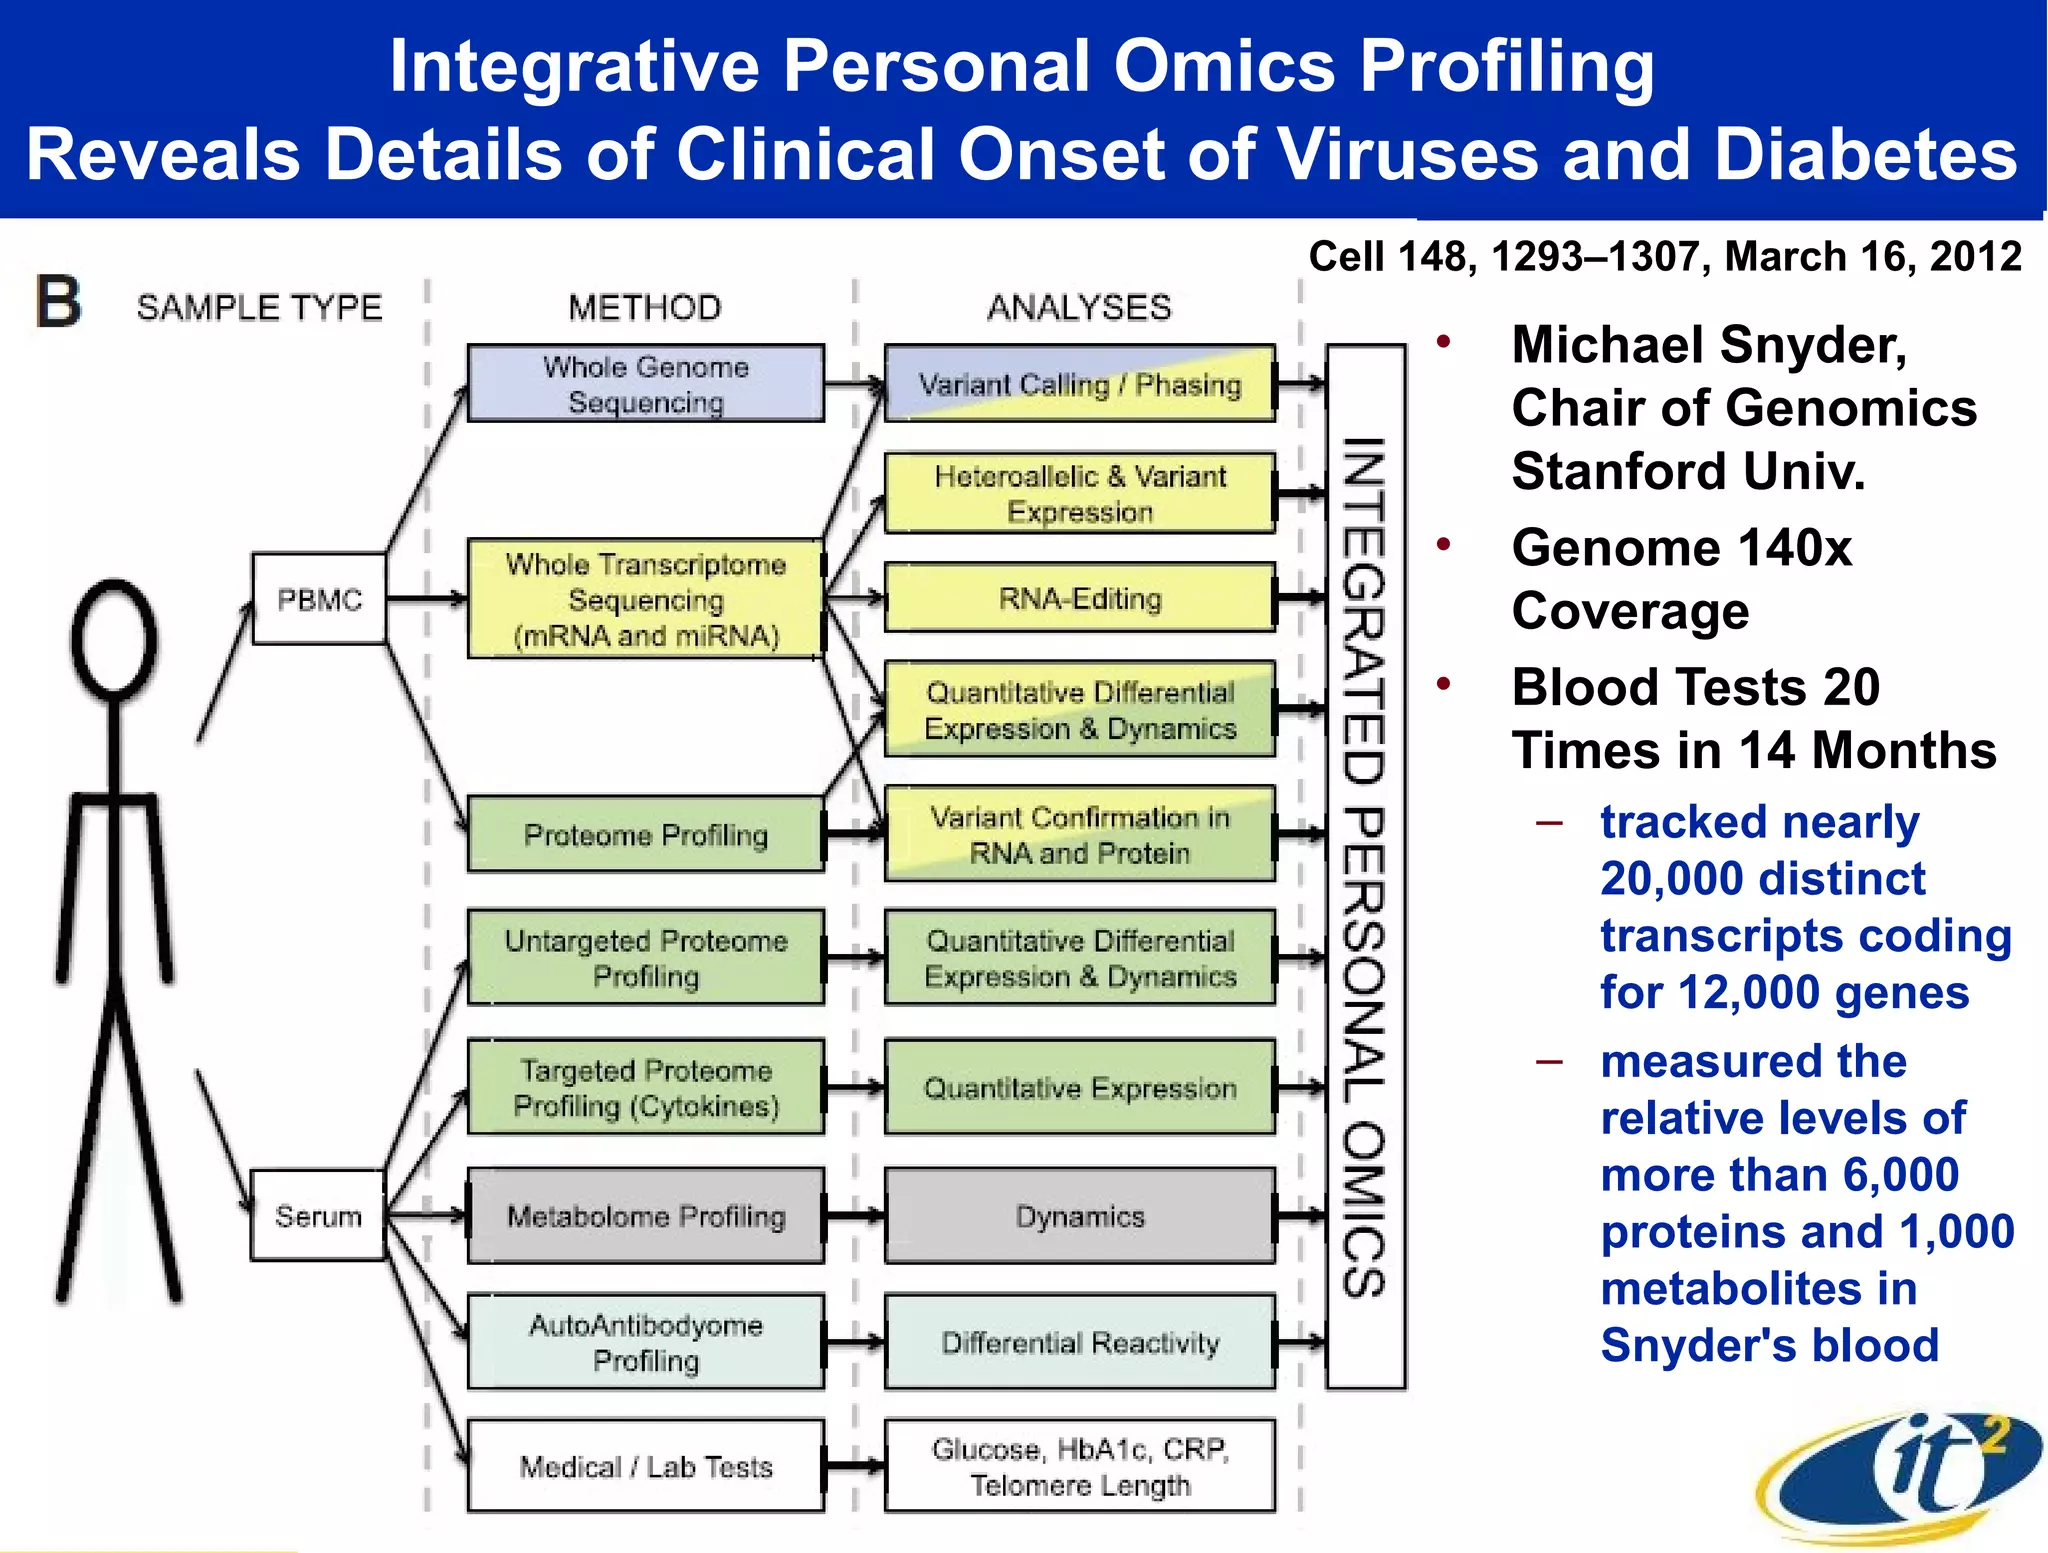

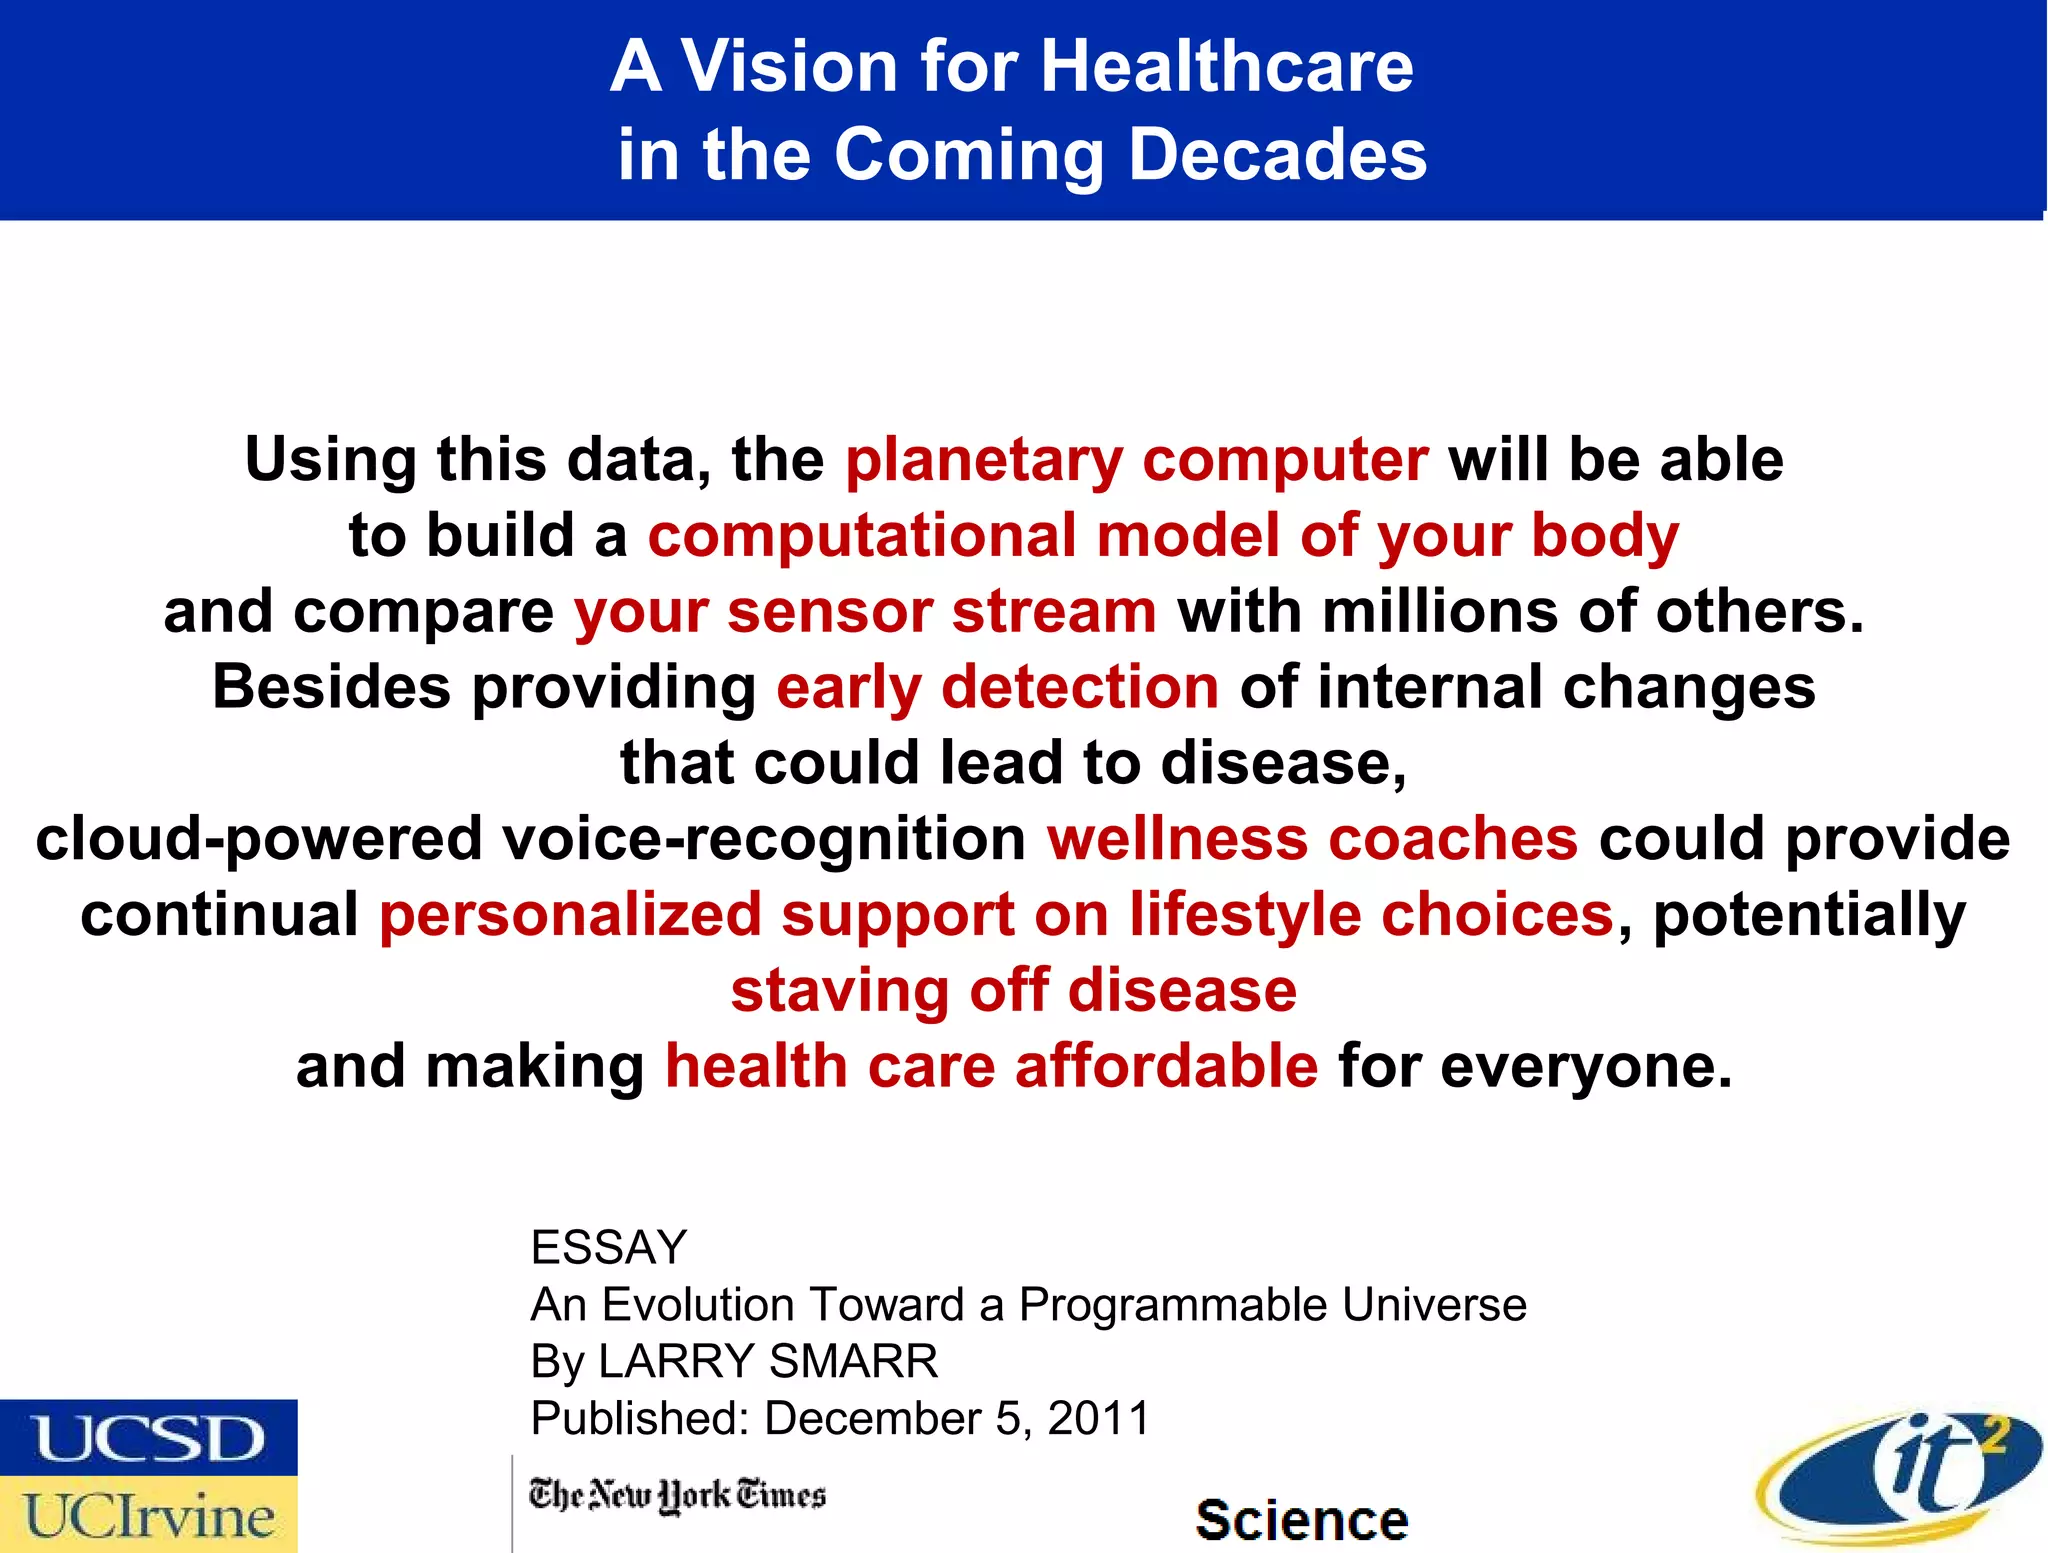

Dr. Larry Smarr discusses the advancements in personal health monitoring through technology, emphasizing the exponential increase in body data over the past decade. He combines various health metrics, genomic sequencing, and imaging techniques to enhance health awareness and discover disease states, notably inflammatory bowel disease. The vision for the future includes personalized and predictive medicine using cloud computing and advanced data analytics to improve overall wellness.


