This document discusses various study designs and methodologies used in quantitative research. It begins by outlining the objectives and possible subsections of a methodology section. It then discusses study area, period, and population. The document explains how to choose study designs and describes descriptive, case-control, cohort, experimental, and mixed methods designs. It provides details on variables, sampling techniques, data collection tools, and analyses. Overall, the document serves as a guide for planning and conducting quantitative research studies.


![SAMPLE SIZE FORMULA FOR PROPORTION
Sample size for single population proportion
• n = Z2
(1-α) p(1-p)/d2
• Sample size calculation for two population
proportion:
n = (Z(1-α)+Z(1-β))2 [p1(1-p1)+ p2(1-p2)]
(p1-p2)2
92](https://image.slidesharecdn.com/studydesigninstrument-230515174840-3417573f/75/Study-design-instrument-92-2048.jpg)


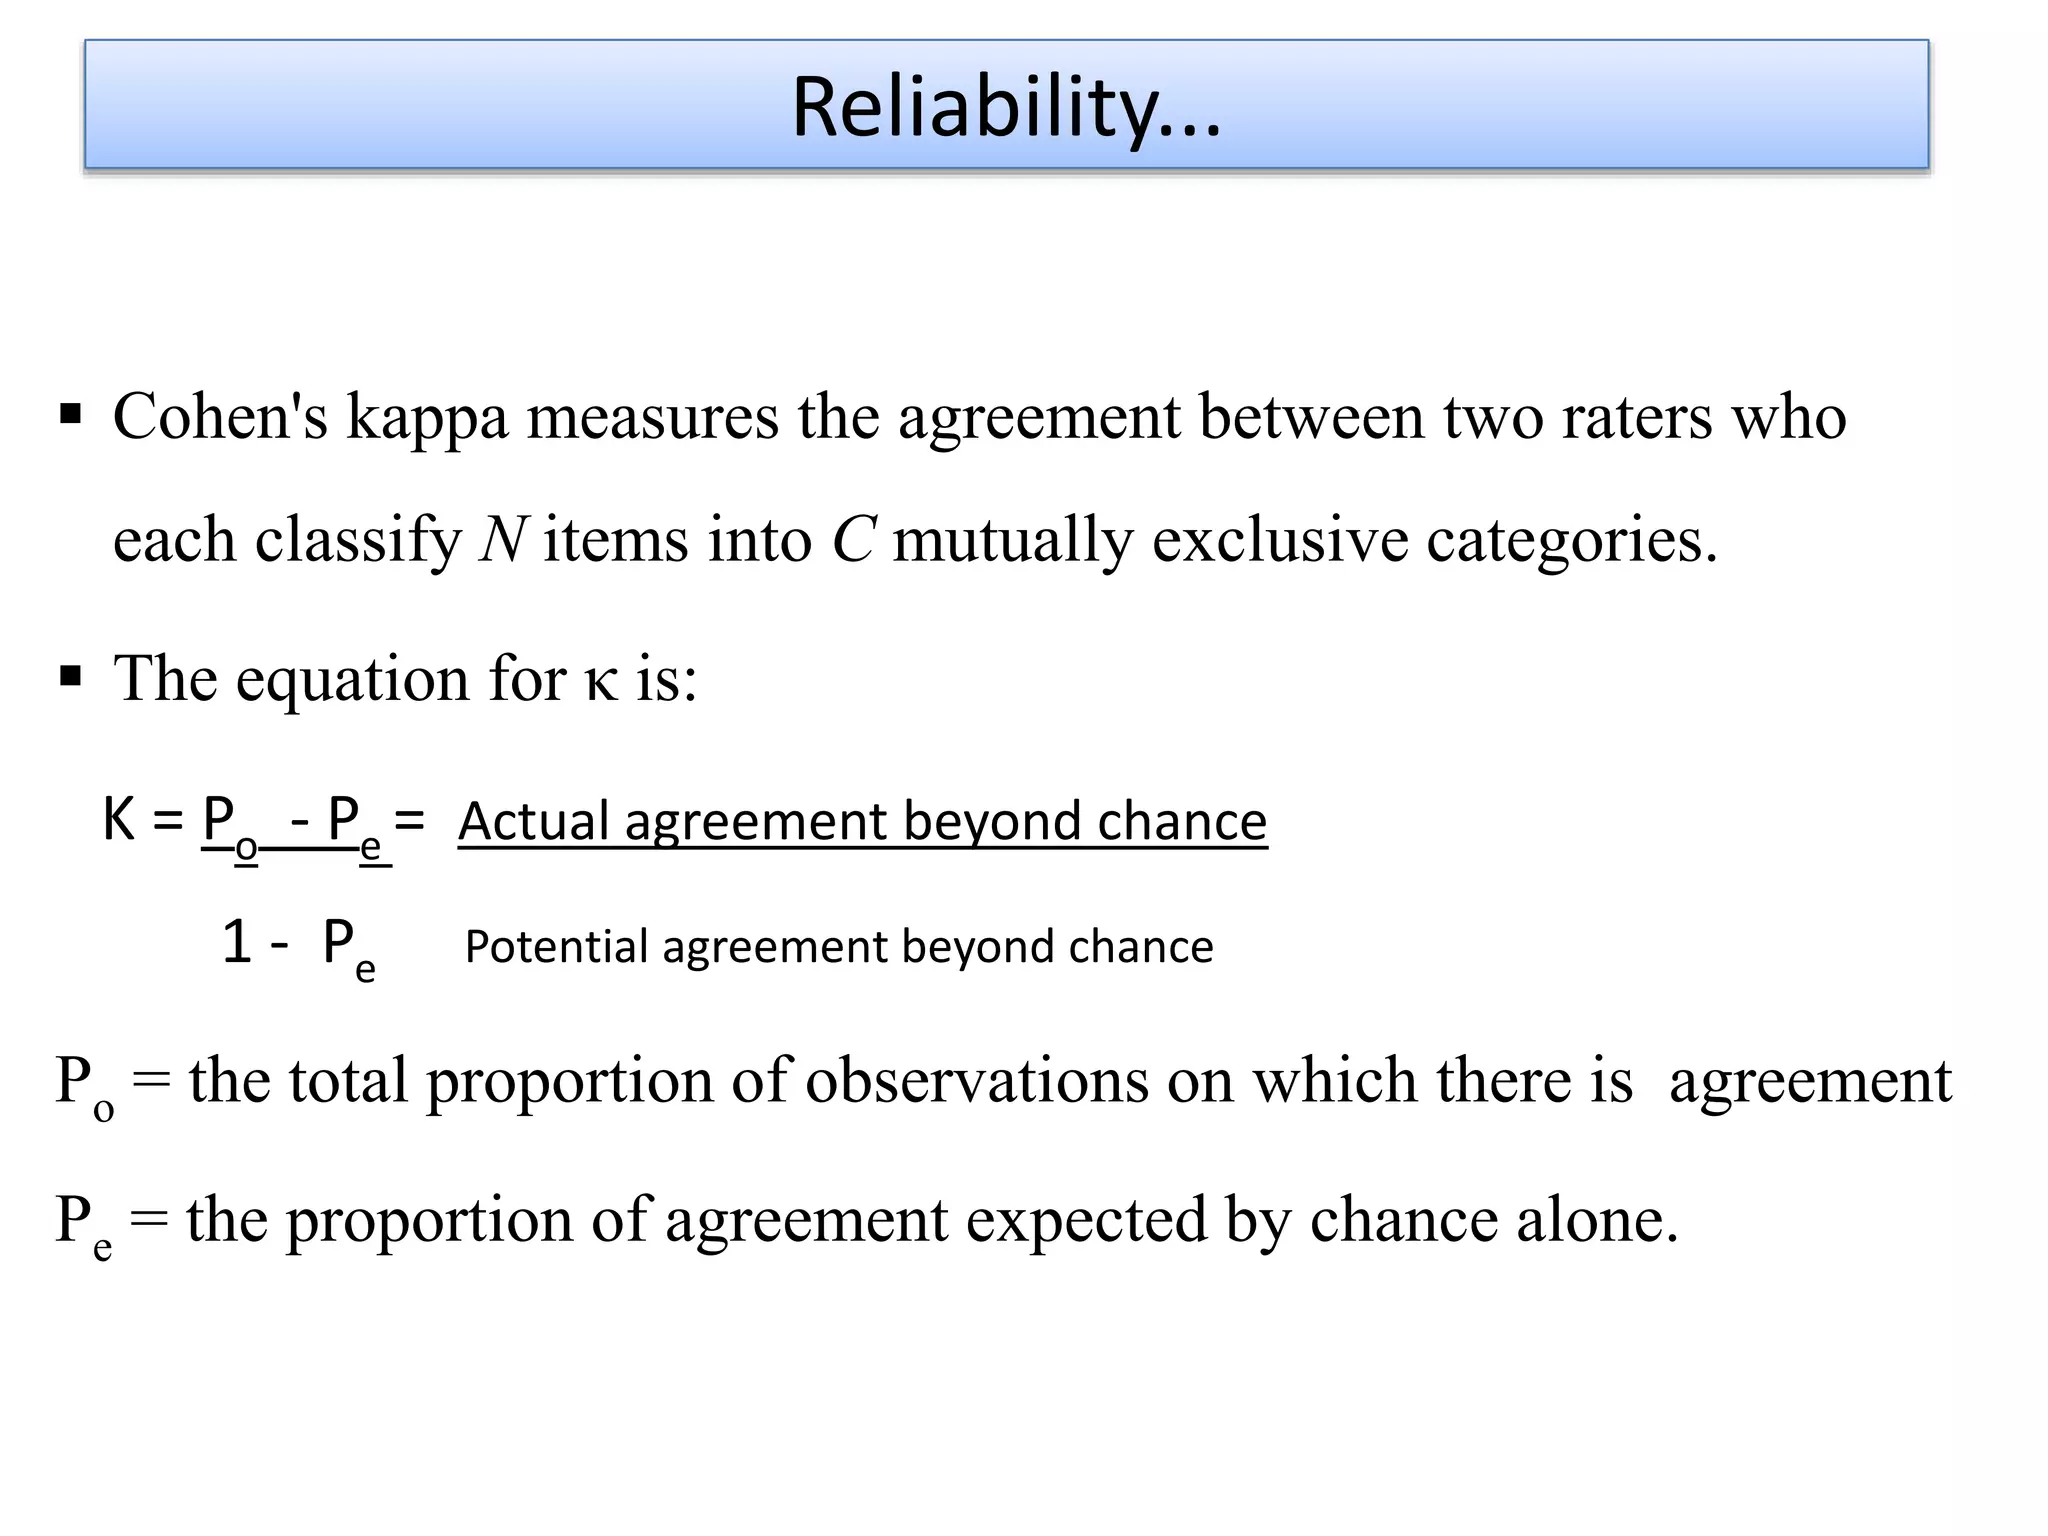

![K (Cont’d)
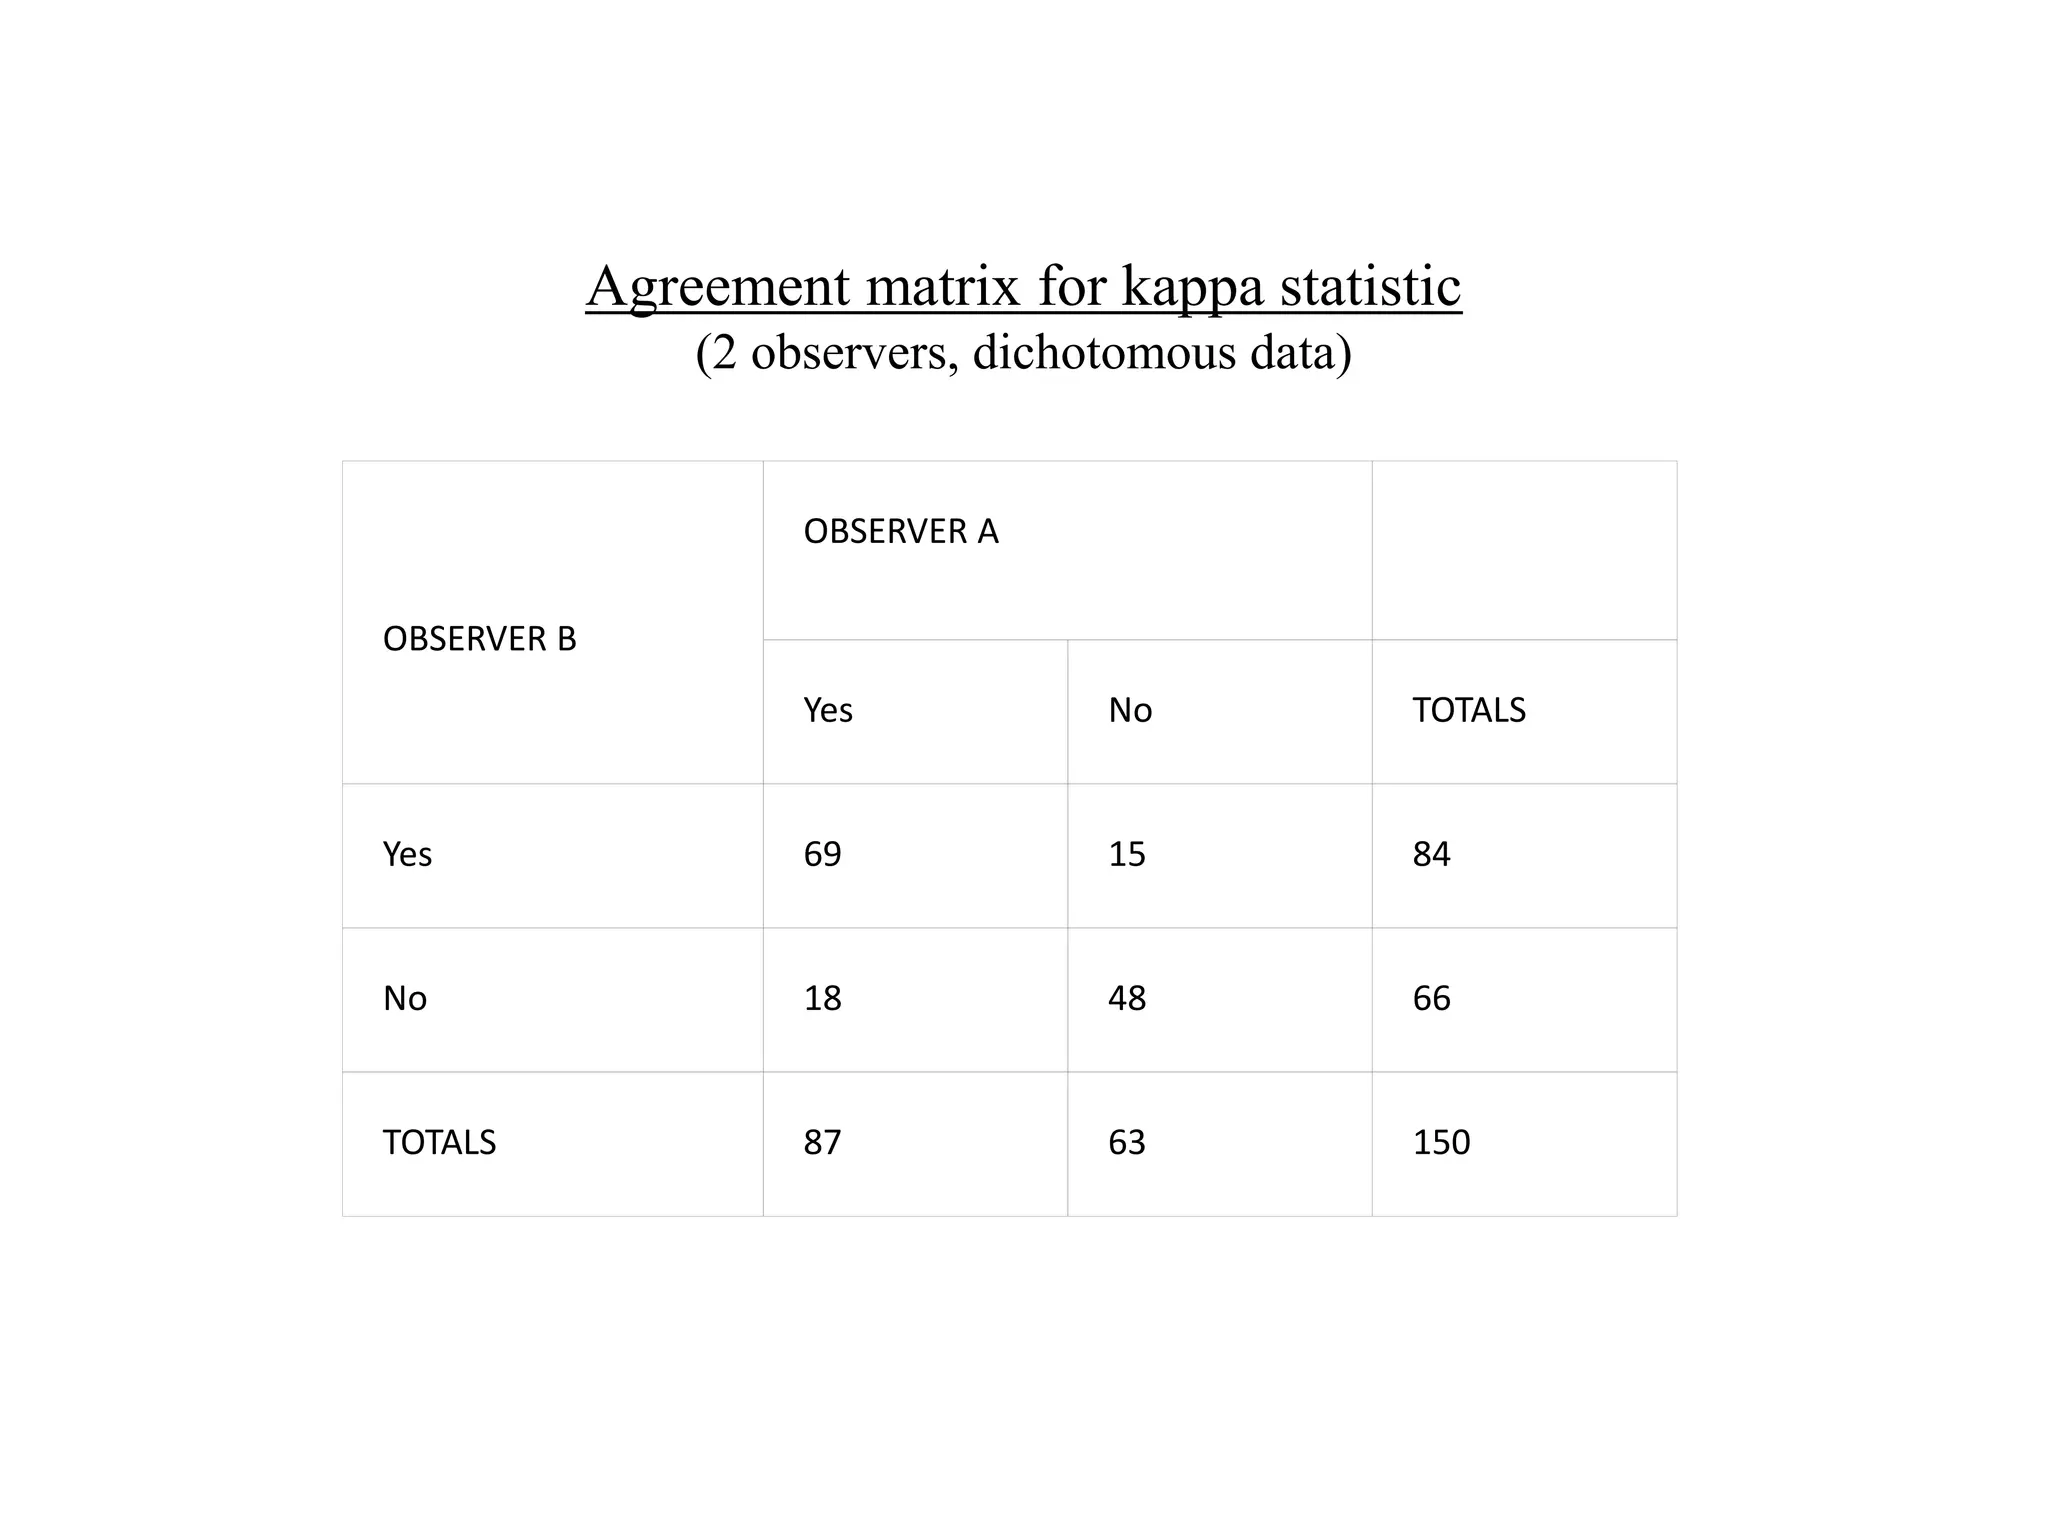
• Observed agreement (Po) = (a+d)/N= (69 + 48)/150 = 0.78 or
78%.
• Agreement expected at chance (Pe) Calculated by the product
of the marginal totals
(Pe) =[ (f1*n1)/N+(f2*n2)/N]*1/N
87 x 84/150 = 48.75
63 x 66/150 = 27.72
Then divide sum [76.47] by 150 to get Pe = 0.51 or 51%.](https://image.slidesharecdn.com/studydesigninstrument-230515174840-3417573f/75/Study-design-instrument-175-2048.jpg)