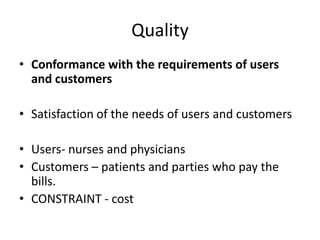
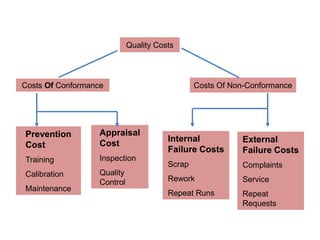
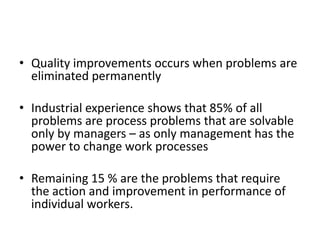
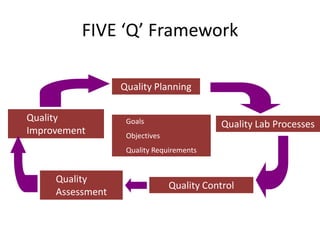
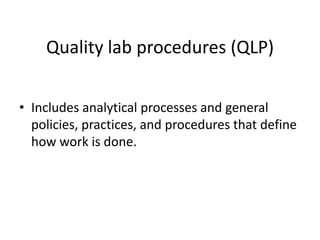
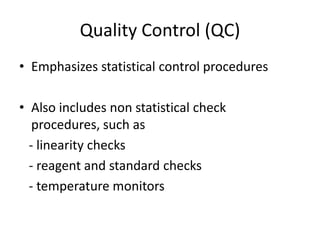
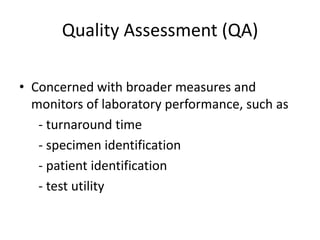
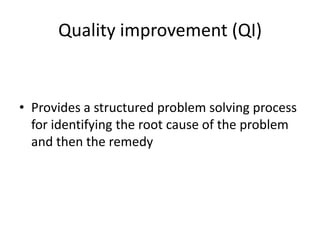
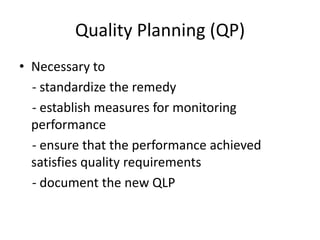
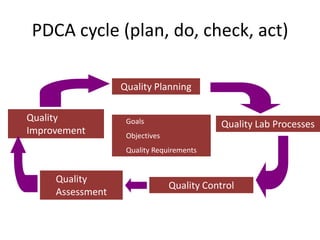
Quality Control
Presented by :- Sqn Ldr Amrita
Parmar
Moderator :- Lt Col Mithu Banerjee
Quality
• Conformance with the requirements of users
and customers
• Satisfaction of the needs of users and customers
• Users- nurses and physicians
• Customers – patients and parties who pay the
bills.
• CONSTRAINT - cost
Quality Costs

Costs Of Conformance

Prevention
Cost

Appraisal
Cost

Training

Inspection

Calibration

Quality
Control

Maintenance

Costs Of Non-Conformance

Internal
Failure Costs

External
Failure Costs

Scrap

Complaints

Rework

Service

Repeat Runs

Repeat
Requests
• Quality improvements occurs when problems are
eliminated permanently
• Industrial experience shows that 85% of all
problems are process problems that are solvable
only by managers – as only management has the
power to change work processes
• Remaining 15 % are the problems that require
the action and improvement in performance of
individual workers.
CONCEPT OF TOTAL QUALITY
MANAGEMENT (TQM)
FIVE ‘Q’ Framework
Quality Planning
Quality
Improvement

Goals

Quality Lab Processes

Objectives
Quality Requirements

Quality
Assessment

Quality Control
Quality lab procedures (QLP)
• Includes analytical processes and general
policies, practices, and procedures that define
how work is done.
Quality Control (QC)
• Emphasizes statistical control procedures
• Also includes non statistical check
procedures, such as
- linearity checks
- reagent and standard checks
- temperature monitors
Quality Assessment (QA)
• Concerned with broader measures and
monitors of laboratory performance, such as
- turnaround time
- specimen identification
- patient identification
- test utility
Quality improvement (QI)

• Provides a structured problem solving process
for identifying the root cause of the problem
and then the remedy
Quality Planning (QP)
• Necessary to
- standardize the remedy
- establish measures for monitoring
performance
- ensure that the performance achieved
satisfies quality requirements
- document the new QLP
PDCA cycle (plan, do, check, act)
Quality Planning
Quality
Improvement

Goals

Quality Lab Processes

Objectives
Quality Requirements

Quality
Assessment

Quality Control
BASIC DEFINITIONS
Accuracy

• Closeness of agreement between a measured
quantity value and a true quantity value of an
analyte
Precision
• Closeness of agreement between measured
quantity values obtained by replicate
measurements on same sample.
Systematic error
• Remains constant or varies in a predictable
manner in replicate measurements
Measurement bias
• Estimate of a systematic measurement error
Random error

• Varies in an unpredictable manner in replicate
measurements
Standard Deviation (SD)
• Standard deviation - extent of random
variation
• SD = √

d

n-1

d=difference of individual result from mean
n=number of observations
CV
• Co-efficient of variation
relative magnitude of variability while
comparing two procedures

• CV % = (SD x 100)/mean
Standard Error
• Measure of dispersion of mean of a set of
observations
• SE = SD/√n
Where n= number of observations
OPERATIONAL LINES
No Bias

Constant Bias
OPERATIONAL LINES - 2
Proportional Bias

Combined Bias
OPERATIONAL LINES - 3
Proportionate Random Error

Constant Random Error
Thank you

Quality control

  • 1.
    Quality Control Presented by:- Sqn Ldr Amrita Parmar Moderator :- Lt Col Mithu Banerjee
  • 2.
    Quality • Conformance withthe requirements of users and customers • Satisfaction of the needs of users and customers • Users- nurses and physicians • Customers – patients and parties who pay the bills. • CONSTRAINT - cost
  • 3.
    Quality Costs Costs OfConformance Prevention Cost Appraisal Cost Training Inspection Calibration Quality Control Maintenance Costs Of Non-Conformance Internal Failure Costs External Failure Costs Scrap Complaints Rework Service Repeat Runs Repeat Requests
  • 4.
    • Quality improvementsoccurs when problems are eliminated permanently • Industrial experience shows that 85% of all problems are process problems that are solvable only by managers – as only management has the power to change work processes • Remaining 15 % are the problems that require the action and improvement in performance of individual workers.
  • 5.
    CONCEPT OF TOTALQUALITY MANAGEMENT (TQM)
  • 6.
    FIVE ‘Q’ Framework QualityPlanning Quality Improvement Goals Quality Lab Processes Objectives Quality Requirements Quality Assessment Quality Control
  • 7.
    Quality lab procedures(QLP) • Includes analytical processes and general policies, practices, and procedures that define how work is done.
  • 8.
    Quality Control (QC) •Emphasizes statistical control procedures • Also includes non statistical check procedures, such as - linearity checks - reagent and standard checks - temperature monitors
  • 9.
    Quality Assessment (QA) •Concerned with broader measures and monitors of laboratory performance, such as - turnaround time - specimen identification - patient identification - test utility
  • 10.
    Quality improvement (QI) •Provides a structured problem solving process for identifying the root cause of the problem and then the remedy
  • 11.
    Quality Planning (QP) •Necessary to - standardize the remedy - establish measures for monitoring performance - ensure that the performance achieved satisfies quality requirements - document the new QLP
  • 12.
    PDCA cycle (plan,do, check, act) Quality Planning Quality Improvement Goals Quality Lab Processes Objectives Quality Requirements Quality Assessment Quality Control
  • 13.
  • 14.
    Accuracy • Closeness ofagreement between a measured quantity value and a true quantity value of an analyte
  • 15.
    Precision • Closeness ofagreement between measured quantity values obtained by replicate measurements on same sample.
  • 16.
    Systematic error • Remainsconstant or varies in a predictable manner in replicate measurements
  • 17.
    Measurement bias • Estimateof a systematic measurement error
  • 18.
    Random error • Variesin an unpredictable manner in replicate measurements
  • 19.
    Standard Deviation (SD) •Standard deviation - extent of random variation • SD = √ d n-1 d=difference of individual result from mean n=number of observations
  • 20.
    CV • Co-efficient ofvariation relative magnitude of variability while comparing two procedures • CV % = (SD x 100)/mean
  • 21.
    Standard Error • Measureof dispersion of mean of a set of observations • SE = SD/√n Where n= number of observations
  • 22.
  • 23.
    OPERATIONAL LINES -2 Proportional Bias Combined Bias
  • 24.
    OPERATIONAL LINES -3 Proportionate Random Error Constant Random Error
  • 25.