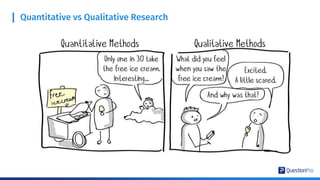
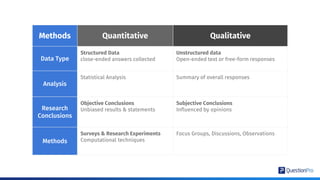
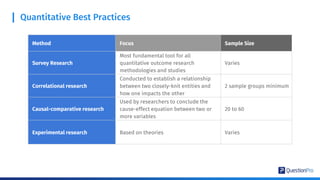
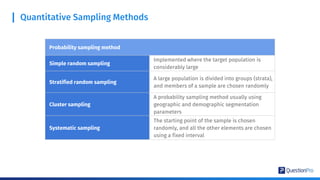
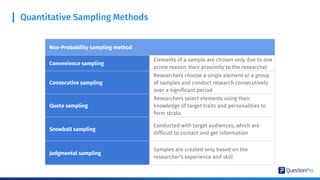
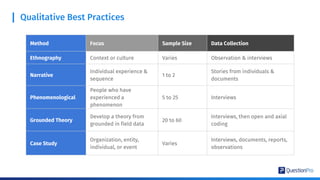
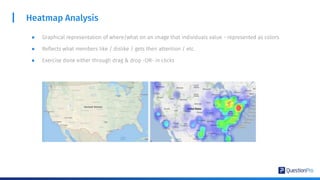
Hosted on October 14, 2020, this QuestionPro Academic focused webinar delved into the differences of Qualitative and Quantitative research and how you can achieve this using the QuestionPro research platform. We spoke about Heatmap and Hotspot analysis, card sorting, online focus groups using video discussions and even a beta feature coming soon, LiveCast that uses NLP to build real-time analytics from video survey questions. Our speaker was Dan Fleetwood, the President for Research and Insights at QuestionPro.
this presentation file is all about the mixed method design for the research study and for those researchers who actually want to mixed two kinds of methods at a time. i hope it will help you and for your research.
Research Process
Piyush Sharma
1. Formulating the Research Problem
Clarify the problem on following basis
States of nature
Relationship between variables
Resolve Ambiguities (if any)
Rephrase the problem into meaningful terms from an analytical point of view.
2. Extensive Literature Survey
Academic Journals
Conference Proceedings
Govt. Reports
Books etc.
3. Development of Working Hypothesis
According to Coffey – “A hypothesis is an attempt at explanation, a provisional supposition made in order to explain scientifically some facts or phenomenon.”
Sources of Hypothesis
Observation
Reflection
Deduction
3. Development of Working Hypothesis
Origin Of Hypothesis
Induction by Simple Enumeration
Method of Agreement
Analogy
Characteristic of a good hypothesis
Non-Contradictoriness
Definite and Clear
Verifiable and Simple
4. Preparing the Research Design
Defining the information needed.
Designing the exploratory, descriptive, and casual phases of the research.
Specifying the measurement and scaling procedures.
Constructing and pretesting a questionnaire or any other for data collection.
Developing a plan of data analysis.
Considerations: Research Design
The means of obtaining the information.
The availability of skills of the researcher and his staff (if any).
The time available for research.
The cost factor available for research.
5. Determining the Sample Design
6. Collecting the Data
Primary Data
By observation
Personal Interview
Telephone Interviews
Mailing Questionnaires
Secondary Data
Surveys by other researchers
Surveys by Govt. etc
7. Analysis of Data
8. Interpretation
Reference and Bibilography
Research Methodology - Mukul Gupta, Deepa Gupta.
Research Methodology (Methods and Techniques) 2nd Revised Edition – C.R. Kothari
Someone named “Marcela” who uploaded a PowerPoint Presentation on the same topic.
Thank You
Motivation in research - Research Methodology - Manu Melwin Joymanumelwin
What makes people to undertake research? This is a question of fundamental importance. The possible motives for doing research may be either one or more of the following:
Desire to get a research degree along with its consequential benefits.
2 hours training on Mobile UX with Farah Nuraini, Interaction Designer at Traveloka, Indonesia
45 min theory: Research, Analysis, Design solutions and Testing
+ 1h15 min of hands-on exercises with the 5 facilitators from Traveloka.
This presentation was provided by Serena Rosenhan of ProQuest, during Session Four of the NISO event "Agile Product and Project Management for Information Products and Services," held on June 4, 2020.
Usability testing (or user testing) involves measuring the ease with which users can complete common tasks on your website. The results of the analysis are a huge eye-opener and their implementation often leads to:
Increased sales and task completion and a high rate of return site visitors
A greatly improved understanding of your customers’ needs
A significant reduction in call centre enquiries
A much more user-focused in-house development team Source: http://www.wbcsoftwarelab.com/wbcblog/read-basics-of-usability-testing
What Is UX Research & How Is It Done.pptxTurboAnchor
<a href="https://turboanchor.com/what-is-ux-research/">What Is UX Research & How Is It Done?</a>
To develop products that can meet users’ needs (and captivate them as well), you first have to determine who your user is and what their needs are. That’s where user experience (UX) research comes in. UX researchers thoroughly research target users to collect and interpret data that assist inform the product design process.
So for more in-depth knowledge, let’s take a closer look at what is UX research is,
UX research is learning about target users, product needs, and wants, then using those insights to enhance the design process. UX researchers follow different methods to discover problems & design opportunities. It’s all about finding insights to direct successful design. As discussed above, when you conduct UX research, you can provide the best solutions as you know what they need. It can be applied at any stage of the design process.
QuestionPro - Introduction to Customer Experience Part 3: CX BenchmarkingQuestionPro
Now that you have chosen your CX metric and mapped out your customer journey, the last key foundation of building a successful CX program is benchmarking.
Benchmarking allows understanding how your organization is performing in relation to others - both in your own sector and in other sectors. There are several ways to benchmark your performance over time, but we will introduce you different ways that are found to be successful to companies such as Emirates, Salesforce, and UPS.
Join us and learn how benchmarking:
• Uncovers key drivers that influence your organization’s performance
• Provides a quick way to evaluate your CX readiness and business goals
• Differentiates yourself against others
The Future of Employee Engagement and Positivity at Workplace WebinarQuestionPro
Learn Everything you need to know about The Future of Employee Engagement employee satisfaction and Positivity at Workplace.
Our latest research and analytical insights from our employee engagement and employee satisfaction and assessment surveys data sets on what works in making our workplaces more positive and more productive.
We will examine the key drivers for workplace motivation and well-being from the perspective of data analytics and assessments for:
Leaders, younger workers, gender breakdown and nationality.
QuestionPro - Introduction to Customer Experience Part 2: Customer Journey Ma...QuestionPro
Did you know? Customer journey mapping drives improvements that yield the greatest financial return.
In Part Two of this Introduction to Customer Experience Management webinar series, you will learn about the second key element widely used in successful CX programs: customer journey mapping. Join us along with David Hicks, CEO of TribeCX, as we define customer journey mapping and discuss why it is critical to improving your customer experience.
You'll learn:
• How to chart each step of your customer experience
• How to highlight your moments of truth
• Customer mapping best practices
Qualitative Options with Online Communities QuestionPro
One of the great benefits if having a community is the opportunity to run both quantitative and qualitative research. When it comes to qualitative research, there is a wide range of options, for example online discussions, smartphone ethnography, online focus groups, and depth interviews. In this webinar I will provide some tips to help you match approaches to business problems, answering questions like when should you use a group technique (e.g. Focus groups) or a solo approach (such as diaries)?
QuestionPro TribeCX Webinar - Introduction to Customer Experience Part 1: CX ...QuestionPro
Introduction to Customer Experience Metrics: Which Metrics Should I Use?
Deciding where to start when measuring Customer Experience can be overwhelming, even for those with years of experience. The first place to start is measuring your key CX metrics through collected feedback. But when it comes to a qualitative concept like CX, how exactly do you measure it? What kinds of metrics should be used?
In Part One of the webinar, David Hicks, CEO of TribeCX will share some common metrics that companies with successful CX programs use to evaluate and measure their customer experience.
You'll learn about:
• CX metrics such as Net Promoter Score (NPS) and Customer Effort Score (CES)
• Choosing the most appropriate and valuable metrics, based on your customers and organization
• Best Practices for measuring and managing your CX metrics
QuestionPro Assessments Webinar - Trust, But Verify: The Evolution of Vendor ...QuestionPro
In this webinar on Vendor Risk Assessment, we discuss the evolution of Vendor Risk Management and its most common challenges for organizations while learning our top industry best practices.
QuestionPro CX - Not Just a Number: Using NPS to Improve Customer ExperienceQuestionPro
In this special webinar, CX Expert, Shep Hyken will not only discuss NPS, but divulge his best tips on measuring Net Promoter Score to deliver a better customer experience. Join us and gain a better understanding of how you can use Net Promoter Score to measure and improve your customer experience to ultimately increase revenue.
You'll learn:
1. CX Trends in 2017
2. The differences between Customer Experience and Customer Service
3. Ways to measure CX and the metrics
4. CX and Revenue Correlation
5. Top ways to improve CX
QuestionPro Advanced Training Keys to Success - Discrete Conjoint Analysis 101QuestionPro
Our April 2017 Keys to Success series deep dives into Discrete Choice Conjoint Analysis, an effective and advanced survey technique. In this training, learn to analyze how and why customers choose certain products or services over others. This training discusses research industry best practices on creating a comprehensive end-to-end conjoint analysis project, so that you can address and find solutions to even some of the most complex business objectives.
QuestionPro Audience Webinar - How to Improve Data Quality For Your ResearchQuestionPro
With millions of people interacting online it only makes sense for market researchers to conduct research with online communities. The internet allows increased access to a wide range of diverse audiences, but gathering quality data from these participants can be challenging. This webinar will help you understand how to improve your data collection practices through better survey design methodology, tips to avoid response bias, variations in question styles and optimal data analysis. John Barrett, CEO of Priority Metrics Group, will share strategies regarding design methodologies that will keep your respondents engaged. With over 20 years experience working with Fortune 500 companies, John Barrett knows how to optimize results.
Webinar - Deeper Insights Through Intelligent Community EngagementQuestionPro
There’s a gap between online communities that thrive and those that struggle. This gap is the level of engagement, which is the lifeblood of successful online communities. Without member engagement, a community culture won’t develop, interactions don’t happen and companies lose the potential of getting valuable feedback and insights. This feedback and insights is essential for improving products and services. The secret to getting people more engaged in an online community lies in engendering members with increasing levels of competence, autonomy, and relatedness.
Webinar - Return to editingThe Secret to Making HR Relevant AgainQuestionPro
This webinar features two leading thinkers in the HR space who will challenge and encourage you with a frank conversation about the state of the HR crucial function and what needs to change.
Webinar - The Ultimate Guide to Effective Online SurveysQuestionPro
Creating effective online surveys is a both a delicate art and a science. Great surveys are the foundation for actionable results, but getting there can be extremely difficult. Fortunately, to be effective with surveys, you don't have to be a statistician or a seasoned market research professional. In this webinar, we discuss Setting Research Objectives, Understanding Your Target Audience, Optimal Survey Design, Optimal Survey Length, Optimal Survey Questions, Survey Branching, Survey Distribution, Analyzing Surveys, and Creating Actionable Survey Data!
Webinar - How Mobile Innovation Is Changing the Face of Data IntelligenceQuestionPro
Mobile has transformed the relationship between brands and customers and this is transforming how market and social research need to be conducted and delivered. In this webinar, our experts will deep-dive into mobile as the marketing measurement and data collection platform, while also providing a holistic view of current and future opportunities for marketers as mobile and cross platform research methods continue to evolve.
Webinar - A Beginners Guide to Choice-based Conjoint AnalysisQuestionPro
Choice-based Conjoint Analysis (CBC) is arguably the single most powerful analytic tool ever developed. With CBC, one can define the ideal product feature set, determine the price that maximizes profit, develop the most motivating communication strategies and segment the marketplace. QuestionPro has unique capabilities that accommodate the very specific data collection requirements of CBC, allowing users to create more accurate consumer insights than ever before. This webinar will review, in non-technical terms, how CBC works and what business questions it can answer.
Webinar Tutorial - A Beginners Guide To MaxDiff ScalingQuestionPro
MaxDiff Scaling has proven to generate better quality data than ratings scales in virtually every evaluative measure. QuestionPro has unique capabilities that accommodate the very specific data collection requirements of MaxDiff, allowing users to create more accurate consumer insights than ever before. In this webinar, Richard McCullough will review, in non-technical terms, how MaxDiff works, why it is superior to ratings scales and what business questions it can answer.
Webinar - The Secret To Recruiting The Best TalentQuestionPro
Learn to create authentic branding and engage top talent. Join WorkXO founders and employee engagement experts Jamie Notter and Charlie Judy as they explore why brand authenticity matters, how to use data to create an authentic employer brand, the importance of building a strong work culture, and how to start designing the culture you want.
In 2015, I used to write extensions for Joomla, WordPress, phpBB3, etc and I ...Juraj Vysvader
In 2015, I used to write extensions for Joomla, WordPress, phpBB3, etc and I didn't get rich from it but it did have 63K downloads (powered possible tens of thousands of websites).
Strategies for Successful Data Migration Tools.pptxvarshanayak241
Data migration is a complex but essential task for organizations aiming to modernize their IT infrastructure and leverage new technologies. By understanding common challenges and implementing these strategies, businesses can achieve a successful migration with minimal disruption. Data Migration Tool like Ask On Data play a pivotal role in this journey, offering features that streamline the process, ensure data integrity, and maintain security. With the right approach and tools, organizations can turn the challenge of data migration into an opportunity for growth and innovation.
Multiple Your Crypto Portfolio with the Innovative Features of Advanced Crypt...Hivelance Technology
Cryptocurrency trading bots are computer programs designed to automate buying, selling, and managing cryptocurrency transactions. These bots utilize advanced algorithms and machine learning techniques to analyze market data, identify trading opportunities, and execute trades on behalf of their users. By automating the decision-making process, crypto trading bots can react to market changes faster than human traders
Hivelance, a leading provider of cryptocurrency trading bot development services, stands out as the premier choice for crypto traders and developers. Hivelance boasts a team of seasoned cryptocurrency experts and software engineers who deeply understand the crypto market and the latest trends in automated trading, Hivelance leverages the latest technologies and tools in the industry, including advanced AI and machine learning algorithms, to create highly efficient and adaptable crypto trading bots
Why React Native as a Strategic Advantage for Startup Innovation.pdfayushiqss
Do you know that React Native is being increasingly adopted by startups as well as big companies in the mobile app development industry? Big names like Facebook, Instagram, and Pinterest have already integrated this robust open-source framework.
In fact, according to a report by Statista, the number of React Native developers has been steadily increasing over the years, reaching an estimated 1.9 million by the end of 2024. This means that the demand for this framework in the job market has been growing making it a valuable skill.
But what makes React Native so popular for mobile application development? It offers excellent cross-platform capabilities among other benefits. This way, with React Native, developers can write code once and run it on both iOS and Android devices thus saving time and resources leading to shorter development cycles hence faster time-to-market for your app.
Let’s take the example of a startup, which wanted to release their app on both iOS and Android at once. Through the use of React Native they managed to create an app and bring it into the market within a very short period. This helped them gain an advantage over their competitors because they had access to a large user base who were able to generate revenue quickly for them.
Gamify Your Mind; The Secret Sauce to Delivering Success, Continuously Improv...Shahin Sheidaei
Games are powerful teaching tools, fostering hands-on engagement and fun. But they require careful consideration to succeed. Join me to explore factors in running and selecting games, ensuring they serve as effective teaching tools. Learn to maintain focus on learning objectives while playing, and how to measure the ROI of gaming in education. Discover strategies for pitching gaming to leadership. This session offers insights, tips, and examples for coaches, team leads, and enterprise leaders seeking to teach from simple to complex concepts.
Prosigns: Transforming Business with Tailored Technology SolutionsProsigns
Unlocking Business Potential: Tailored Technology Solutions by Prosigns
Discover how Prosigns, a leading technology solutions provider, partners with businesses to drive innovation and success. Our presentation showcases our comprehensive range of services, including custom software development, web and mobile app development, AI & ML solutions, blockchain integration, DevOps services, and Microsoft Dynamics 365 support.
Custom Software Development: Prosigns specializes in creating bespoke software solutions that cater to your unique business needs. Our team of experts works closely with you to understand your requirements and deliver tailor-made software that enhances efficiency and drives growth.
Web and Mobile App Development: From responsive websites to intuitive mobile applications, Prosigns develops cutting-edge solutions that engage users and deliver seamless experiences across devices.
AI & ML Solutions: Harnessing the power of Artificial Intelligence and Machine Learning, Prosigns provides smart solutions that automate processes, provide valuable insights, and drive informed decision-making.
Blockchain Integration: Prosigns offers comprehensive blockchain solutions, including development, integration, and consulting services, enabling businesses to leverage blockchain technology for enhanced security, transparency, and efficiency.
DevOps Services: Prosigns' DevOps services streamline development and operations processes, ensuring faster and more reliable software delivery through automation and continuous integration.
Microsoft Dynamics 365 Support: Prosigns provides comprehensive support and maintenance services for Microsoft Dynamics 365, ensuring your system is always up-to-date, secure, and running smoothly.
Learn how our collaborative approach and dedication to excellence help businesses achieve their goals and stay ahead in today's digital landscape. From concept to deployment, Prosigns is your trusted partner for transforming ideas into reality and unlocking the full potential of your business.
Join us on a journey of innovation and growth. Let's partner for success with Prosigns.
Understanding Globus Data Transfers with NetSageGlobus
NetSage is an open privacy-aware network measurement, analysis, and visualization service designed to help end-users visualize and reason about large data transfers. NetSage traditionally has used a combination of passive measurements, including SNMP and flow data, as well as active measurements, mainly perfSONAR, to provide longitudinal network performance data visualization. It has been deployed by dozens of networks world wide, and is supported domestically by the Engagement and Performance Operations Center (EPOC), NSF #2328479. We have recently expanded the NetSage data sources to include logs for Globus data transfers, following the same privacy-preserving approach as for Flow data. Using the logs for the Texas Advanced Computing Center (TACC) as an example, this talk will walk through several different example use cases that NetSage can answer, including: Who is using Globus to share data with my institution, and what kind of performance are they able to achieve? How many transfers has Globus supported for us? Which sites are we sharing the most data with, and how is that changing over time? How is my site using Globus to move data internally, and what kind of performance do we see for those transfers? What percentage of data transfers at my institution used Globus, and how did the overall data transfer performance compare to the Globus users?
How to Position Your Globus Data Portal for Success Ten Good PracticesGlobus
Science gateways allow science and engineering communities to access shared data, software, computing services, and instruments. Science gateways have gained a lot of traction in the last twenty years, as evidenced by projects such as the Science Gateways Community Institute (SGCI) and the Center of Excellence on Science Gateways (SGX3) in the US, The Australian Research Data Commons (ARDC) and its platforms in Australia, and the projects around Virtual Research Environments in Europe. A few mature frameworks have evolved with their different strengths and foci and have been taken up by a larger community such as the Globus Data Portal, Hubzero, Tapis, and Galaxy. However, even when gateways are built on successful frameworks, they continue to face the challenges of ongoing maintenance costs and how to meet the ever-expanding needs of the community they serve with enhanced features. It is not uncommon that gateways with compelling use cases are nonetheless unable to get past the prototype phase and become a full production service, or if they do, they don't survive more than a couple of years. While there is no guaranteed pathway to success, it seems likely that for any gateway there is a need for a strong community and/or solid funding streams to create and sustain its success. With over twenty years of examples to draw from, this presentation goes into detail for ten factors common to successful and enduring gateways that effectively serve as best practices for any new or developing gateway.
Providing Globus Services to Users of JASMIN for Environmental Data AnalysisGlobus
JASMIN is the UK’s high-performance data analysis platform for environmental science, operated by STFC on behalf of the UK Natural Environment Research Council (NERC). In addition to its role in hosting the CEDA Archive (NERC’s long-term repository for climate, atmospheric science & Earth observation data in the UK), JASMIN provides a collaborative platform to a community of around 2,000 scientists in the UK and beyond, providing nearly 400 environmental science projects with working space, compute resources and tools to facilitate their work. High-performance data transfer into and out of JASMIN has always been a key feature, with many scientists bringing model outputs from supercomputers elsewhere in the UK, to analyse against observational or other model data in the CEDA Archive. A growing number of JASMIN users are now realising the benefits of using the Globus service to provide reliable and efficient data movement and other tasks in this and other contexts. Further use cases involve long-distance (intercontinental) transfers to and from JASMIN, and collecting results from a mobile atmospheric radar system, pushing data to JASMIN via a lightweight Globus deployment. We provide details of how Globus fits into our current infrastructure, our experience of the recent migration to GCSv5.4, and of our interest in developing use of the wider ecosystem of Globus services for the benefit of our user community.
Large Language Models and the End of ProgrammingMatt Welsh
Talk by Matt Welsh at Craft Conference 2024 on the impact that Large Language Models will have on the future of software development. In this talk, I discuss the ways in which LLMs will impact the software industry, from replacing human software developers with AI, to replacing conventional software with models that perform reasoning, computation, and problem-solving.
Accelerate Enterprise Software Engineering with PlatformlessWSO2
Key takeaways:
Challenges of building platforms and the benefits of platformless.
Key principles of platformless, including API-first, cloud-native middleware, platform engineering, and developer experience.
How Choreo enables the platformless experience.
How key concepts like application architecture, domain-driven design, zero trust, and cell-based architecture are inherently a part of Choreo.
Demo of an end-to-end app built and deployed on Choreo.
Your Digital Assistant.
Making complex approach simple. Straightforward process saves time. No more waiting to connect with people that matter to you. Safety first is not a cliché - Securely protect information in cloud storage to prevent any third party from accessing data.
Would you rather make your visitors feel burdened by making them wait? Or choose VizMan for a stress-free experience? VizMan is an automated visitor management system that works for any industries not limited to factories, societies, government institutes, and warehouses. A new age contactless way of logging information of visitors, employees, packages, and vehicles. VizMan is a digital logbook so it deters unnecessary use of paper or space since there is no requirement of bundles of registers that is left to collect dust in a corner of a room. Visitor’s essential details, helps in scheduling meetings for visitors and employees, and assists in supervising the attendance of the employees. With VizMan, visitors don’t need to wait for hours in long queues. VizMan handles visitors with the value they deserve because we know time is important to you.
Feasible Features
One Subscription, Four Modules – Admin, Employee, Receptionist, and Gatekeeper ensures confidentiality and prevents data from being manipulated
User Friendly – can be easily used on Android, iOS, and Web Interface
Multiple Accessibility – Log in through any device from any place at any time
One app for all industries – a Visitor Management System that works for any organisation.
Stress-free Sign-up
Visitor is registered and checked-in by the Receptionist
Host gets a notification, where they opt to Approve the meeting
Host notifies the Receptionist of the end of the meeting
Visitor is checked-out by the Receptionist
Host enters notes and remarks of the meeting
Customizable Components
Scheduling Meetings – Host can invite visitors for meetings and also approve, reject and reschedule meetings
Single/Bulk invites – Invitations can be sent individually to a visitor or collectively to many visitors
VIP Visitors – Additional security of data for VIP visitors to avoid misuse of information
Courier Management – Keeps a check on deliveries like commodities being delivered in and out of establishments
Alerts & Notifications – Get notified on SMS, email, and application
Parking Management – Manage availability of parking space
Individual log-in – Every user has their own log-in id
Visitor/Meeting Analytics – Evaluate notes and remarks of the meeting stored in the system
Visitor Management System is a secure and user friendly database manager that records, filters, tracks the visitors to your organization.
"Secure Your Premises with VizMan (VMS) – Get It Now"
Listen to the keynote address and hear about the latest developments from Rachana Ananthakrishnan and Ian Foster who review the updates to the Globus Platform and Service, and the relevance of Globus to the scientific community as an automation platform to accelerate scientific discovery.
Advanced Flow Concepts Every Developer Should KnowPeter Caitens
Tim Combridge from Sensible Giraffe and Salesforce Ben presents some important tips that all developers should know when dealing with Flows in Salesforce.
top nidhi software solution freedownloadvrstrong314
This presentation emphasizes the importance of data security and legal compliance for Nidhi companies in India. It highlights how online Nidhi software solutions, like Vector Nidhi Software, offer advanced features tailored to these needs. Key aspects include encryption, access controls, and audit trails to ensure data security. The software complies with regulatory guidelines from the MCA and RBI and adheres to Nidhi Rules, 2014. With customizable, user-friendly interfaces and real-time features, these Nidhi software solutions enhance efficiency, support growth, and provide exceptional member services. The presentation concludes with contact information for further inquiries.
Check out the webinar slides to learn more about how XfilesPro transforms Salesforce document management by leveraging its world-class applications. For more details, please connect with sales@xfilespro.com
If you want to watch the on-demand webinar, please click here: https://www.xfilespro.com/webinars/salesforce-document-management-2-0-smarter-faster-better/
Exploring Innovations in Data Repository Solutions - Insights from the U.S. G...Globus
The U.S. Geological Survey (USGS) has made substantial investments in meeting evolving scientific, technical, and policy driven demands on storing, managing, and delivering data. As these demands continue to grow in complexity and scale, the USGS must continue to explore innovative solutions to improve its management, curation, sharing, delivering, and preservation approaches for large-scale research data. Supporting these needs, the USGS has partnered with the University of Chicago-Globus to research and develop advanced repository components and workflows leveraging its current investment in Globus. The primary outcome of this partnership includes the development of a prototype enterprise repository, driven by USGS Data Release requirements, through exploration and implementation of the entire suite of the Globus platform offerings, including Globus Flow, Globus Auth, Globus Transfer, and Globus Search. This presentation will provide insights into this research partnership, introduce the unique requirements and challenges being addressed and provide relevant project progress.
Developing Distributed High-performance Computing Capabilities of an Open Sci...Globus
COVID-19 had an unprecedented impact on scientific collaboration. The pandemic and its broad response from the scientific community has forged new relationships among public health practitioners, mathematical modelers, and scientific computing specialists, while revealing critical gaps in exploiting advanced computing systems to support urgent decision making. Informed by our team’s work in applying high-performance computing in support of public health decision makers during the COVID-19 pandemic, we present how Globus technologies are enabling the development of an open science platform for robust epidemic analysis, with the goal of collaborative, secure, distributed, on-demand, and fast time-to-solution analyses to support public health.
TROUBLESHOOTING 9 TYPES OF OUTOFMEMORYERRORTier1 app
Even though at surface level ‘java.lang.OutOfMemoryError’ appears as one single error; underlyingly there are 9 types of OutOfMemoryError. Each type of OutOfMemoryError has different causes, diagnosis approaches and solutions. This session equips you with the knowledge, tools, and techniques needed to troubleshoot and conquer OutOfMemoryError in all its forms, ensuring smoother, more efficient Java applications.
6. Methods Quantitative Qualitative
Data Type
Structured Data
close-ended answers collected
Unstructured data
Open-ended text or free-form responses
Analysis
Statistical Analysis Summary of overall responses
Research
Conclusions
Objective Conclusions
Unbiased results & statements
Subjective Conclusions
Influenced by opinions
Methods
Surveys & Research Experiments
Computational techniques
Focus Groups, Discussions, Observations
7. Quantitative Best Practices
Method Focus Sample Size
Survey Research
Most fundamental tool for all
quantitative outcome research
methodologies and studies
Varies
Correlational research
Conducted to establish a relationship
between two closely-knit entities and
how one impacts the other
2 sample groups minimum
Causal-comparative research
Used by researchers to conclude the
cause-effect equation between two or
more variables
20 to 60
Experimental research Based on theories Varies
8. Quantitative Sampling Methods
Probability sampling method
Simple random sampling
Implemented where the target population is
considerably large
Stratified random sampling
A large population is divided into groups (strata),
and members of a sample are chosen randomly
Cluster sampling
A probability sampling method usually using
geographic and demographic segmentation
parameters
Systematic sampling
The starting point of the sample is chosen
randomly, and all the other elements are chosen
using a fixed interval
9. Quantitative Sampling Methods
Non-Probability sampling method
Convenience sampling
Elements of a sample are chosen only due to one
prime reason: their proximity to the researcher
Consecutive sampling
Researchers choose a single element or a group
of samples and conduct research consecutively
over a significant period
Quota sampling
Researchers select elements using their
knowledge of target traits and personalities to
form strata
Snowball sampling
Conducted with target audiences, which are
difficult to contact and get information
Judgmental sampling
Samples are created only based on the
researcher’s experience and skill
10. Why Do Qualitative Research?
Humanize The numbers
Context is everything!
● Paint the story
Qualitative responses helps tell the story of the
specific project
● Empowers Key Stakeholders To Make
Quicker Business Decisions
Are they passionate and excited to strategize
next steps? Qualitative helps build excitement
around insights collected
11. Qualitative Best Practices
Method Focus Sample Size Data Collection
Ethnography Context or culture Varies Observation & interviews
Narrative
Individual experience &
sequence
1 to 2
Stories from individuals &
documents
Phenomenological
People who have
experienced a
phenomenon
5 to 25 Interviews
Grounded Theory
Develop a theory from
grounded in field data
20 to 60
Interviews, then open and axial
coding
Case Study
Organization, entity,
individual, or event
Varies
Interviews, documents, reports,
observations
13. Mobile Qualitative Research Options
Capture Respondents In
The Moment
● Geo-location
triggered
● Push Notifications
● Real-Time
Responses
Discussions, Topics, & Idea
Board makes collecting
Qualitative Insights Easy
● Administer questions,
topics, and discussions
● Capture people where
they are for live
discussions and more.
Cohesive Communities
Experience
● Simple UX UI Experience for
members
● Members can easily bounce
between online or mobile
platforms
● Make sure there’s enough
memory on devices
19. Heatmap Analysis
● Graphical representation of where/what on an image that individuals value - represented as colors
● Reflects what members like / dislike / gets their attention / etc.
● Exercise done either through drag & drop -OR- in clicks
20. When To Use Heatmaps For Research
● Gathering feedback on a web design
● Concept testing - different designs -or- products
● To further breakdown the “why”
21. Advantages Of Heatmaps
● Saves time & resources converting qualitative into quantitative
● Deeper insights
22. Three Types Of Heatmap Analysis
Attention Maps - reveals which parts of an image gets the most attention
23. Three Types Of Heatmap Analysis
Scroll Maps - could be used to highlight
● Which parts of the page / image visitors view the most
● How much area is visible on page without scrolling
● How far people scroll before content is irrelevant
24. Three Types Of Heatmap Analysis
Click Maps - reveals areas on the image that would get the most clicks
26. HotSpot Image Testing
● Involves showing an image with predefined areas/sections within the image that
respondents can like, dislike, etc.
● For when you want direct feedback on specific images you want evaluated
27. When To Use HotSpot Testing For Research
● Concept testing for products
● Usability testing
● Feedback surveys
28. Advantages of HotSpot
● Quick feedback
● Straightforward/exact insights
● Another fun exercise for your respondents!
31. What is Card Sorting?
Card sorting is a highly interactive question type that
respondents use to sort answer options into specific buckets
which helps to conduct user research. Answers rank from the
least to the most crucial answer options. These questions are
highly engaging and require a more in-depth level interaction
with the survey, which means they are preferred to question
types that use radio buttons, single select, etc.
32. Use Case
I am a brand that wants to derive consumer insights from an
audience about features that they want to categorize or bucket into
predetermined segments, I can use the card sorting question type
that is highly engaging.
I also want that information that is in buckets to be ranked from
most to least important to get macro and micro level insights into a
person’s decision making.
I can make product or service tweaks on the basis of the decision
making of an audience. I can even price depending on importance of
different vectors.
33. Card Sorting Question Type
Card Sorting allows the respondent to group items into two or more
categories, and simultaneously rank the items within those groups.
● Closed-card sorting: Predefined card categories for respondents
to use from. This question type is generally used when the
audience are promoters of the brand so the data collection is
from a mature audience.
● Open-card sorting: Users can define their own buckets. This
question type is generally used when the audience know the
brand but aren’t necessarily brand promoters.
35. Closed Card Sorting Analysis
We offer an industry first, 4 types of viewing the data -
clustered bar chart, clustered column chart, stacked
bar chart, and stacked column chart. Look at data in a
way that works the best for your brand. You can also
view this data in a table representation to easily make
sense of its multiple categorizations. Each line item in
the answer is easily viewed under an easy to read
tabular format into the answer selections. This also
shows the average rank for each answer option.
37. Open Card Sorting Analysis
We offer a tabular heatmap that no one else in the industry offers. This
heatmap shows a percentage breakdown of categorization for each answer
option. For repeat answer options, we also provide predictive answer options
when respondents bucket options under a previously selected answer option.
This provides the ability to get a collective response from respondents.
The heatmap offers a snapshot view of each time an answer option was put
into a certain bucket by a respondent. The tabular view represents this same
data into a format that is just numerical but also easy to read. This also
displays the average rank for each answer option under each bucket.
41. Many of our existing community customers have been
talking about how even though they are on lockdown,
they would like their insights collection to go on.
An online community is now one of the most powerful
methods and widely used methods to conduct
research. The ability to conduct video discussions
elevates the ability to manage online qualitative
research for our customers and researchers.
Why do we need Video Discussions?
42. ● Use smart filters to enroll the most
relevant community members
● Community administrator and
researcher can
plan, schedule, and efficiently
conduct live discussions
● Replicate offline focus groups’
models from the comfort of your
online community.
How do we host Video Discussions at QuestionPro?
43. Features of Video Discussions
● Seamlessly invite participants
● Moderator view with controls
● Live transcription
○ Natural Language Processing (NLP)
○ Real-time flagging
○ Auto-categorization
● Backroom chat functionality
● Incentive management
45. What is LiveCast?
LiveCast is a brand new question type introduced
by QuestionPro which will help you to collect real
time video feedback.
Once the videos are submitted QuestionPro uses
machine learning and natural language processing
to identify the underlying emotions within each
individual videos and generate comprehensive
reports
46. Today customers prefer to submit their feedback via videos rather than other conventional mediums.
People are constantly sharing video feedback via social media and other channels.
However, researchers avoid collecting feedback via videos as it is tedious to record videos and even more
complicated to analyze. It involves days of manual work to go through each video and come up with themes
and add annotations by hand.
Using the LiveCast technology, you can not only automate this process, but also uncover sentiments for
different themes across hours of video feedback in one go.
Why is LiveCast required?
47. Collect video feedback
Send out the survey to your
customers and they will send their
feedback by recording a video
49. Analyse video data
Extraction of themes
from all video responses.
See how respondents are
discussing each theme.
Percentage breakdown of
sentiment for each
theme.
View individual video
responsesSummery
50. Analyse video data
Individual video responses
Transcript for the video.
Color overlay on each
sentence indicating
sentiment
Themes / tags for
individual video
Annotations
View next
response
Overall
sentiment
Sentiment across
the video