Downloaded 46 times


The document provides an overview of user research, emphasizing its significance in understanding user behaviors, needs, and motivations through various methodologies, both quantitative and qualitative. It highlights the importance of adhering to the Digital Service Standard which mandates in-depth user understanding and continuous feedback for improving public-facing digital services. Additionally, it discusses different research methodologies, how to analyze data, and the importance of aligning user insights with business objectives.
An overview of user research importance, methodologies, and agenda of the presentation.
Defining user research, its significance per Digital Service Standard, and ongoing research requirements.
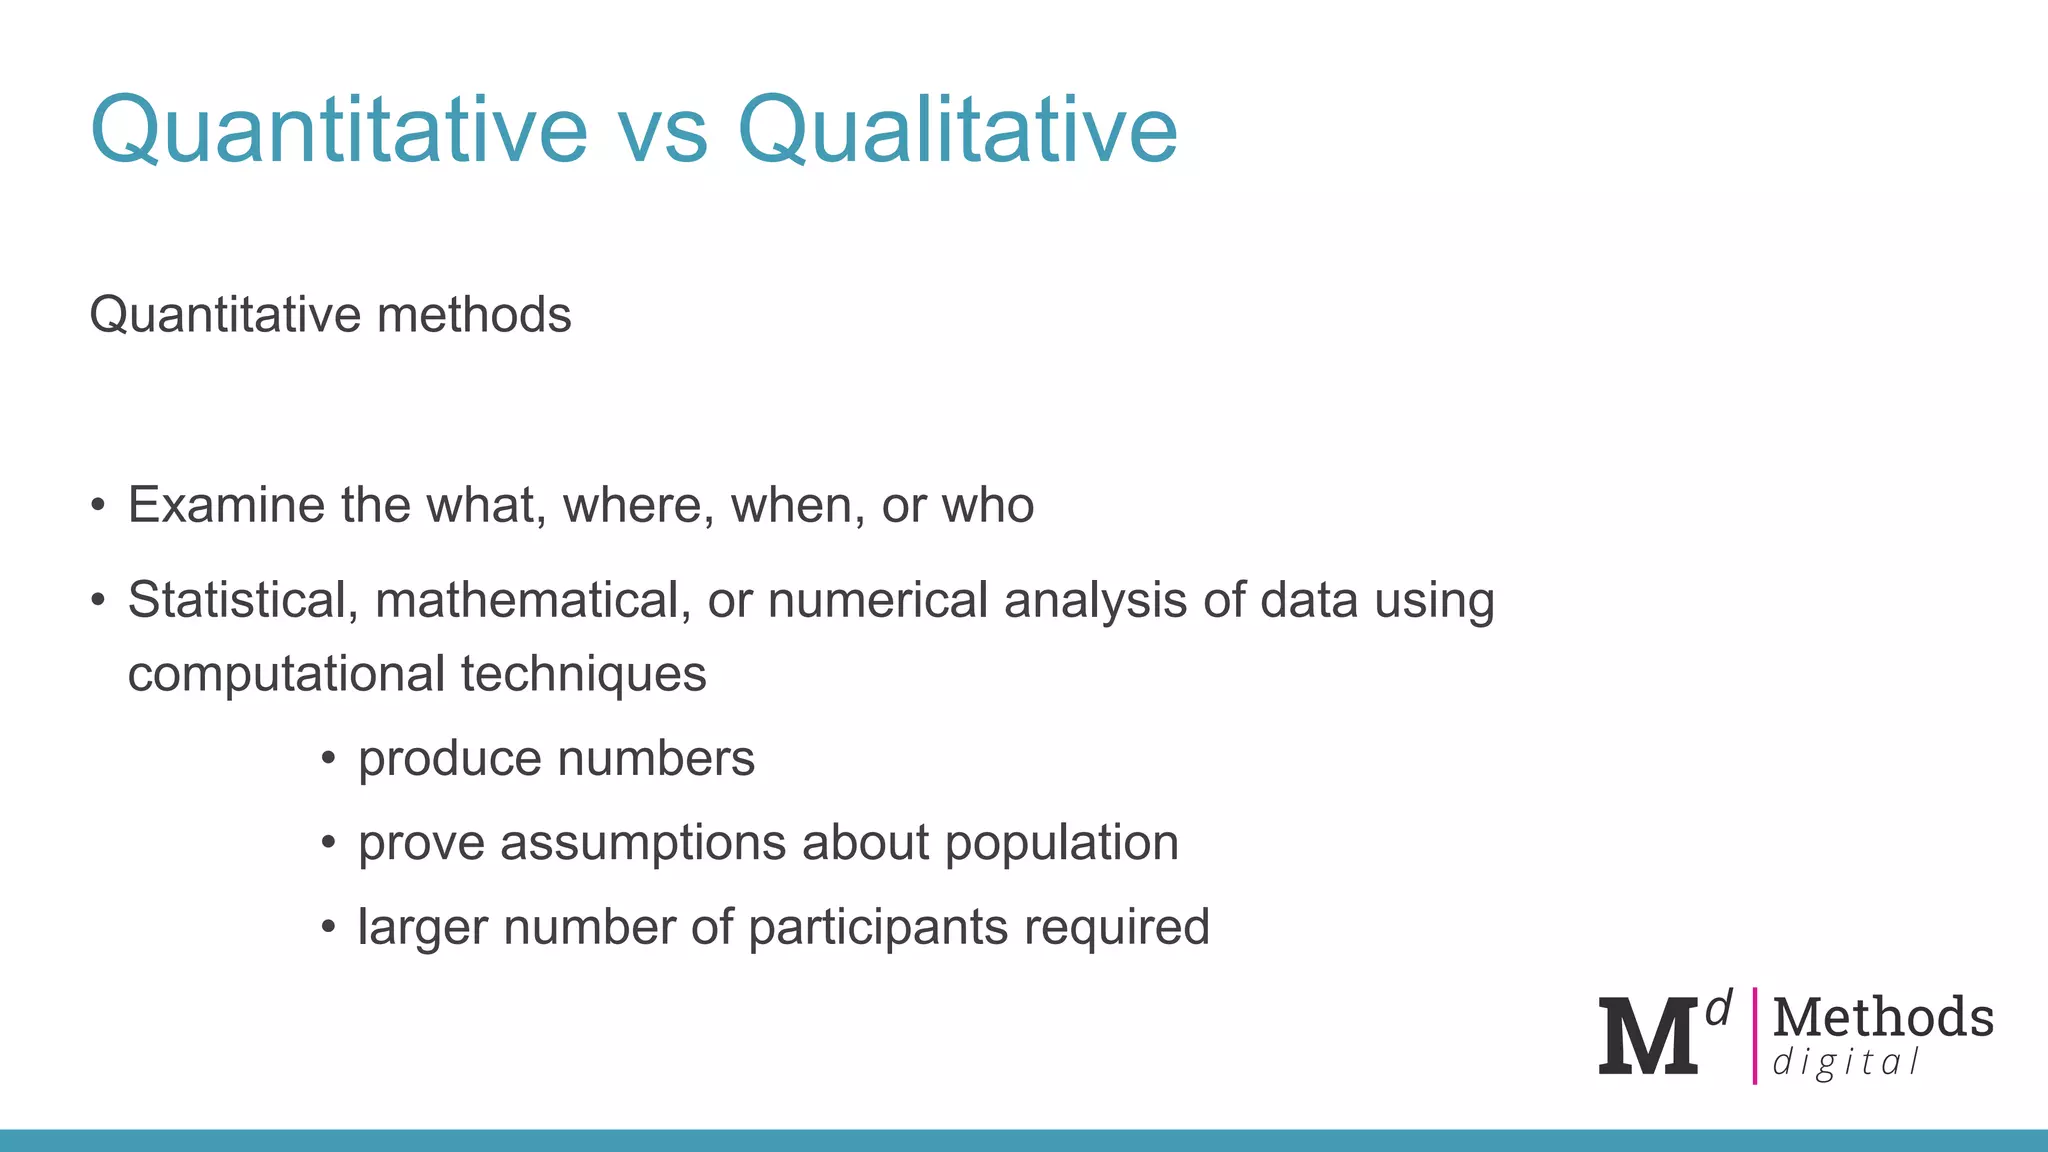
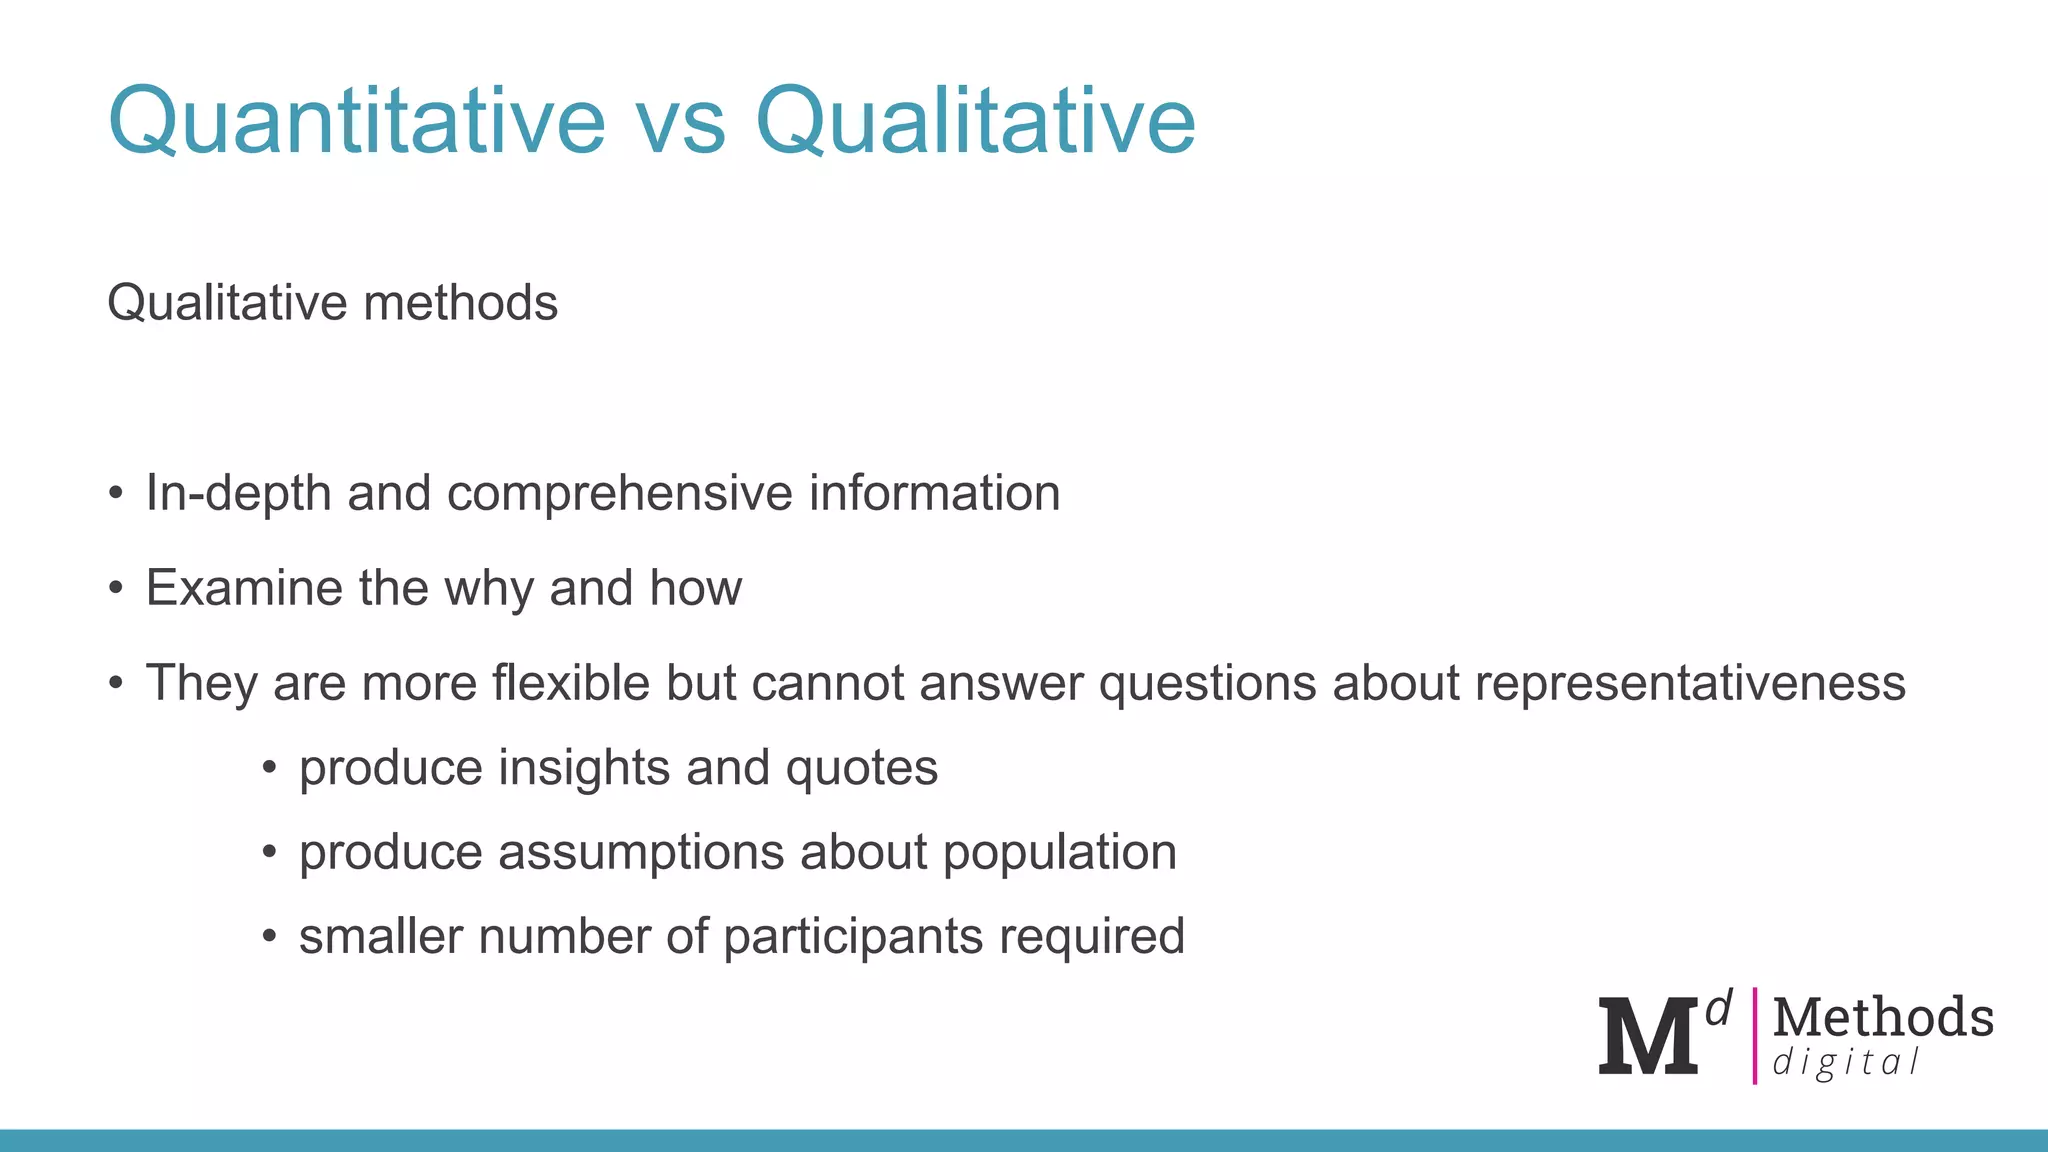
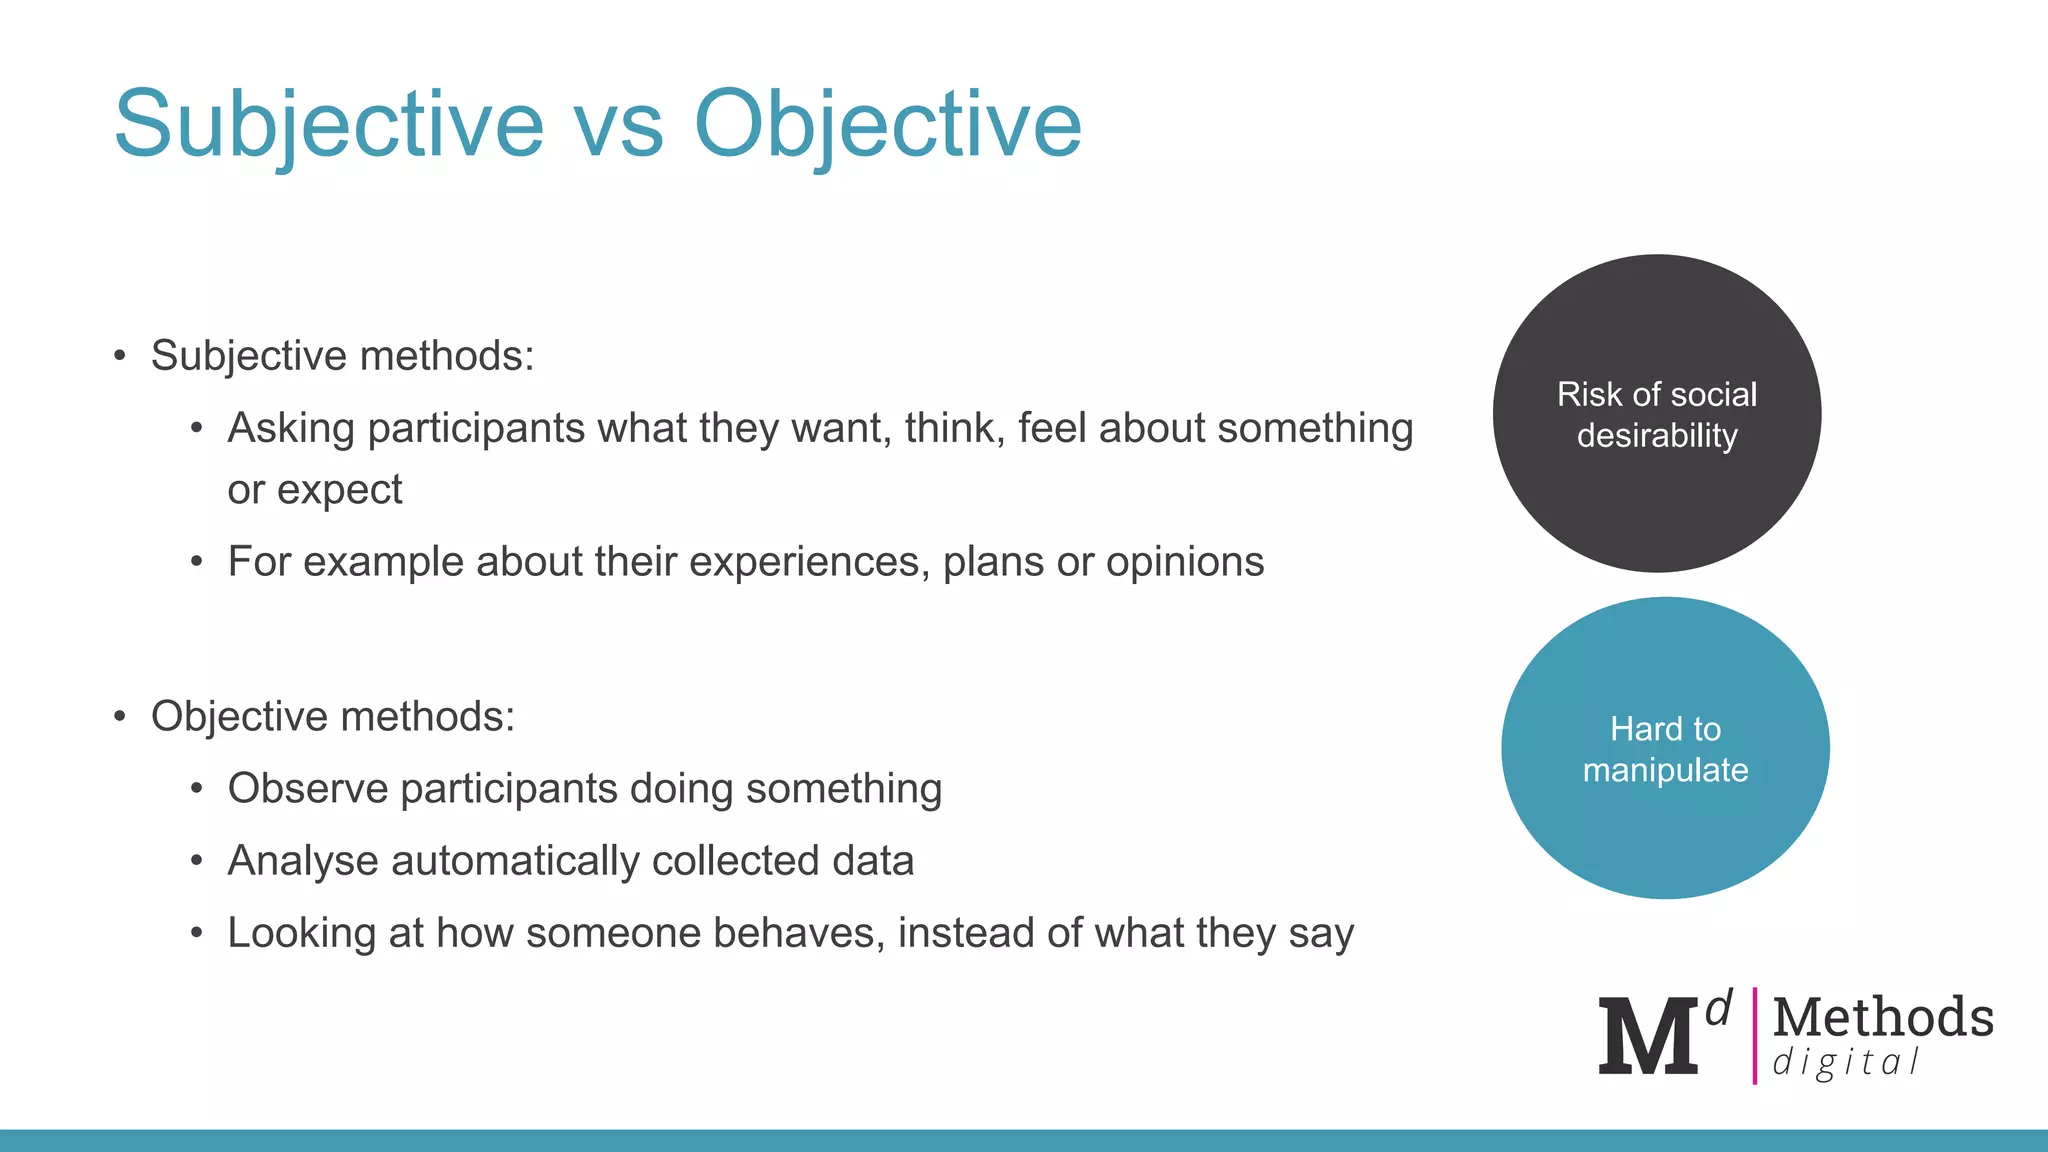
Discussion on qualitative vs quantitative methods, noting their differences and objectives.
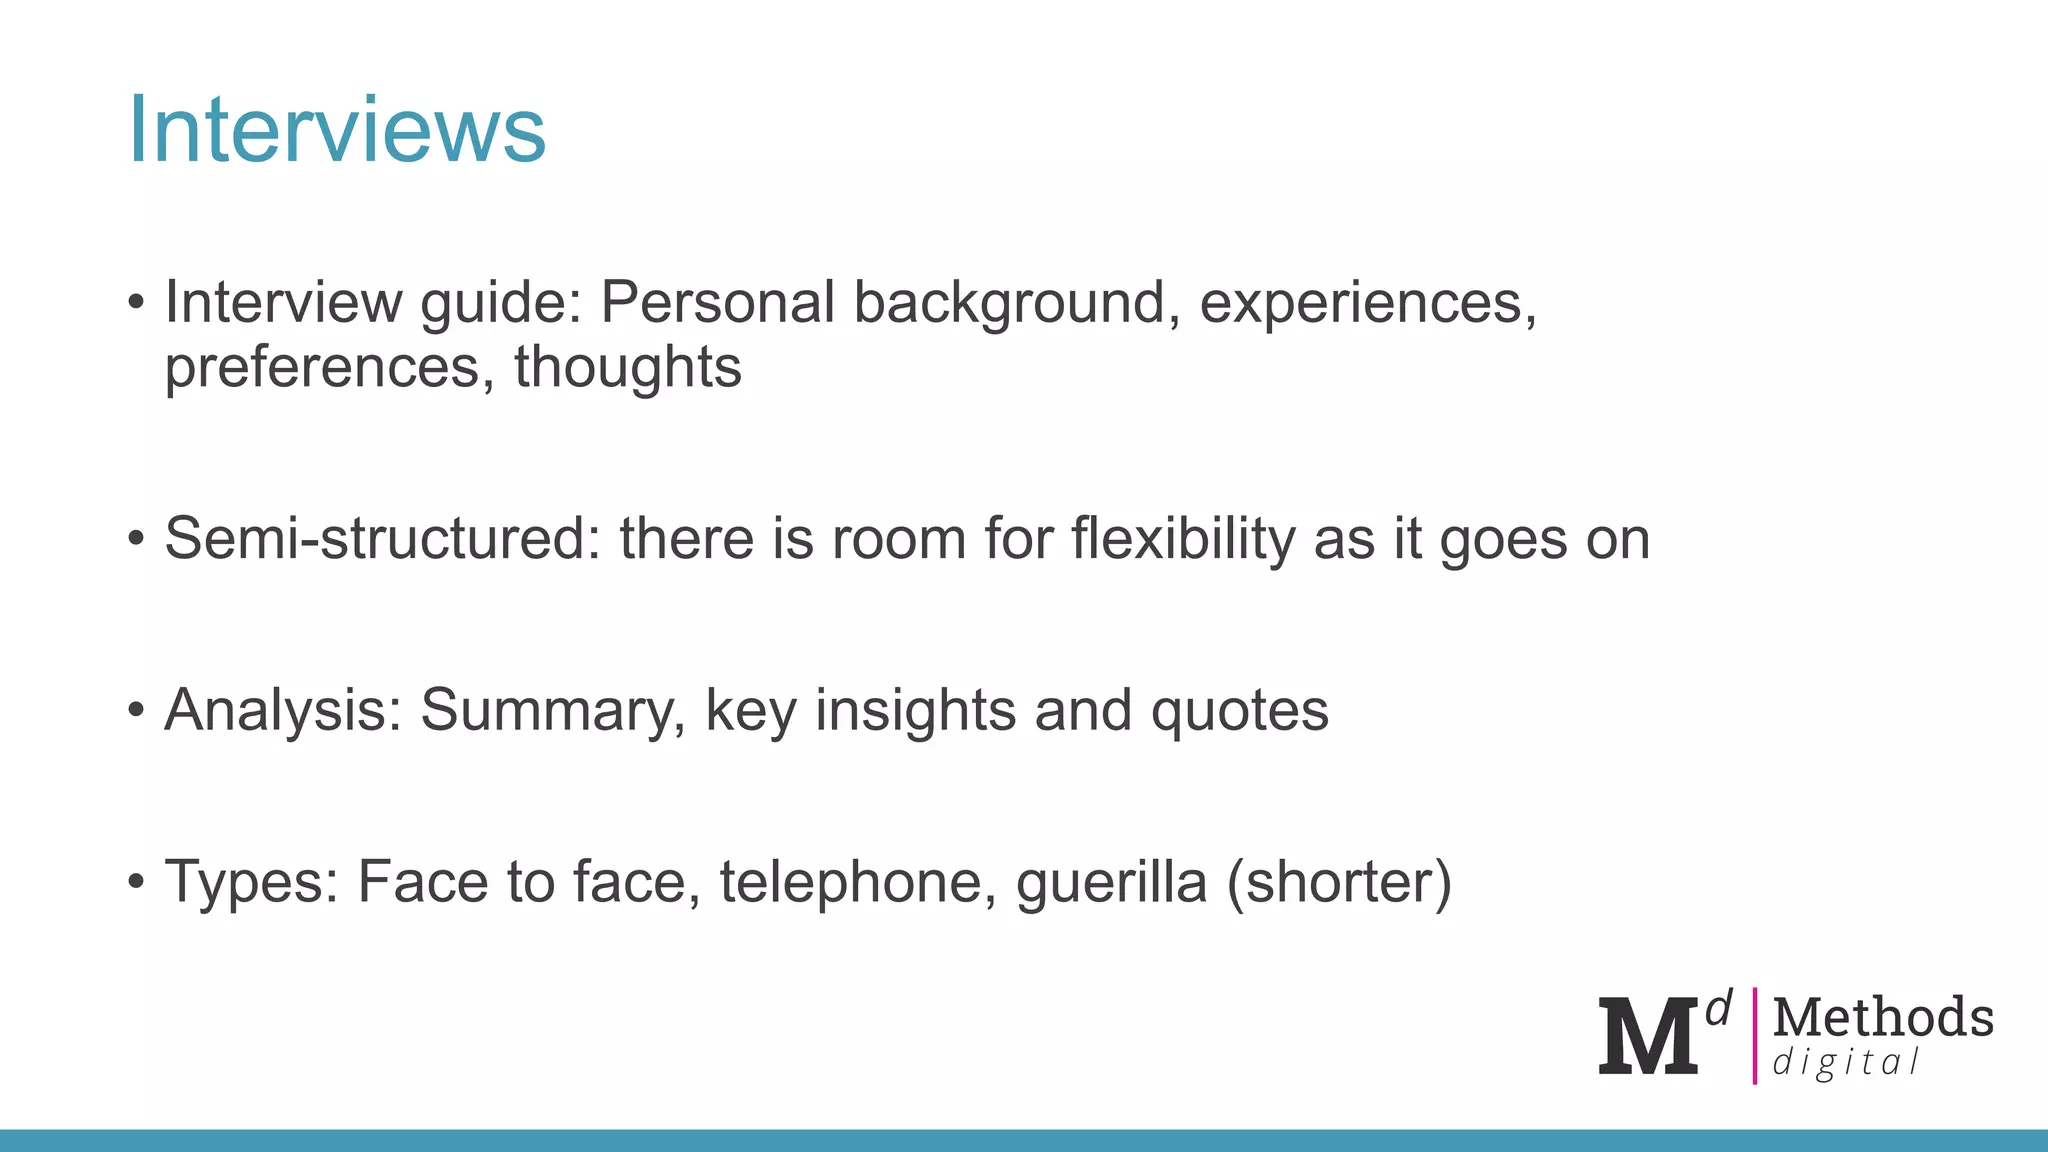
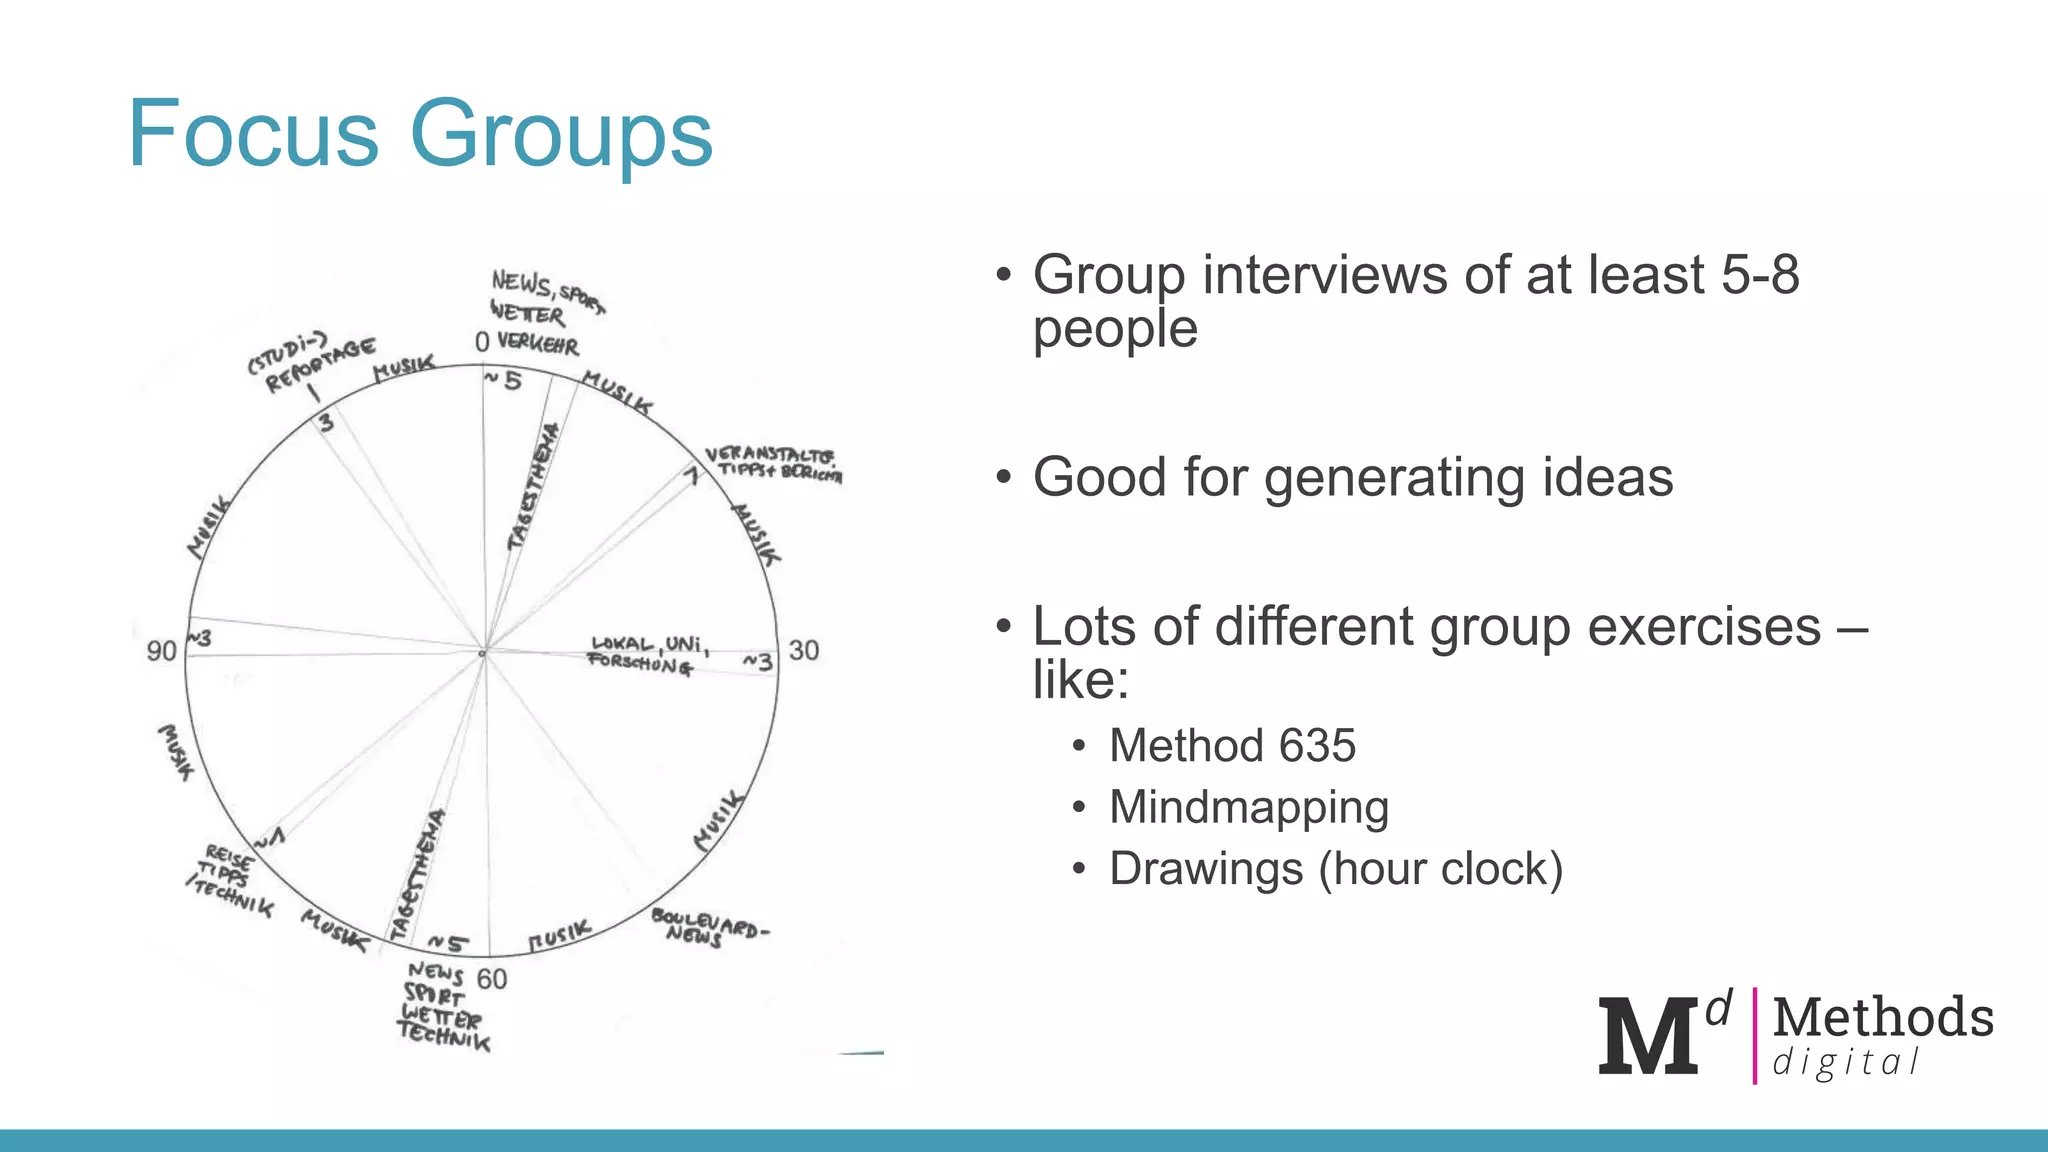
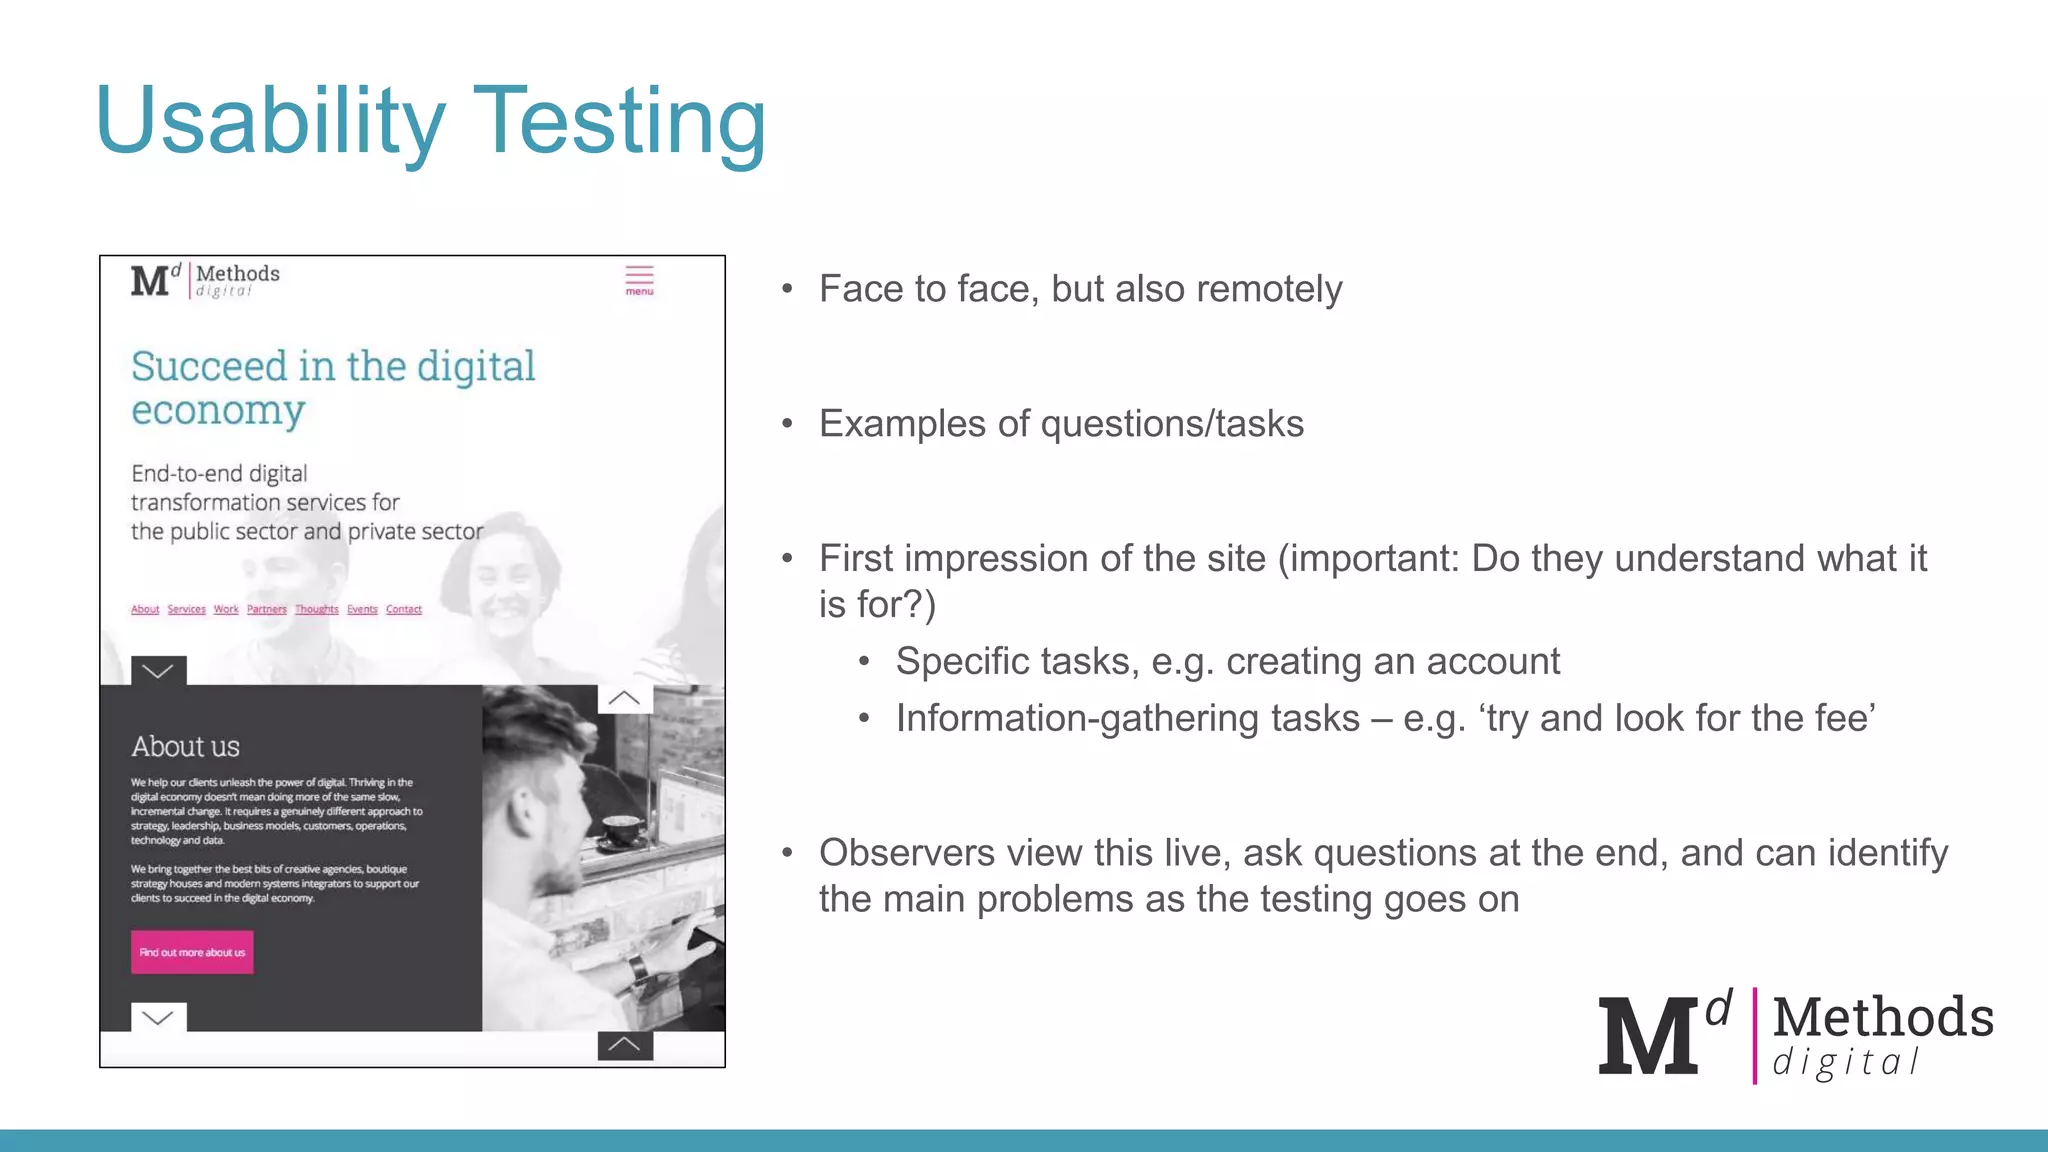
Examples of qualitative approaches such as interviews, focus groups, and usability testing.
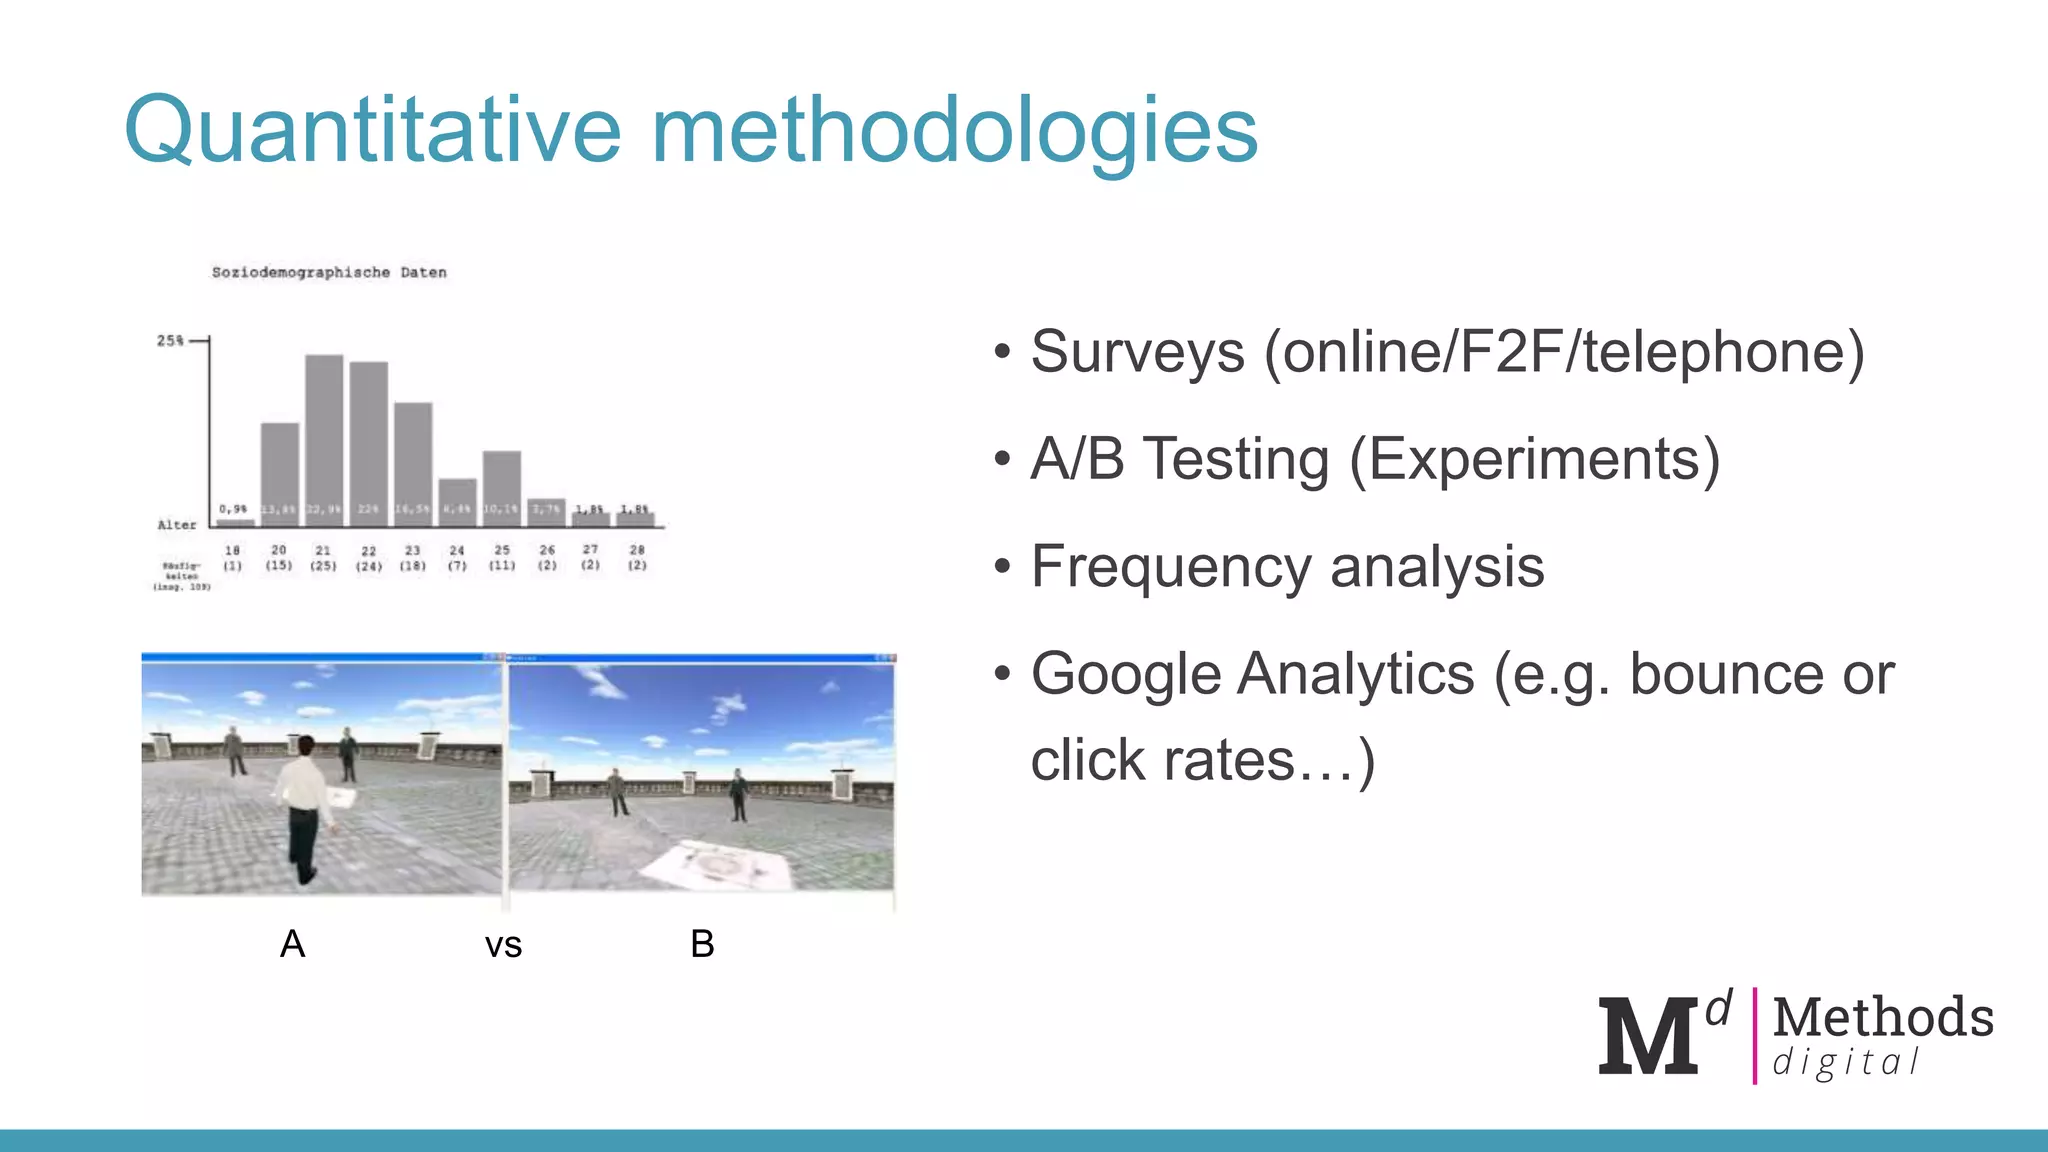
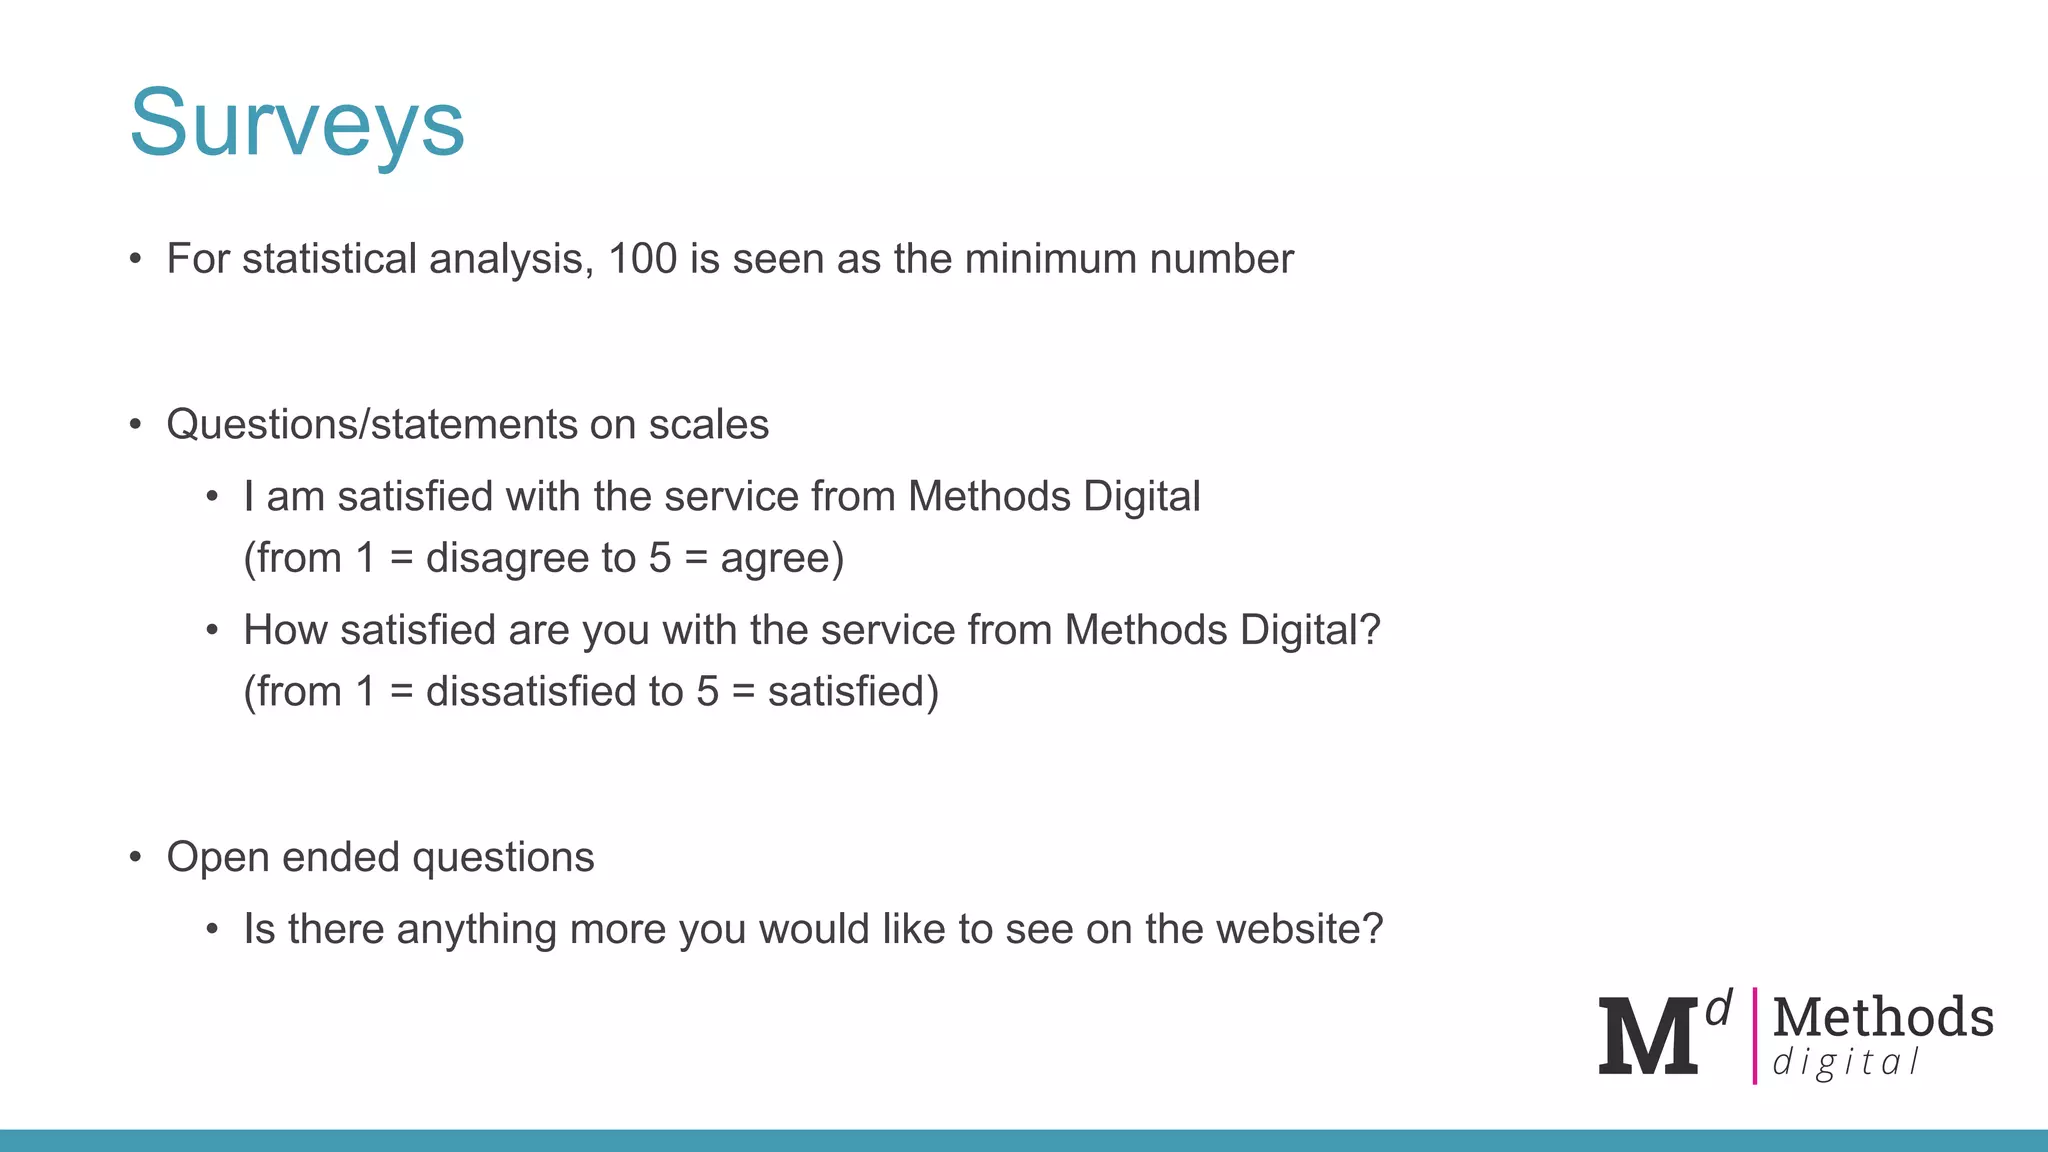
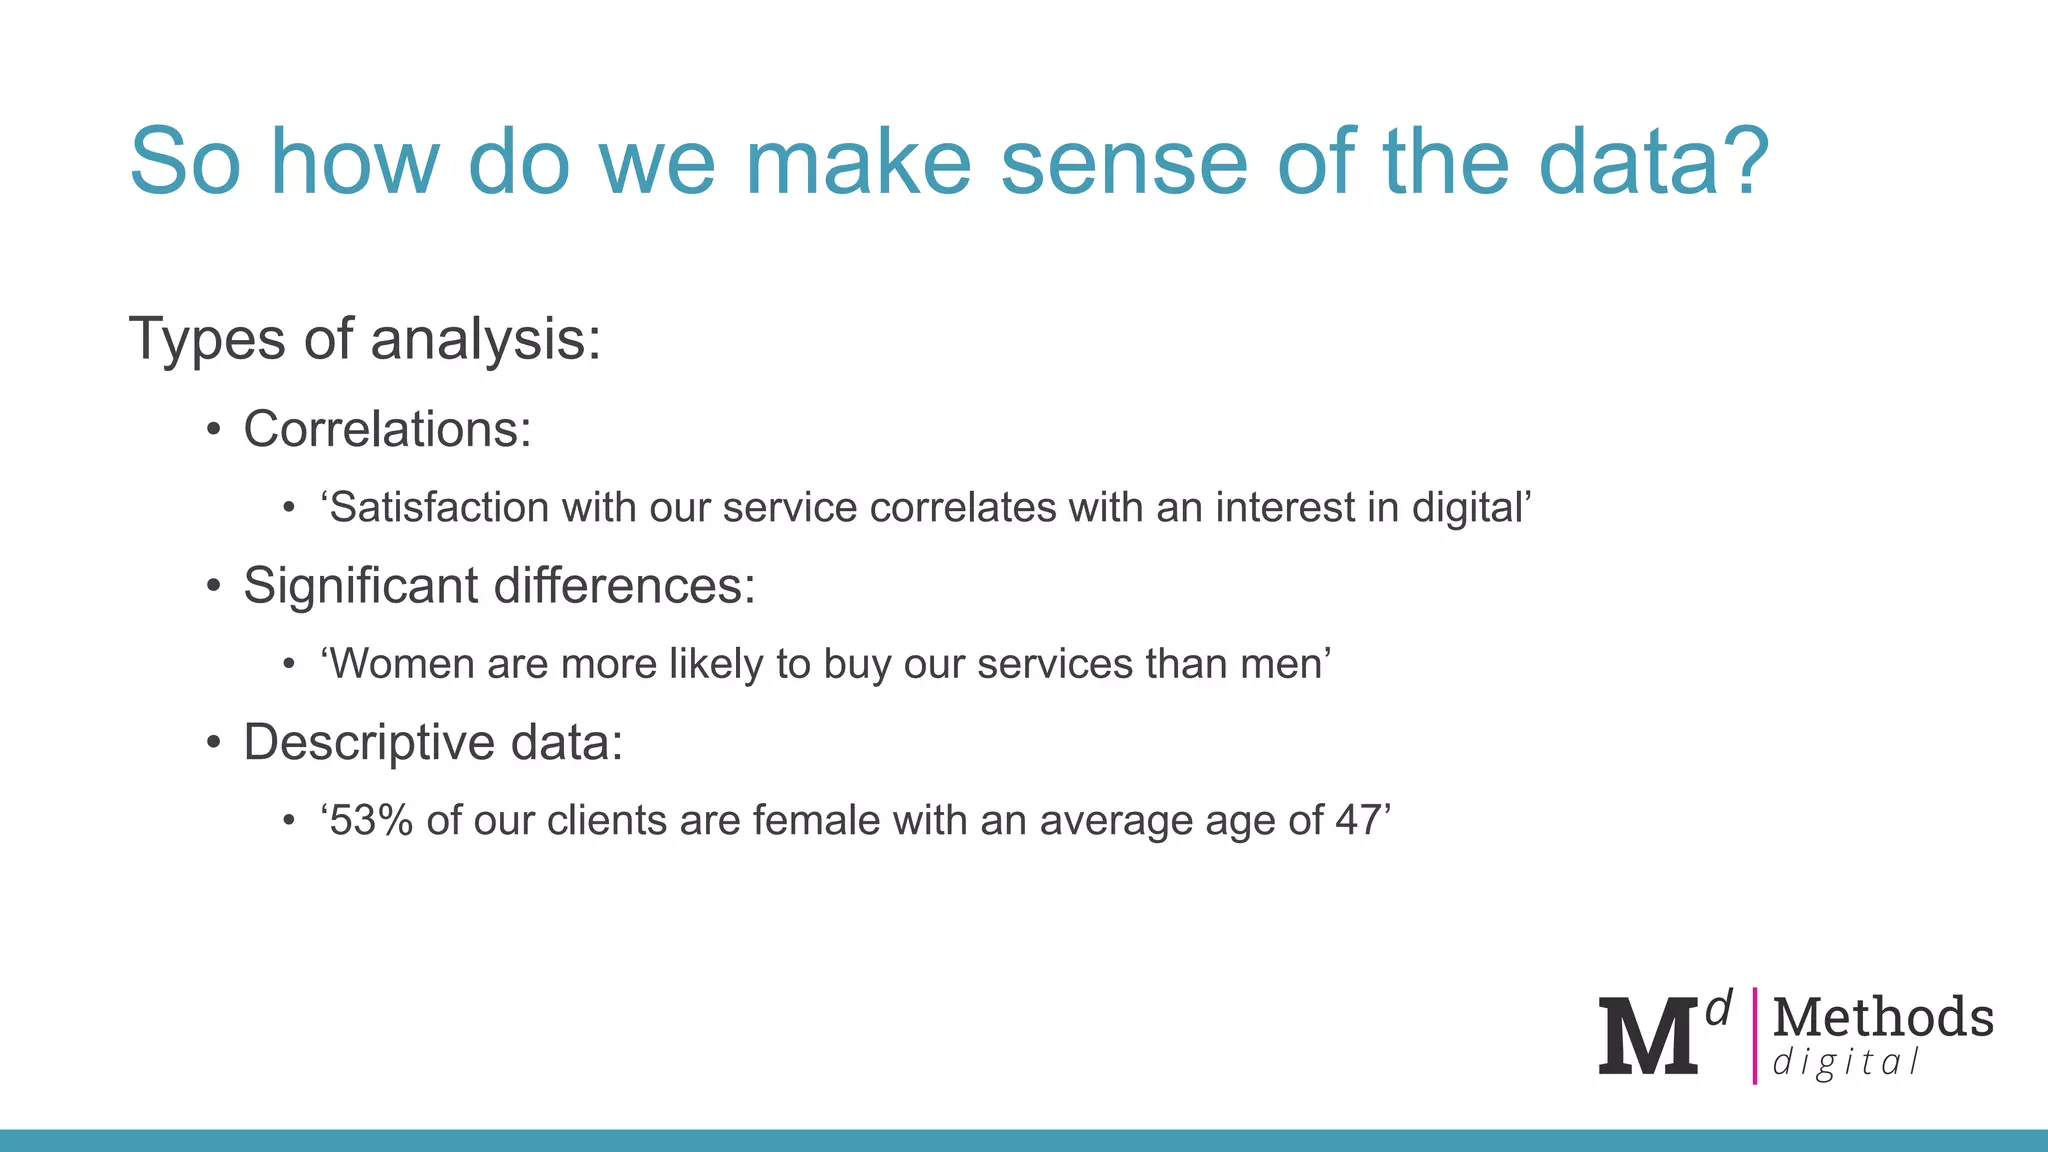
Explanation of quantitative methods like surveys and their analytical insights, emphasizing data reliability.
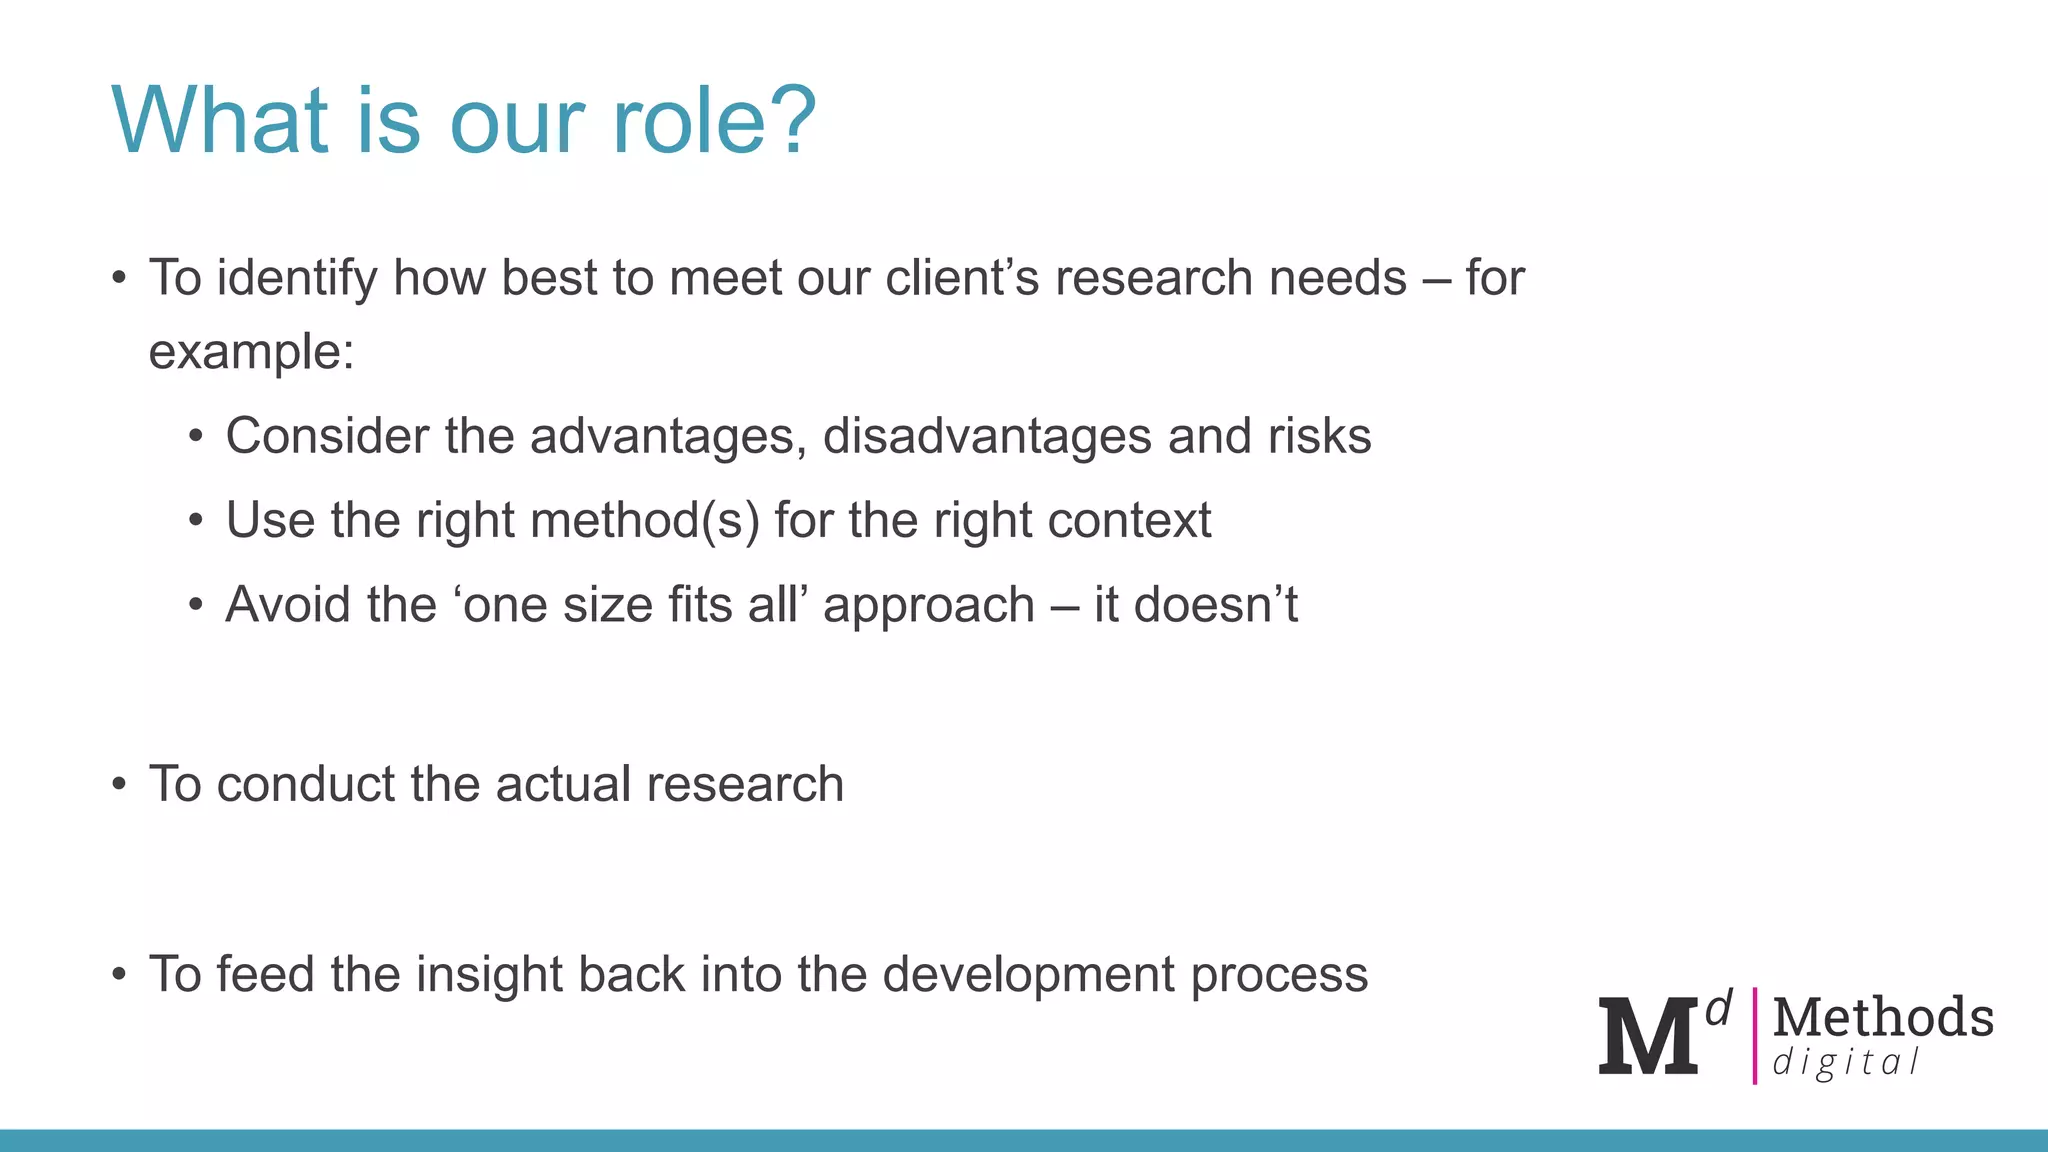
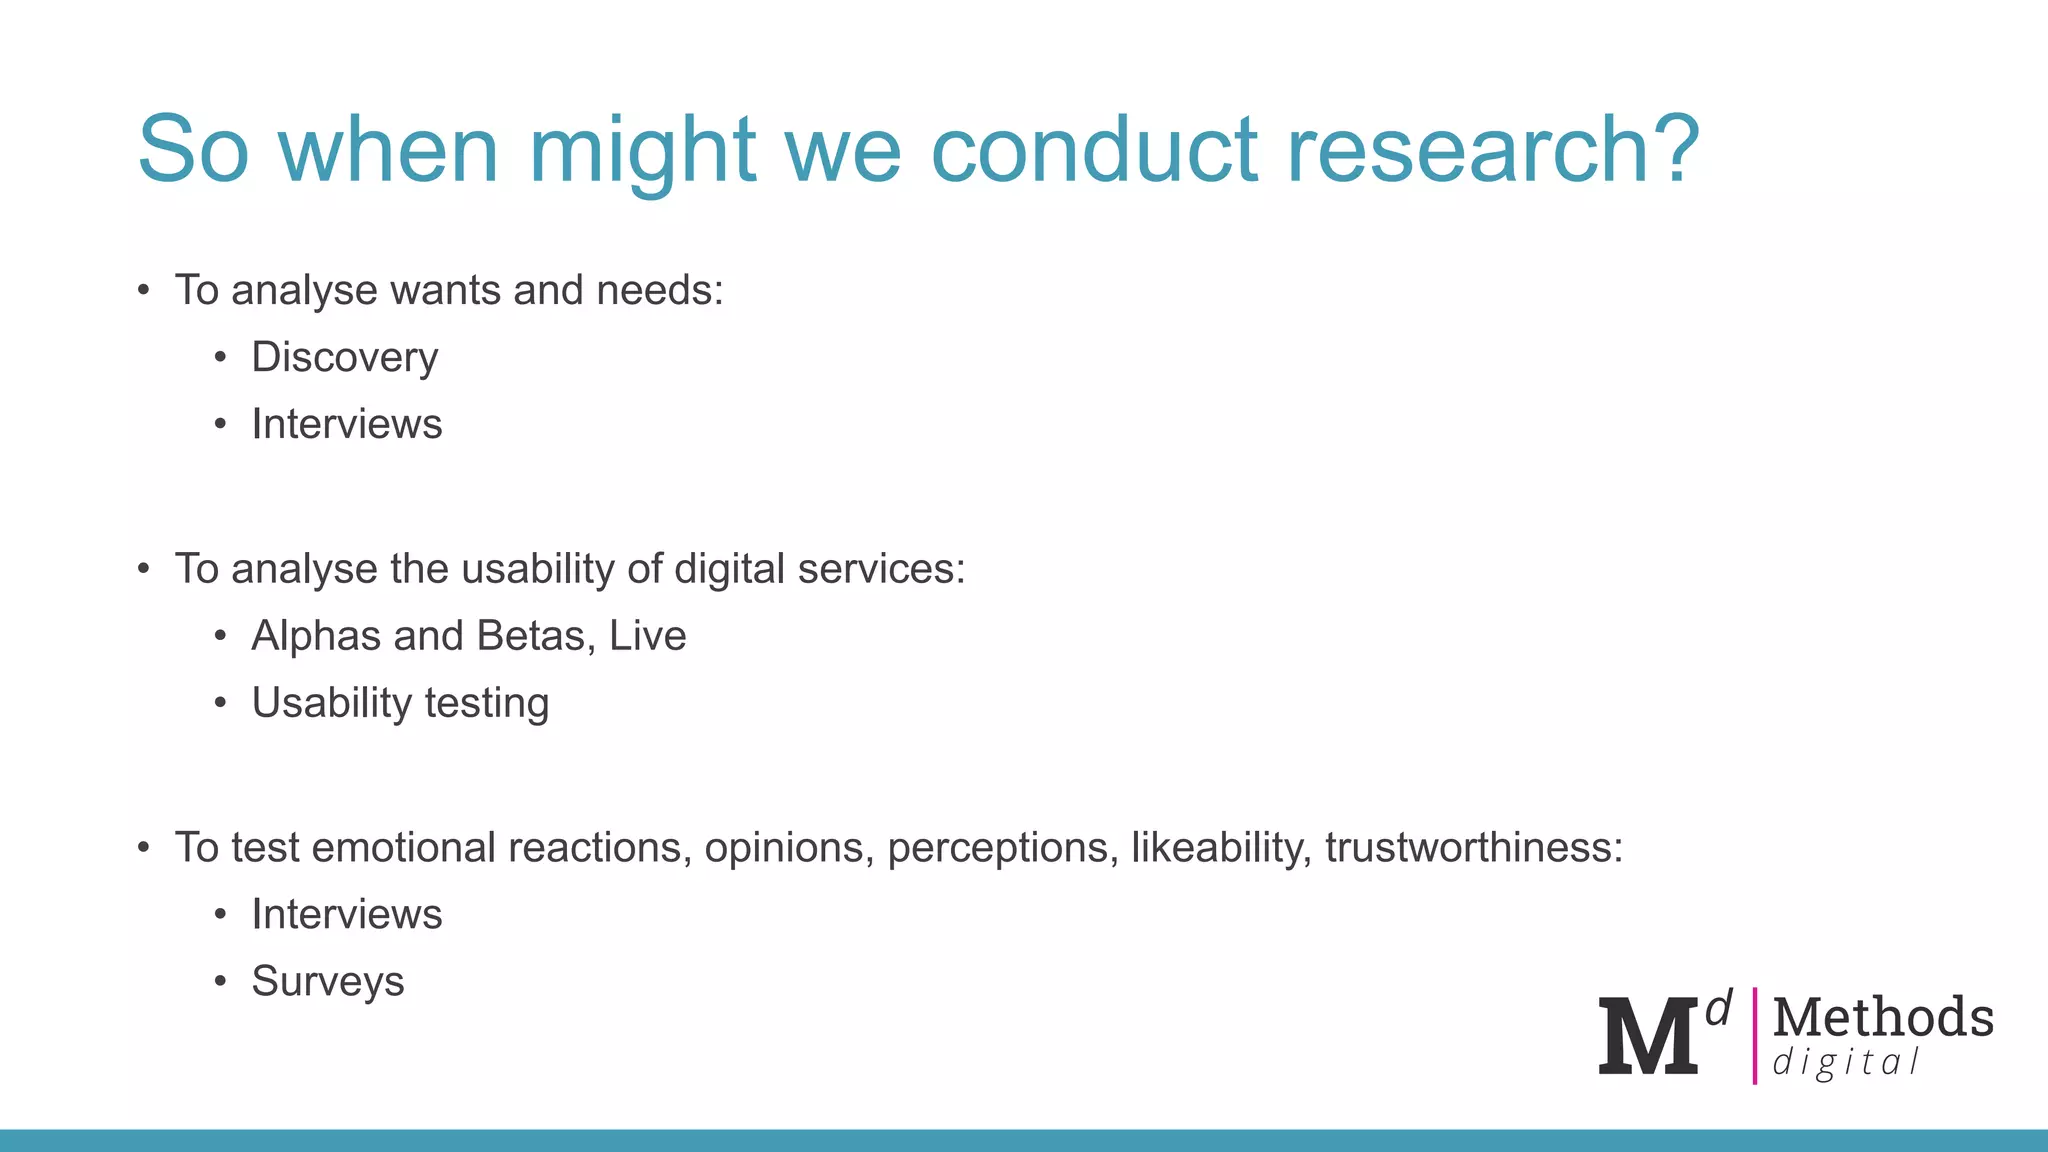
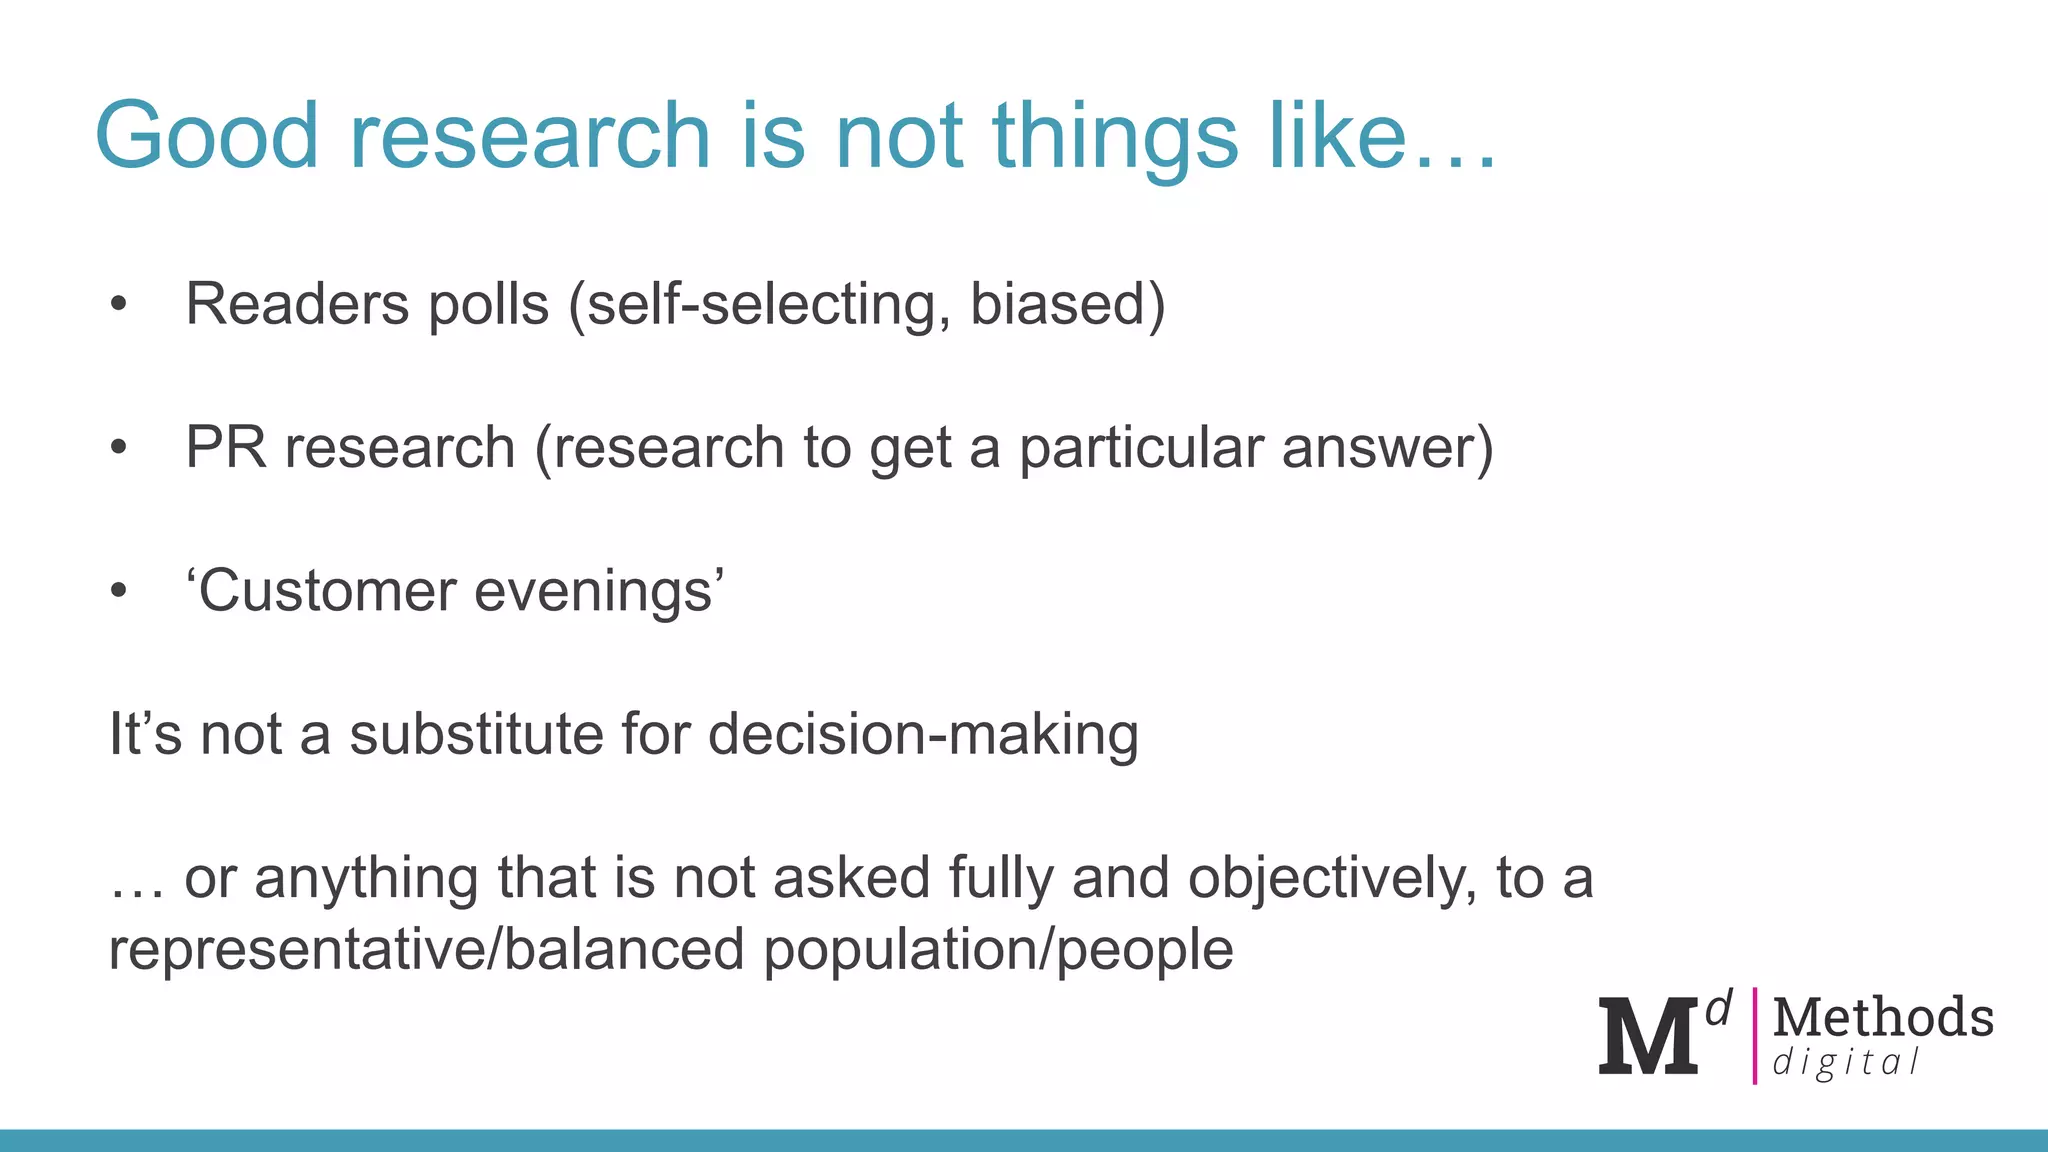
Situations for conducting research, highlighting how to avoid poor research methods.
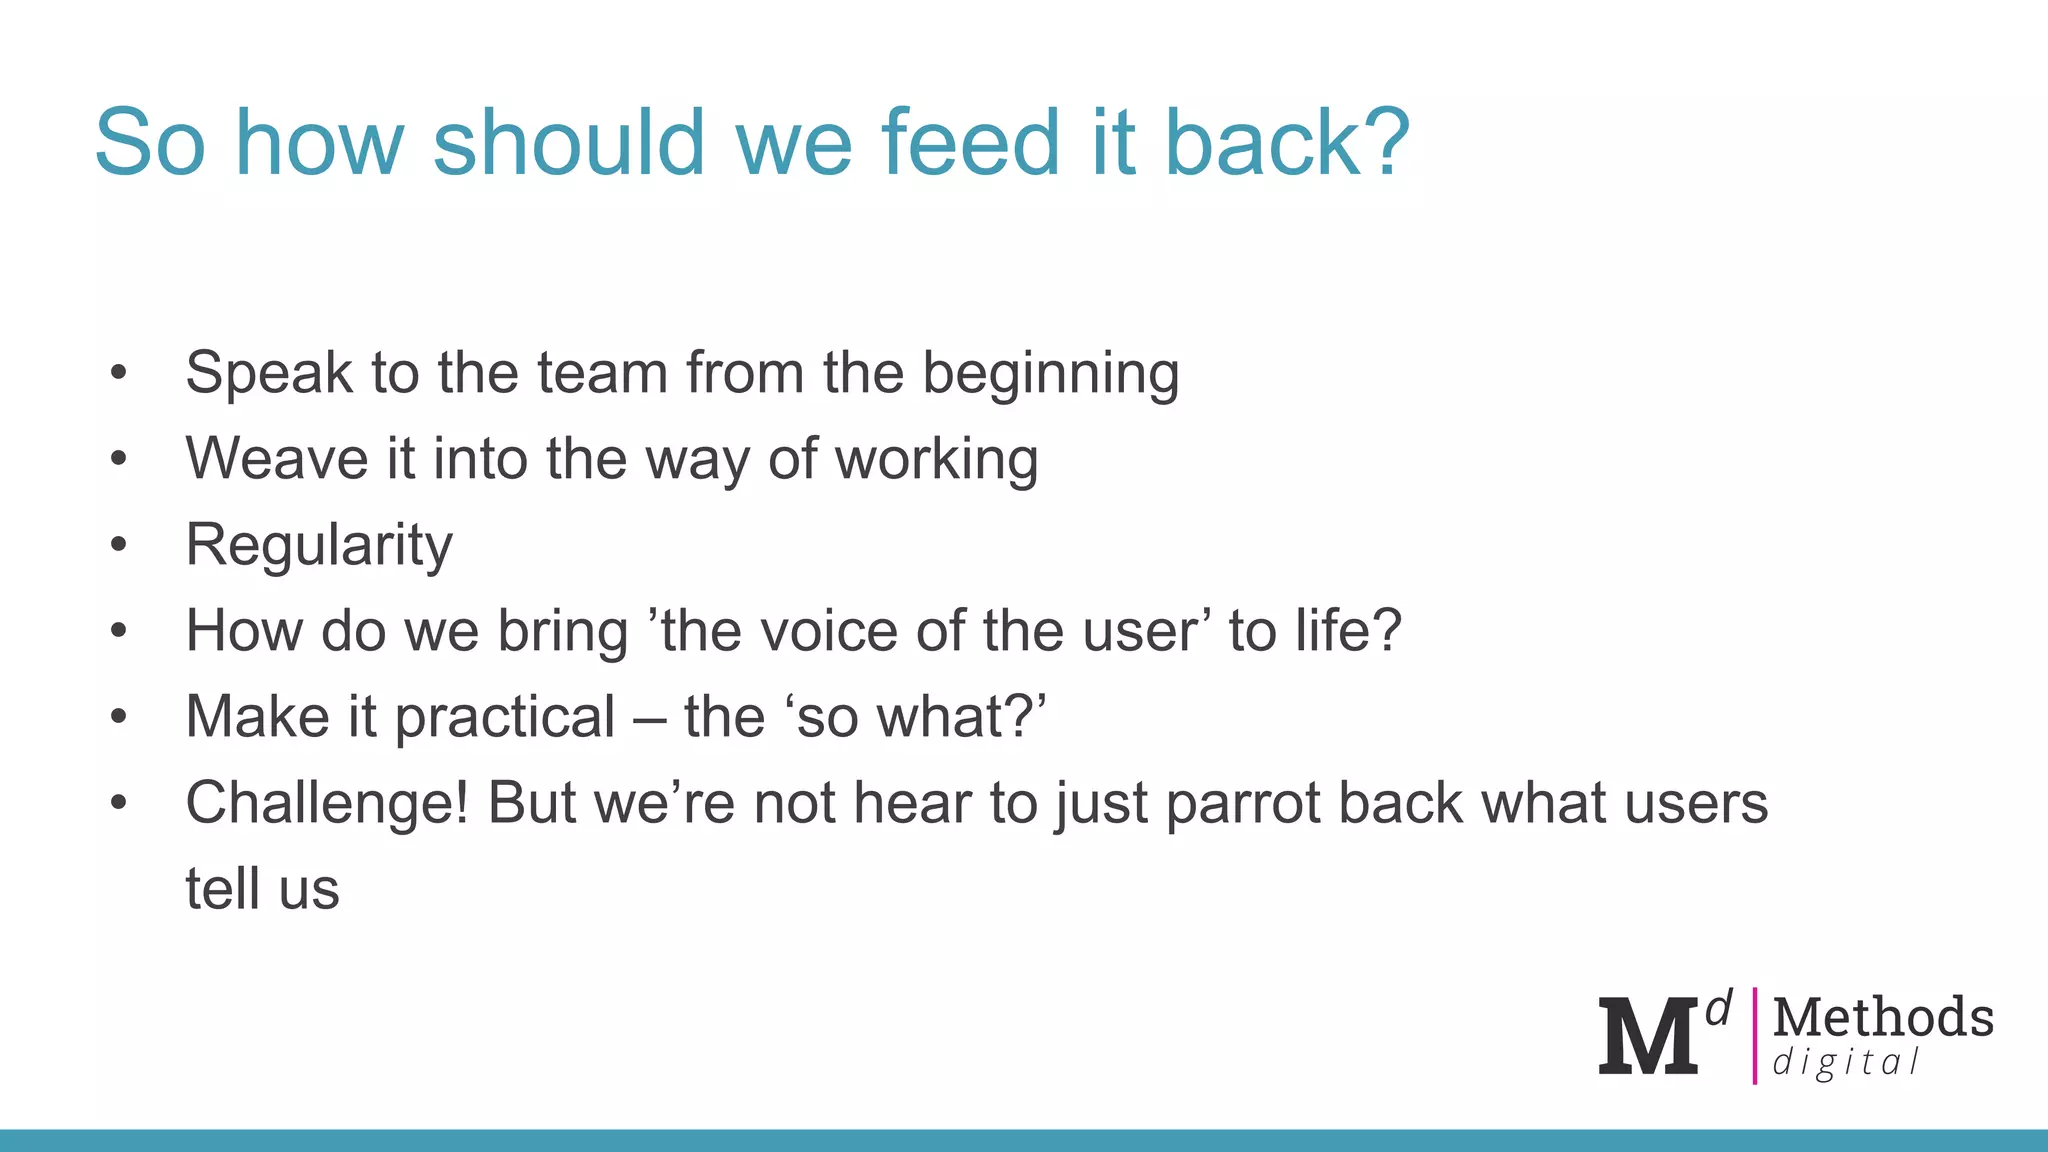
Strategies for presenting research findings effectively, integrating user insights into development.
Acknowledgment and thanks to the audience for their participation in the presentation.


![[UX Series] 1 - UX Introduction](https://cdn.slidesharecdn.com/ss_thumbnails/uxintroduction-150804131237-lva1-app6891-thumbnail.jpg?width=640&height=640&fit=bounds)


