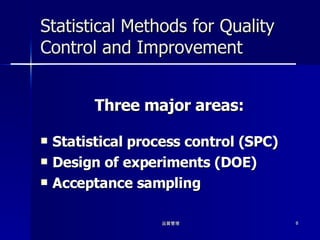
Statistical Methods forQuality Control and Improvement Three major areas: Statistical process control (SPC) Design of experiments (DOE) Acceptance sampling
9.
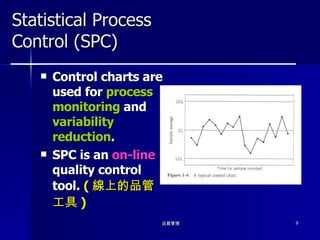
Statistical Process Control(SPC) Control charts are used for process monitoring and variability reduction . SPC is an on-line quality control tool. ( 線上的品管工具 )
10.
Design of ExperimentsExperimental design is an approach to systematically varying the controllable input factors in the process and determine the effect these factors have on the output responses . Experimental designs are off-line quality tools .( 線外的品管工具 ) Crucial for variability reduction.
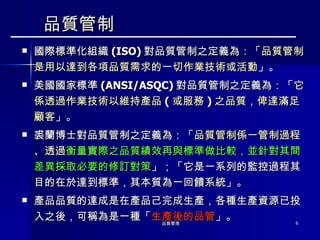
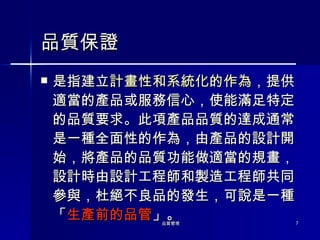
Legal Aspects ofQuality — Consumerism The explosion in the number of products . Consumer tolerance for minor defects and aesthetic problems has decreased considerably .
Legal Aspects ofQuality — Product Liability The legal obligation of manufacturers and sellers to compensate for injury or damage caused by defective products.
Principles of StrictLiability A strong responsibility for both manufacturer and merchandiser , requiring immediate responsiveness to unsatisfactory quality through product service , repair , or replacement of defective product. All advertising statements must be supportable by valid company quality of certification data .
25.
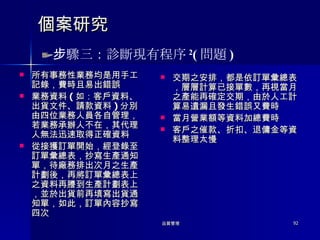
問題 貨物出門概不退換 vs. 一個星期鑑賞期… 車廠宣稱:「汽車售出後若經改裝,本公司不負保固責任… 」
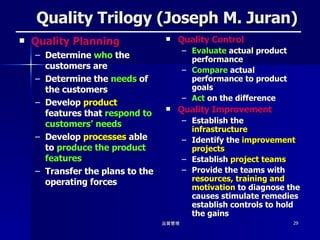
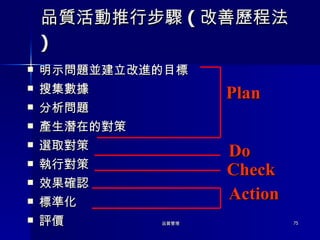
Quality Trilogy (JosephM. Juran) Quality Planning Determine who the customers are Determine the needs of the customers Develop product features that respond to customers’ needs Develop processes able to produce the product features Transfer the plans to the operating forces Quality Control Evaluate actual product performance Compare actual performance to product goals Act on the difference Quality Improvement Establish the infrastructure Identify the improvement projects Establish project teams Provide the teams with resources, training and motivation to diagnose the causes stimulate remedies establish controls to hold the gains
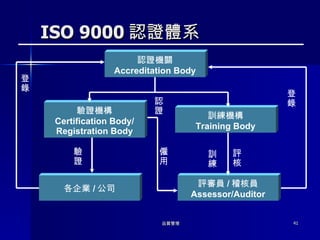
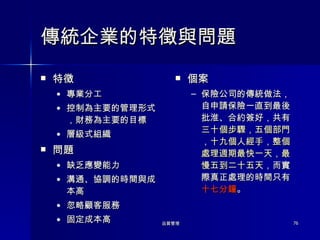
ISO 9000 認證體系認證機關 Accreditation Body 驗證機構 Certification Body/ Registration Body 訓練機構 Training Body 評審員 / 稽核員 Assessor/Auditor 各企業 / 公司 認證 登錄 驗證 僱用 評核 訓練 登錄
42.
The Malcolm BaldrigeNational Quality Award , MBNQA 1 1987 年 8 月 20 日創立 施行者: The National Bureau of Standards and Technology , NIST) 目的 促進瞭解市場需求 改善競爭力 分享在良好策略上的成功經驗 瞭解成功策略的由來與益處
43.
The Malcolm BaldrigeNational Quality Award , MBNQA 2 獎勵對象類別 製造業 服務業 小型企業 健康醫療業 教育業 給獎頻率、數量 每年 、 每類三個獎項
44.
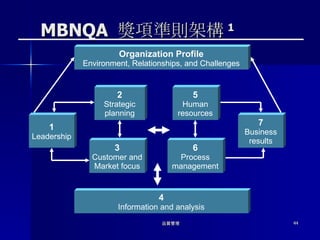
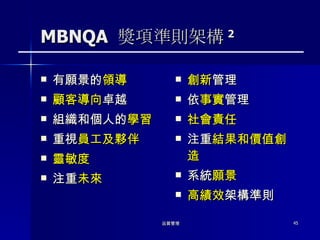
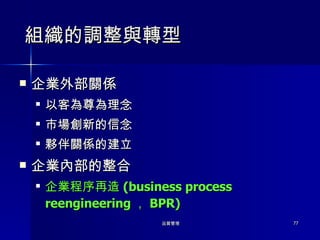
MBNQA 獎項準則架構1 Organization Profile Environment, Relationships, and Challenges 1 Leadership 2 Strategic planning 5 Human resources 6 Process management 3 Customer and Market focus 7 Business results 4 Information and analysis
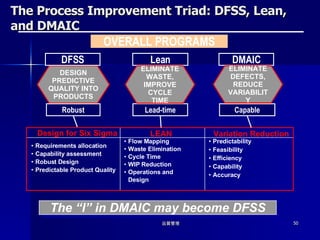
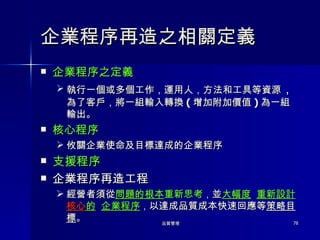
The Process ImprovementTriad: DFSS, Lean, and DMAIC OVERALL PROGRAMS LEAN Variation Reduction Predictability Feasibility Efficiency Capability Accuracy Flow Mapping Waste Elimination Cycle Time WIP Reduction Operations and Design Lean Lead-time Capable DMAIC ELIMINATE WASTE, IMPROVE CYCLE TIME DESIGN PREDICTIVE QUALITY INTO PRODUCTS ELIMINATE DEFECTS, REDUCE VARIABILITY DFSS Robust Requirements allocation Capability assessment Robust Design Predictable Product Quality Design for Six Sigma The “I” in DMAIC may become DFSS
51.
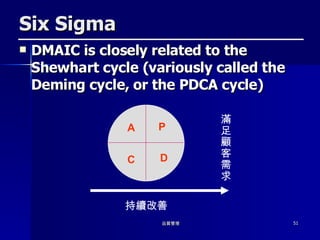
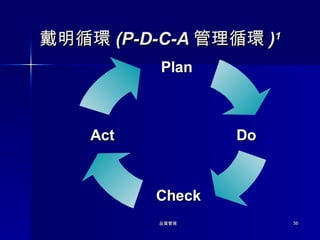
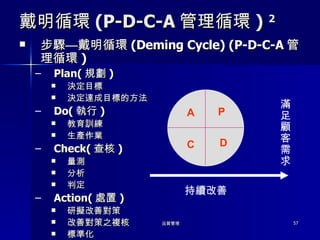
Six Sigma DMAICis closely related to the Shewhart cycle (variously called the Deming cycle, or the PDCA cycle) P D A C 持續改善 滿足顧客需求
52.
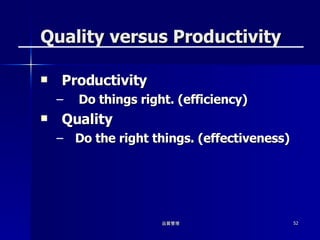
Quality versus Productivity Productivity Do things right. (efficiency) Quality Do the right things. (effectiveness)
53.
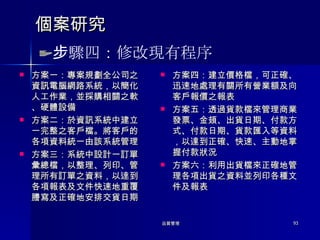
問題 倉*輸入法每分鐘 25個字 vs. 無蝦*輸入法每分鐘 33 個字… 過富足的生活 — 打工 vs. 考證照
54.
The Link BetweenQuality and Productivity Effective quality improvement can be instrumental in increasing productivity and reducing cost . The cost of achieving quality improvements and increased productivity is often negligible .
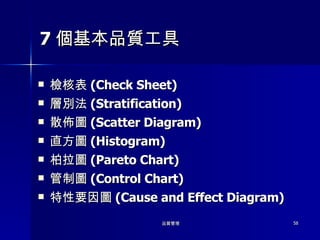
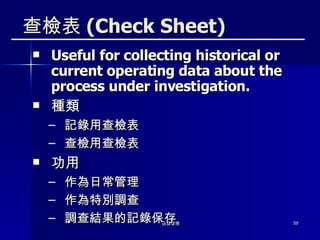
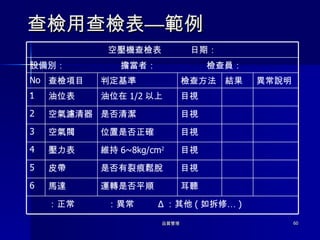
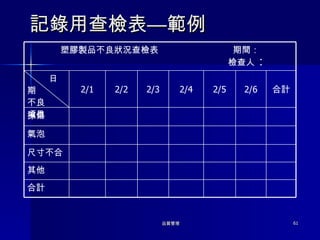
查檢表 (Check Sheet)Useful for collecting historical or current operating data about the process under investigation. 種類 記錄用查檢表 查檢用查檢表 功用 作為日常管理 作為特別調查 調查結果的記錄保存
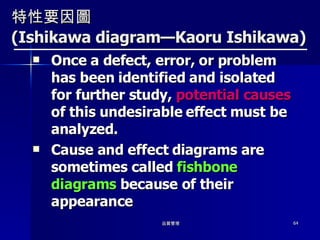
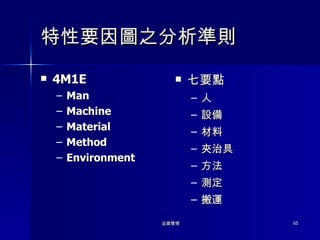
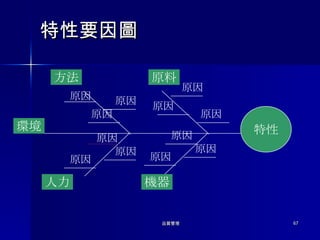
特性要因圖 (Ishikawa diagram—KaoruIshikawa) Once a defect, error, or problem has been identified and isolated for further study, potential causes of this undesirable effect must be analyzed. Cause and effect diagrams are sometimes called fishbone diagrams because of their appearance
Construct a Cause-and-EffectDiagram Define the problem or effect to be analyzed. Form the team to perform the analysis. Often the team will uncover potential causes through brainstorming . Draw the effect box and the center line. Specify the major potential cause categories and join them as boxes connected to the center line Identify the possible causes and classify them into the categories in step 4. Create new categories, if necessary. Rank order the causes to identify those that seem most likely to impact the problem. Take corrective action .
散佈圖 The scatter diagram is a plot of two variables that can be used to identify any potential relationship between the variables. The shape of the scatter diagram often indicates what type of relationship may exist .
69.
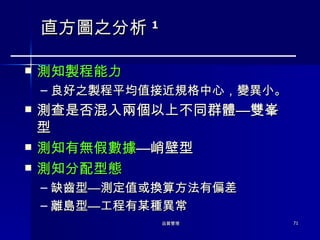
The Frequency Distribution and Histogram( 直方圖 ) 1 間斷分配 蒐集資料 排序 編製次數分配表 繪直方圖 次數直方圖 相對次數直方圖 累積次數直方圖 相對累積次數直方圖
70.
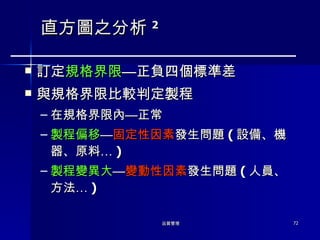
The Frequency Distribution and Histogram( 直方圖 ) 2 連續分配 蒐集資料 排序 定全距: R=X max -X min 定組數 (k) K=(N) 1/2 史特吉斯 (Sturgis) 法則: K=1+3.322logN 經験值 定組距 (i) i=R/K 取奇數,可使組中點與數據有相同之小數點位數 定組限與組 界定組中點 編製次數分配表 繪直方圖