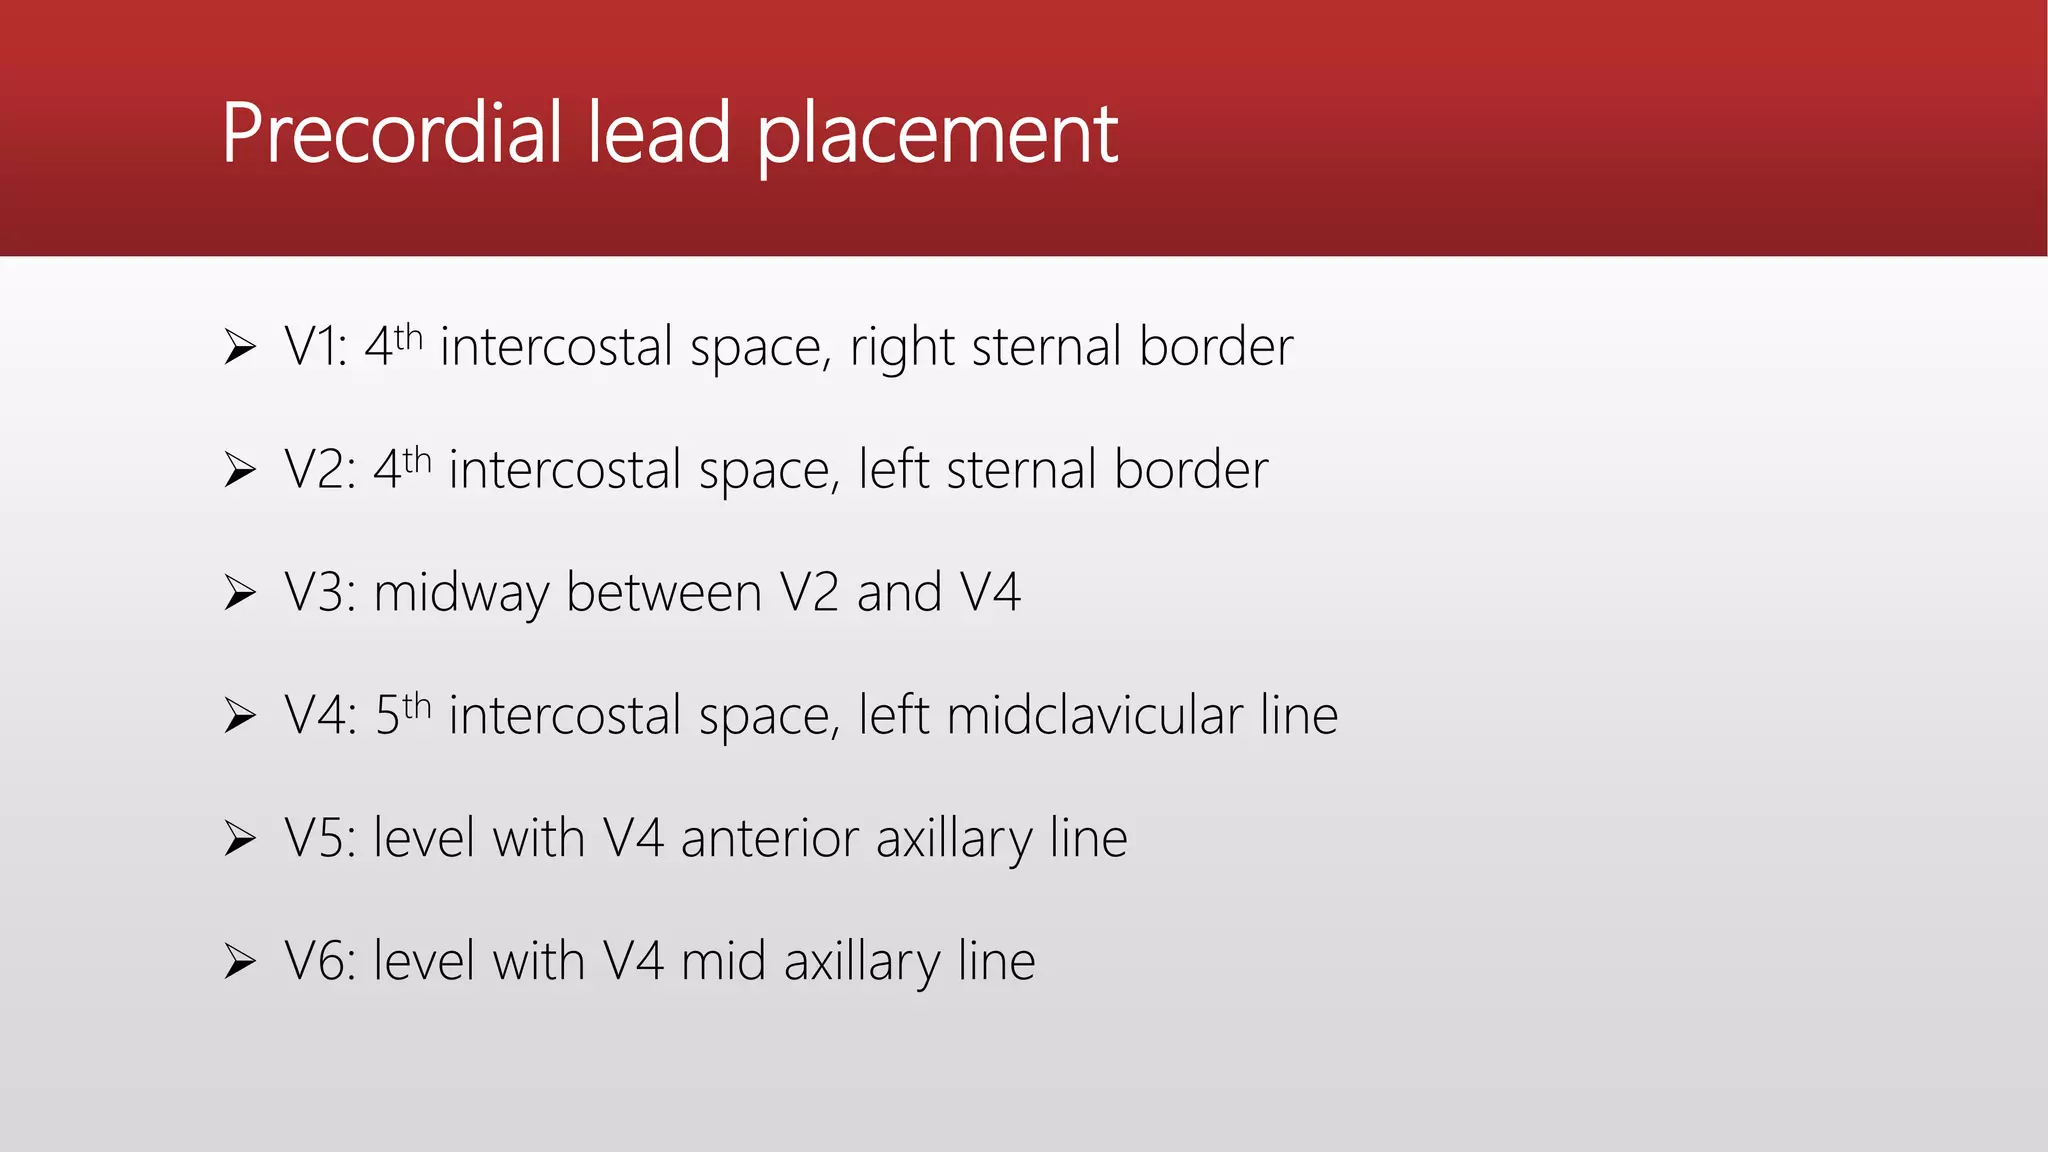
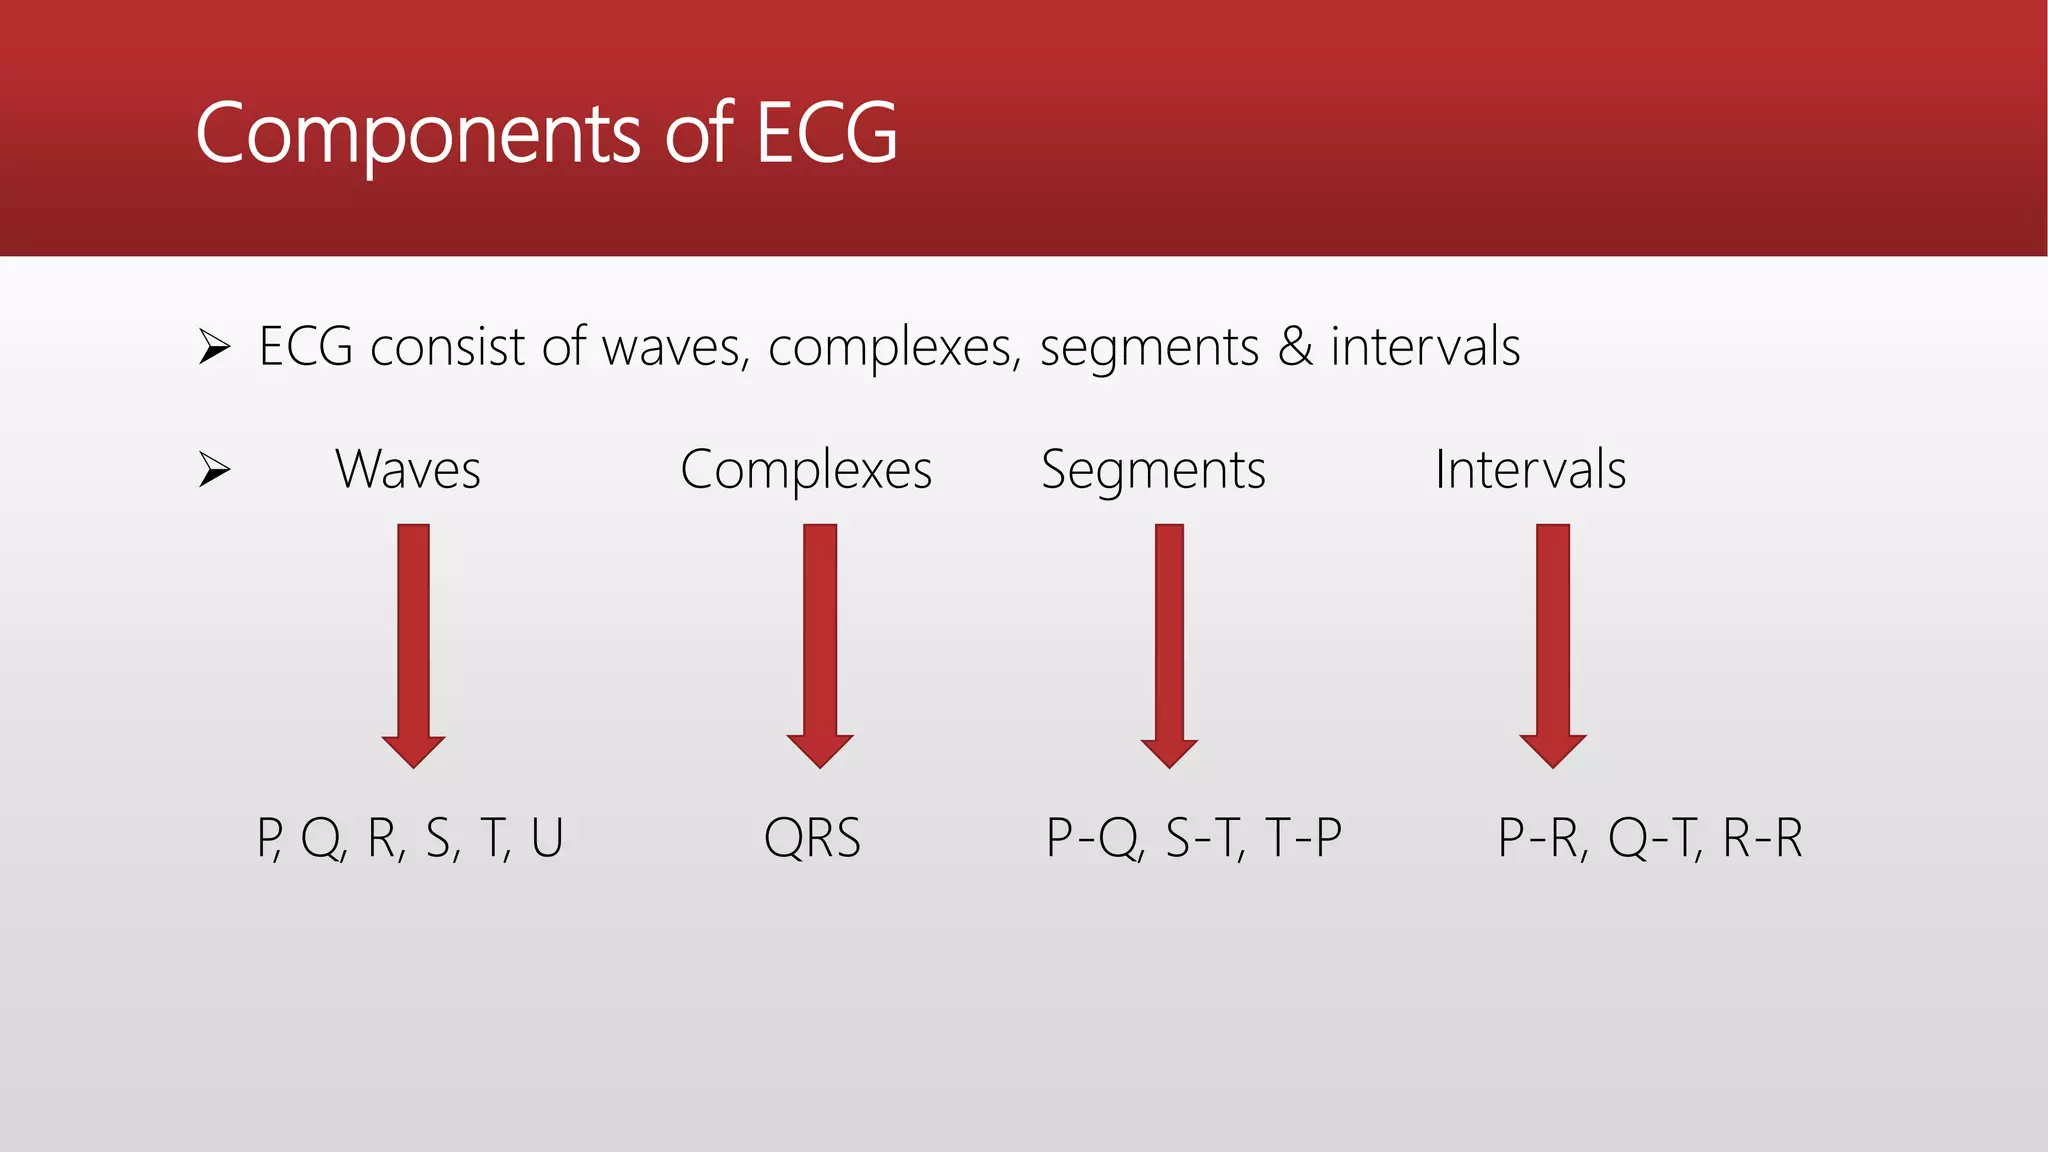
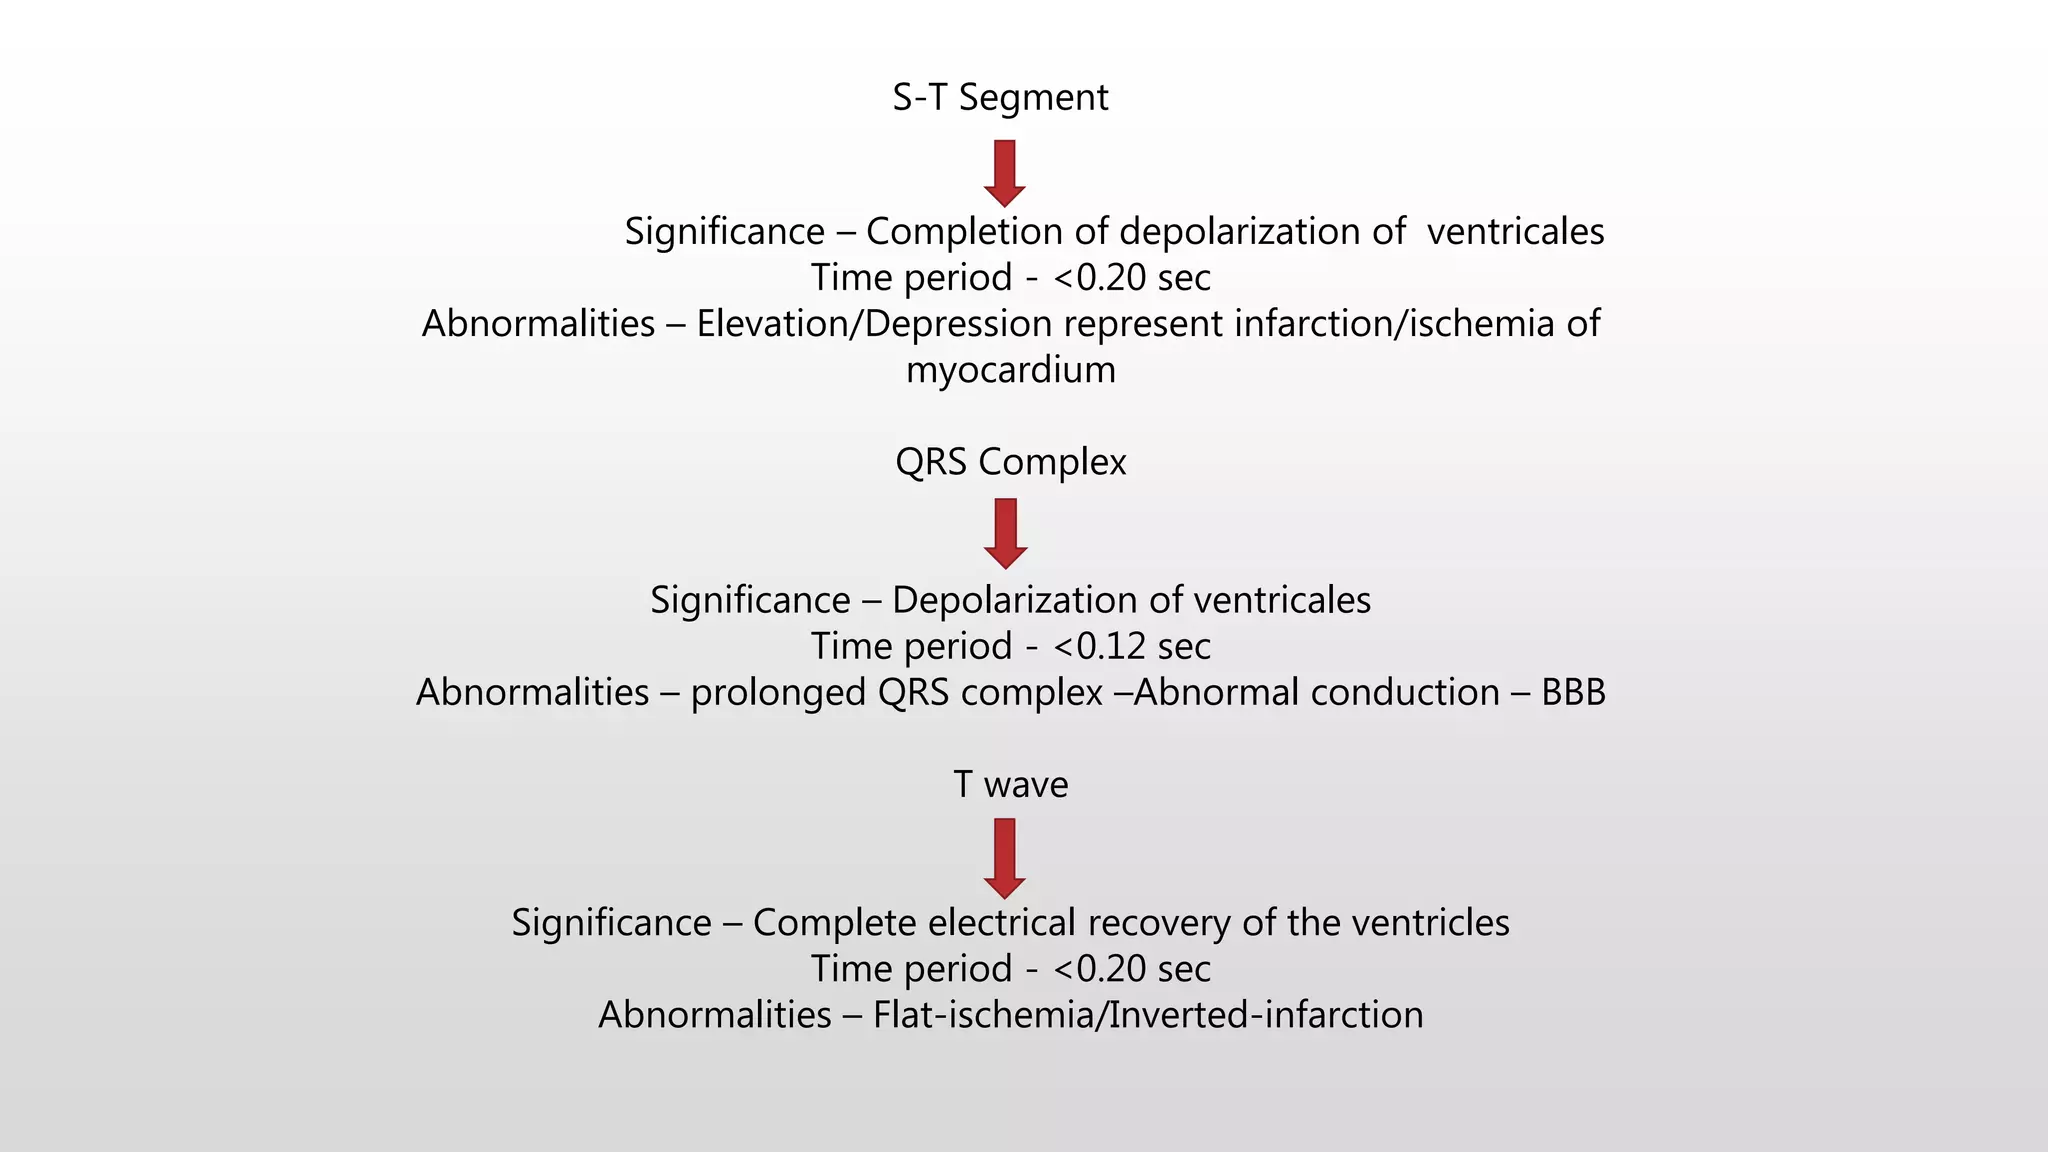
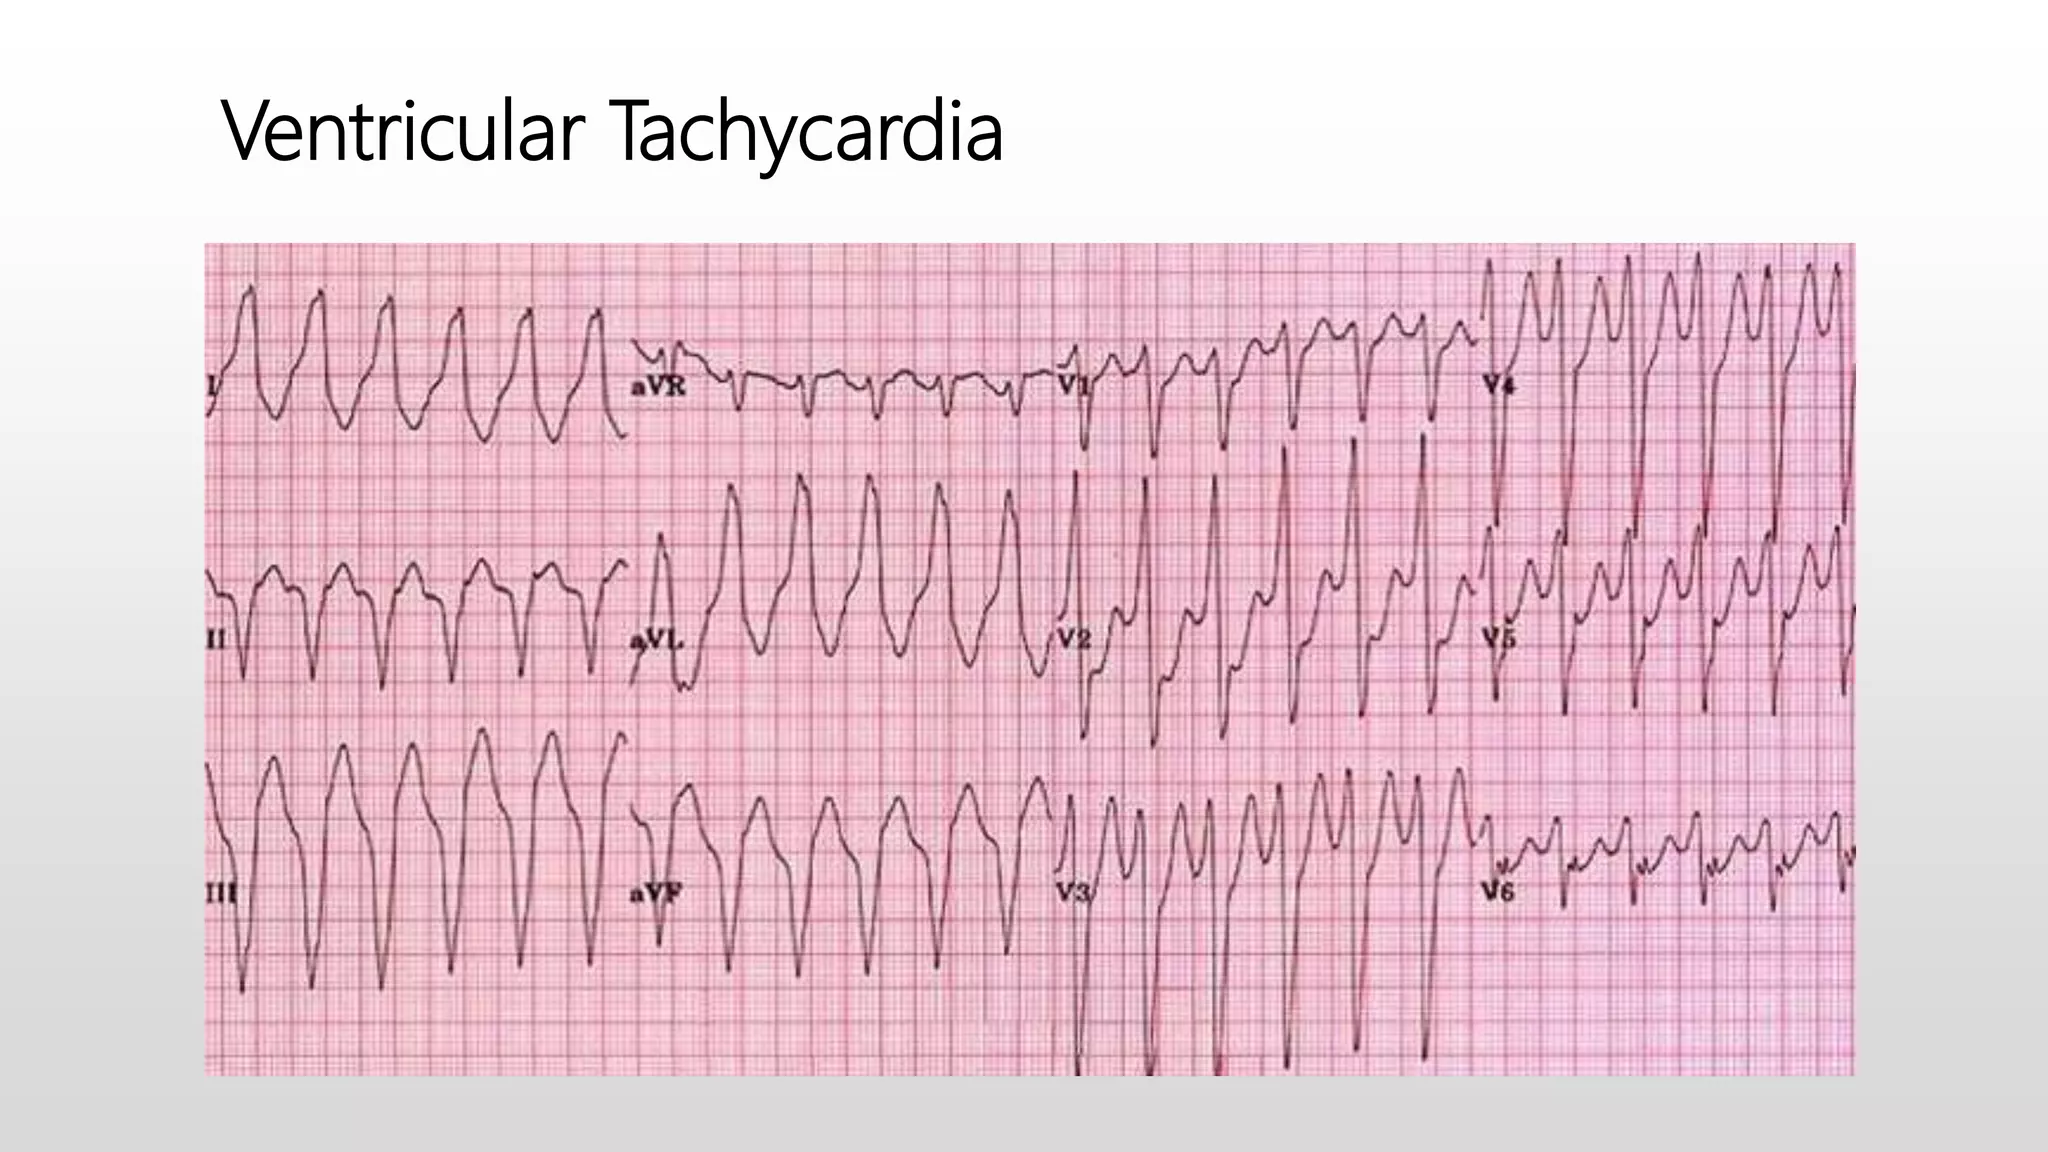
ECG
- PURVI SHAH
(B.P.T)
Electrocardiogram
 An ECG is a permanent record of the electrical impulses
generated in the heart by the depolarization & repolarization
(contraction & relaxation) of the myocardium.
 It is a representation of the electrical events of the cardiac
cycle.
 These impulses are transmitted to the surface of the body
where they are detected & picked up by the electrodes &
measured by electrocardiograph.
Clinical use of ECG
 To assess the cardiac functions, e.g. rate, rhythm, &
conduction.
 TO diagnose cardiac rhythm disorders, e.g. heart attack
TO diagnose cardiac diseases, e.g. MI
 To evaluate effects of the treatments, e.g. administration of
cardiac drugs.
Rate Rhythm Cardiac
disease
Effect of treatments
Normal = 60
100 beats /
min
Irregular Cardiomyopathy Inotropic effect
Tachycardia Fast Myocardial
infarction
Chonotropic effect
Bradycardia Slow Heart attack Rhythmic effect
ECG lead placement
 12. Leads ECG Placement
 3. Standard limbs leads
 3. Augmated limbs leads
 6. Precordial leads
Standard limb leads
 LEADS I, II, III
 These are the bipolar leads
that register the voltage
between two electrodes
Augmated limb leads
 Leads aVR, aVL, aVF
These are the unipolar leads that register
the activity in the heart which is directed
or located below electrode
Precordial lead placement
 V1: 4th intercostal space, right sternal border
 V2: 4th intercostal space, left sternal border
 V3: midway between V2 and V4
 V4: 5th intercostal space, left midclavicular line
 V5: level with V4 anterior axillary line
 V6: level with V4 mid axillary line
Leads V1 & aVR- Represent right side of the heart
Leads V2, V3, V4- Represent transition between the right & left
side of the heart
Leads V5, V6. I, aVL- Represent left side of the heart
Leads II, III, aVF- Represent the inferior part of the heart
Einthoven’s triangle
It is an imaginary formation of the three
leads in a triangle used in ECG
The heart being a centre of a euilateral
triangle, whose apices are at a right arm,
left leg & left arm.
 The triangle, thus formed is called
Einthoven’s triangle
Components of ECG
Normal ECG
Components of ECG
 ECG consist of waves, complexes, segments & intervals
 Waves Complexes Segments Intervals
P, Q, R, S, T, U QRS P-Q, S-T, T-P P-R, Q-T, R-R
P wave
Significance – Depolarization of atria
Time period - <0.12 sec
Abnormalities – Abnormal or absence of SA node
abnormality
P-R Interval
Significance – Time for the impulses to reach the ventricales
Time period - <0.20 sec
Abnormalities – prolonged P-R intervals indicates
conduction of block
S-T Segment
Significance – Completion of depolarization of ventricales
Time period - <0.20 sec
Abnormalities – Elevation/Depression represent infarction/ischemia of
myocardium
QRS Complex
Significance – Depolarization of ventricales
Time period - <0.12 sec
Abnormalities – prolonged QRS complex –Abnormal conduction – BBB
T wave
Significance – Complete electrical recovery of the ventricles
Time period - <0.20 sec
Abnormalities – Flat-ischemia/Inverted-infarction
Abnormalities of the waves
 Absent of the p wave in atrial fibrillation, atrial flutter, ventricular
tachycardia, hyperkalemia
 Abnormal Q wave - MI
 Abnormal R wave – right ventricular hypertrophy
left ventricular hypertrophy
 Abnormal QRS complex – bundle branch block, intraventricular conduction
defect, ventricular arrhythmias
 Abnormal U wave – left ventricular systolic & diastolic overload (inverted)
hypokalemia, cardiovascular drugs (prominent U wave)
Abnormalities of the waves
 Abnormal PR segment – sinus tachycardia, acute pericarditis,
atrial infarction (depression)
 Abnormalities of ST segment – CVA, pulmonary
embolism(depression)
 Abnormalities of P-R interval – coronary artery disease, acute
rheumatic fever (Prolonged P-R interval)
 Abnormalities of Q-T interval – hyperkalemia, hypercalcemia
(shortened Q-T interval)/ mitral valve prolapse, electrolyte
deficiency (prolonged Q-T prolonged)
The ECG paper
 Horizontally
One small box – 0.04 sec
One large box – 0.20 sec
Vertically
One large box – 5mm (0.5 mv)
Calculating the Heart Rate
 Count the number large square between two consecutive ‘R’
waves then divide the result by 300
 Count number of ‘R’ waves in a 6 sec strip then multiply the result
by 10(this method especially good for irregular heart rates)
 With a rate ruler
How to read ECG
 Heart Rate (calculating heart rate with following method)
 Heart Rhythm(regular irregular/irregularly irregular
 Cardiac Axis (describe overall direction of electrical spread
within heart, to determine cardiac axis need to look at leads
I,II,III)
 Look P wave present or absent(check duration, direction&
shape, if P wave are absent indicate irregular rhythm suggest
atrial fibrillation
 PR interval (a prolonged or short indicate certain disease)
 QRS complex (width, height, morphology)
 ST segment (elevated or depressed indicate MI)
 T wave
 U wave (>0.5 mm deflection)
Causes of poor ECG signal
 oily, dirty & scaly skin
 Dirty electrodes
 Improper application
 Loose electrodes
 Broken cable wire
Ventricular Tachycardia
Atrial Fibrillation
Left Ventricular Hypertrophy
Thank You

Purvi shah ecg ppt

  • 1.
  • 3.
    Electrocardiogram  An ECGis a permanent record of the electrical impulses generated in the heart by the depolarization & repolarization (contraction & relaxation) of the myocardium.  It is a representation of the electrical events of the cardiac cycle.  These impulses are transmitted to the surface of the body where they are detected & picked up by the electrodes & measured by electrocardiograph.
  • 5.
    Clinical use ofECG  To assess the cardiac functions, e.g. rate, rhythm, & conduction.  TO diagnose cardiac rhythm disorders, e.g. heart attack TO diagnose cardiac diseases, e.g. MI  To evaluate effects of the treatments, e.g. administration of cardiac drugs.
  • 6.
    Rate Rhythm Cardiac disease Effectof treatments Normal = 60 100 beats / min Irregular Cardiomyopathy Inotropic effect Tachycardia Fast Myocardial infarction Chonotropic effect Bradycardia Slow Heart attack Rhythmic effect
  • 7.
    ECG lead placement 12. Leads ECG Placement  3. Standard limbs leads  3. Augmated limbs leads  6. Precordial leads
  • 8.
    Standard limb leads LEADS I, II, III  These are the bipolar leads that register the voltage between two electrodes
  • 9.
    Augmated limb leads Leads aVR, aVL, aVF These are the unipolar leads that register the activity in the heart which is directed or located below electrode
  • 10.
    Precordial lead placement V1: 4th intercostal space, right sternal border  V2: 4th intercostal space, left sternal border  V3: midway between V2 and V4  V4: 5th intercostal space, left midclavicular line  V5: level with V4 anterior axillary line  V6: level with V4 mid axillary line
  • 13.
    Leads V1 &aVR- Represent right side of the heart Leads V2, V3, V4- Represent transition between the right & left side of the heart Leads V5, V6. I, aVL- Represent left side of the heart Leads II, III, aVF- Represent the inferior part of the heart
  • 14.
    Einthoven’s triangle It isan imaginary formation of the three leads in a triangle used in ECG The heart being a centre of a euilateral triangle, whose apices are at a right arm, left leg & left arm.  The triangle, thus formed is called Einthoven’s triangle
  • 15.
  • 16.
  • 17.
    Components of ECG ECG consist of waves, complexes, segments & intervals  Waves Complexes Segments Intervals P, Q, R, S, T, U QRS P-Q, S-T, T-P P-R, Q-T, R-R
  • 19.
    P wave Significance –Depolarization of atria Time period - <0.12 sec Abnormalities – Abnormal or absence of SA node abnormality P-R Interval Significance – Time for the impulses to reach the ventricales Time period - <0.20 sec Abnormalities – prolonged P-R intervals indicates conduction of block
  • 20.
    S-T Segment Significance –Completion of depolarization of ventricales Time period - <0.20 sec Abnormalities – Elevation/Depression represent infarction/ischemia of myocardium QRS Complex Significance – Depolarization of ventricales Time period - <0.12 sec Abnormalities – prolonged QRS complex –Abnormal conduction – BBB T wave Significance – Complete electrical recovery of the ventricles Time period - <0.20 sec Abnormalities – Flat-ischemia/Inverted-infarction
  • 21.
    Abnormalities of thewaves  Absent of the p wave in atrial fibrillation, atrial flutter, ventricular tachycardia, hyperkalemia  Abnormal Q wave - MI  Abnormal R wave – right ventricular hypertrophy left ventricular hypertrophy  Abnormal QRS complex – bundle branch block, intraventricular conduction defect, ventricular arrhythmias  Abnormal U wave – left ventricular systolic & diastolic overload (inverted) hypokalemia, cardiovascular drugs (prominent U wave)
  • 22.
    Abnormalities of thewaves  Abnormal PR segment – sinus tachycardia, acute pericarditis, atrial infarction (depression)  Abnormalities of ST segment – CVA, pulmonary embolism(depression)  Abnormalities of P-R interval – coronary artery disease, acute rheumatic fever (Prolonged P-R interval)  Abnormalities of Q-T interval – hyperkalemia, hypercalcemia (shortened Q-T interval)/ mitral valve prolapse, electrolyte deficiency (prolonged Q-T prolonged)
  • 23.
    The ECG paper Horizontally One small box – 0.04 sec One large box – 0.20 sec Vertically One large box – 5mm (0.5 mv)
  • 25.
    Calculating the HeartRate  Count the number large square between two consecutive ‘R’ waves then divide the result by 300  Count number of ‘R’ waves in a 6 sec strip then multiply the result by 10(this method especially good for irregular heart rates)  With a rate ruler
  • 26.
    How to readECG  Heart Rate (calculating heart rate with following method)  Heart Rhythm(regular irregular/irregularly irregular  Cardiac Axis (describe overall direction of electrical spread within heart, to determine cardiac axis need to look at leads I,II,III)  Look P wave present or absent(check duration, direction& shape, if P wave are absent indicate irregular rhythm suggest atrial fibrillation  PR interval (a prolonged or short indicate certain disease)
  • 28.
     QRS complex(width, height, morphology)  ST segment (elevated or depressed indicate MI)  T wave  U wave (>0.5 mm deflection)
  • 29.
    Causes of poorECG signal  oily, dirty & scaly skin  Dirty electrodes  Improper application  Loose electrodes  Broken cable wire
  • 31.
  • 32.
  • 33.
  • 34.