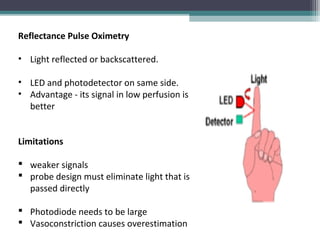
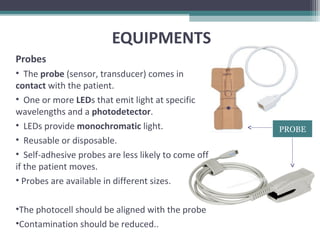
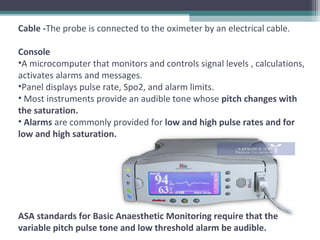
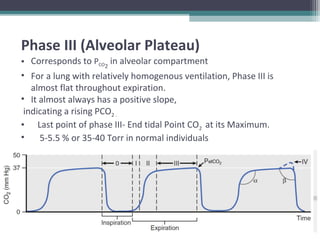
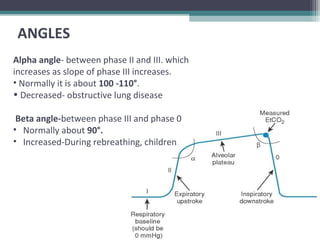
2. Pulse oximetry sometimes also called as fifth vital sign.
It is a non-invasive method of measuring haemoglobin
saturation with light signal transmitted through the tissue.
Until 1980s, large, cumbersome and expensive ear oximeters
were used.
Limitation of such oximeters included difficulty in
differentiating light absorbance of arterial blood (pulsatile
component) from venous blood and tissues (static component).
INTRODUCTION
3. Pulse oximeters are available as
⢠Stand alone devices
⢠Incorporated into multiparameter
monitors
⢠Relative new developments include
combined pulse oximetry and
transcutaneous CO2
tension ear
sensor.
Technical advances- LEDs, photodetectors and microprocessors-
used to make small, less expensive and easy-to-use oximeters.
These differentiate light absorbance of pulsatile arterial
component from static components, hence called Pulse
Oximeters.
4. 1935 - Karl Matthes (German physician) developed the first 2-
wavelength ear O2 saturation meter with red and green filters.
1940s - Glen Millikan coined the term "oximeter" to describe a
lightweight earpiece to detect the SpO2.
1964 - Robert Shaw, a surgeon, built a self calibrating ear oximeter
using 8 wavelengths of light.
1972 â Takuo and Michio Kishi, both bioengineers at Nihon Kohden
devised a method using the ratio of red to infrared light absorption of
pulsating components at the measuring site.
HISTORY
5. 1975- Susumu Nakajima, a surgeon, and his associates first tested the
device on patients.
1980- It was first commercialized by BIOX.
1987- The standard of care for the administration of a general
anaesthetic in the U.S. included pulse oximetry.
1995- Masimo introduced Signal Extraction Technology (SET) that could
measure accurately during patient motion and low perfusion by
separating the arterial signal from the venous and other signals.
2008 â Advent of High Resolution Pulse Oximetry (HRPO). HRPO has
been developed for in-home sleep apnoea screening and testing.
HISTORY
6. Pulse oximetry works on the principle of spectral analysis
for measurement of oxygen saturation, i.e. the detection and
quantification of components in solution by their unique light
absorption characteristics.
Pulse oximeters combine the principle of
spectrophotometry and plethysmography to noninvasively
measure the oxygen saturation in arterial blood.
OPERATING PRINCIPLE
9. Beer-Lambert law
It states that if a light of known intensity illuminates a chamber of
known dimension, then the concentration of the dissolved substance
can be determined if the incident and transmitted light are measured.
It = Ii eâdCÎą
Solved for C,
C= (1/dÎą) ln(Ii/It )
Where,
It - intensity of transmitted light
Ii- intensity of incident light
Îą - absorption
d- distance the light travels through the
liquid
C- concentration of hemoglobin
e- extinction coefficient of the solute (a
constant for a given solute at a specified
wavelength). It is a measure of tendency of
a substance to absorb light.
10. Beer-Lambert law
Beer's law
Intensity of transmitted light
decreases exponentially as the
concentration of the substance
increases.
Lambert's law
Intensity of transmitted light
decreases exponentially as the
distance travelled through the
substance increases.
11. AC component, represents absorption of light by the pulsating
arterial blood.
DC (baseline) component represents absorption of light by the tissue bed,
including venous, capillary, and nonpulsatile arterial blood.
R = (AC 660 / DC 660) / (AC 940/DC 940)
12. EXTINCTION COEFFICIENT:
It is a measure of tendency of a substance to absorb light.
Adult blood usually contains four types of hemoglobin:
⢠Oxyhemoglobin (O2hb)
⢠Reduced hemoglobin (rhb)
⢠Methemoglobin (methb)
⢠Carboxyhemoglobin (CO Hb)
Fractional Hb saturation (O2Hb%) is defined as the ratio of oxyhaemoglobin
to total haemoglobin species present.
O2Hb%= HbO2/ (HbO2 + Hb + metHb + COHb) *100
Functional saturation (SaO2) is defined as the ratio of oxyhaemoglobin to
reduced haemoglobin
SaO2 = HbO2/ (HbO2 + Hb ) *100
13.
14. O2 content of arterial blood is,
CaO2 = Oxygen bound to hemoglobin + O2 dissolved in plasma
CaO2 = [1.36 Ă Hb Ă HbO % (SpO2)] + [0.003 Ă PaO2].
Pulse oximeter provides a non
invasive measurement of
arterial hemoglobin
saturation, a variable that is
directly related to oxygen
content of arterial
blood..
16. Each pulse oximeter probe contains :
⢠LED, which emit two wavelengths of light (red and near infrared)
⢠A photodetector on the other side measures the intensity of
transmitted light at each wavelength
Pulse Oximeter
17. Transmission Pulse Oximetry
⢠Light beam is transmitted through a
vascular bed and is detected on
opposite side of that bed
⢠LED and photodetector on opposite
sides
⢠Most common type
TYPES OF PULSE OXIMETRY
18. Reflectance Pulse Oximetry
⢠Light reflected or backscattered.
⢠LED and photodetector on same side.
⢠Advantage - its signal in low perfusion is
better
Limitations
ď§ weaker signals
ď§ probe design must eliminate light that is
passed directly
ď§ Photodiode needs to be large
ď§ Vasoconstriction causes overestimation
19. EQUIPMENTS
Probes
⢠The probe (sensor, transducer) comes in
contact with the patient.
⢠One or more LEDs that emit light at specific
wavelengths and a photodetector.
⢠LEDs provide monochromatic light.
⢠Reusable or disposable.
⢠Self-adhesive probes are less likely to come off
if the patient moves.
⢠Probes are available in different sizes.
â˘The photocell should be aligned with the probe
â˘Contamination should be reduced..
PROBE
20. Cable -The probe is connected to the oximeter by an electrical cable.
Console
â˘A microcomputer that monitors and controls signal levels , calculations,
activates alarms and messages.
â˘Panel displays pulse rate, Spo2, and alarm limits.
⢠Most instruments provide an audible tone whose pitch changes with
the saturation.
⢠Alarms are commonly provided for low and high pulse rates and for
low and high saturation.
ASA standards for Basic Anaesthetic Monitoring require that the
variable pitch pulse tone and low threshold alarm be audible.
21. Sites of probe placement
⢠Fingers
⢠Toe
⢠Ear
⢠Nose
⢠Tongue
⢠Cheek
⢠Esophagus
⢠Forehead
⢠Penis
DIFFERENT SITES
22. FINGER
⢠Most common, Convenient, Accurate
⢠Used even in Burns
⢠Motion artifacts less frequent
Disadvantages
⢠Dark nail polish or synthetic nails; Onychomycosis, dirt under
nails can interfere with readings â probe reorientation.
⢠Resaturation, desaturation detection slower than centrally
placed probes.
⢠Poor function may be observed when same side as I.V.Fluids-
due to local hypothermia, vasoconstriction
⢠Same side as Intra-Arterial catheter, BP cuff - â SPO2
TOE
Reliable signal in Epidural Block.-â Pulse amplitude
Delay in detection of Hypoxemia
23.
24. NOSE
⢠Responds more rapidly to changes in saturation.
⢠Reccomended- Hypothermia, Hypotension
⢠Trendelenberg position- False low SPO2 due to venous congestion.
EAR
⢠Central â Faster response time
⢠Better in Hypothermia, Hypotension
⢠Relatively immune to vasoconstrictor effects of
sympathetic system.
⢠Wrong readings in Trendelenberg position
25. TONGUE- probe made by placing a malleable aluminium strip behind
the probe.
⢠Very Accurate, faster response
⢠Useful in burns patient
⢠Resistant to signal interference from electrosurgery.
⢠RPO has been used on superior surface of the tongue.
Disadvantages
⢠Difficult to maintain in place at emergence
⢠Tongue quivering mimics Tachycardia
⢠Venous congestion, oral secretions
⢠Can be placed only after intubation or insertion of SGA
26. CHEEK â probe with metal strip
⢠Buccal pulse oximetry more accurate than finger probe.
⢠Faster response, Accurate
⢠Effective in Hypothermia, Hypotension, â SVR , burns
⢠Disadvantage- poor acceptance by awake patients, difficult
placement, artefacts during airway maneuvers.
ESOPHAGUS
⢠Uses reflectance oximetry
⢠Core organ- More consistent and reliable in hemodynamic instability.
⢠Useful in burns patients.
FOREHEAD
⢠RPO- Just above eyebrow, centered slightly lateral to iris
⢠Less affected by Vasoconstriction,
⢠Disadvantages-Trendelenberg position- Venous Pooling( â SPO2)
27. MISCELLANEOUS
⢠Pharyngeal pulse oximetry by using a pulse oximeter
attached to a laryngeal mask may be useful in patients with
poor peripheral perfusion.
⢠Flexible probes may work through the palm, foot, penis,
ankle, lower calf, or even the arm in infants
⢠Pulse oximetry may be used to monitor fetal oxygenation
during labor by attaching a reflectance pulse oximetry probe
to the presenting part . A disadvantage is that the probe has
to be placed blindly and may be positioned over a
subcutaneous vein or artery, which will affect the reliability of
the readings
28. Other Concerns:
Signal Stabilization
Pulse oximeter uses sequential trials of various intensities of light
in effort to find a signal strong enough to transmit through the tissues but
not so strong as to saturate the detection system.
Once the pulse is found there is a delay of about 10 seconds while SpO2
of several pulses are averaged.
Appearance of a satisfactory waveform indicates reliability of the reading.
Comparison of PR (from pulse oximeter) and HR (from ECG) also indicate
reliability of saturation readings.
Reusability - Disposable probes are costly and most institutions reuse
them as cost cutting purpose. Accuracy is not affected.
29. OXIMETER STANDARDS
â˘Limit to duration of continuous operation at temperature > 41°C
â˘Accuracy must be stated over 70-100 SpO2%
â˘If manufacturer claims accuracy during motion, then test methods to
establish it must be disclosed.
â˘If manufacturer claims accuracy during low perfusion, then test
methods to establish it must be disclosed.
â˘There must be an indication when Spo2 or PR data is not correct
â˘Alarm system that monitors equipment faults and alarm for low
Spo2 not less than 85%.
â˘Indication of signal inadequacy must be provided
â˘Variable pitch auditory signal is provided.
30. USES OF PULSE OXIMETRY
Monitoring oxygenation in :
⢠Operation theatres
⢠PACU
⢠Critical care
⢠Transport
⢠Mechanical ventilation
31. ⢠Monitoring peripheral circulation
⢠Determining systolic blood pressure
⢠Locating vessels
⢠Avoidance of hyperoxaemia
⢠Monitoring vascular volume
⢠Judicious usage of O2
⢠Care in NICU
⢠Fetal oximetry
32. PITFALLS AND LIMITATIONS
Dyshemoglobinemias
COHb and MetHb also absorb light at the pulse oximeter's two
wavelengths, and this leads to error in estimating the percentages
of reduced and oxyhemoglobins.
When the presence of either of these dyshemoglobins is
suspected, pulse oximetry should be supplemented by
multiwavelength co-oximetry.
Extraneous energy sources:
â˘Bright visible or Infrared light which may flood or overload the
semiconductor detector.
â˘The problem of bright fluorescent ambient light causing spurious
readings can be reduced by covering the sensor with felt pads
33. â˘Pulsatile veins
â˘Poor function with poor peripheral perfusion
â˘Patient safety: skin burns or pressure damage under the probe
because some early probes had a heater unit to ensure adequate
skin perfusion.
â˘Difficulty in detecting high oxygen partial pressures
â˘Erratic performance with irregular rhythms
â˘Nail polish and coverings
â˘Loss of accuracy at low values
34. DELAYED DETECTION OF HYPOXIC EVENTS
â˘Significant delay between a change in alveolar oxygen tension and a
change in the oximeter reading.
â˘Arterial oxygen reach dangerous levels before the pulse oximeter alarm is
activated.
â˘Lag time will be increased with poor perfusion and a decrease in blood
flow to the site monitored.
â˘Lag monitor : Partial pressure of oxygen can have fallen a great deal
before the oxygen saturation starts to fall.
â˘Response delay due to signal averaging: The signal is averaged out over 5
to 20 seconds. This may result in âfrozenâ Spo2 values (values being
displayed while the true saturation is rapidly changing) .
35. Electrical interference
⢠Electrical interference from an electrosurgical unit can cause the
oximeter to give an incorrect pulse count (usually by counting extra
beats) or to falsely register decrease in oxygen saturation.
â˘Increased in patients with weak pulse signals.
â˘The effect is transient and limited to the duration of the cauterization.
36. Steps to minimize electrical interference include
⢠Electrosurgery grounding plate as close to surgical field as possible
⢠Cable of the sensor to the oximeter away from the electrosurgery
apparatus
⢠Keeping the pulse oximeter sensor and console as far as possible from
the surgical site and the electrosurgery grounding plate and table
⢠Operating the unit in a rapid response mode
⢠Plug to different power source.
37. METHODS TO IMPROVE THE SIGNAL
⢠Warming cool extremities
⢠Application of vasodilating cream. Eg. GTN cream, EMLA
⢠Placing a gloves filled with warm water over patient hand.
⢠Try an alternative probe site
⢠Try a different probe.
⢠Administration of intra-arterial vasodilators.
⢠Try a different machine
⢠Digital nerve blocks.
38. EXTENSIONS OF PULSE OXIMETRY TECHNOLOGY
Mixed venous blood oxygen saturation (Sv02) :
which requires the placement of a PAC (Pulmonary Artery
Catheter) containing fiber optic sensors that continuously
determine Sv02 in a manner analogous to pulse oximetry.
This is based on the principle of Reflectance Pulse Oximetry
using either a two- or three- wavelength technique.
Noninvasive brain oximetry
monitors regional oxygen saturation (rS02) of hemoglobin in
the brain. A sensor placed on the forehead emits light of
specific wavelengths and measures the light reflected back to
the sensor (near-infrared optical spectroscopy).
39. NEWER PULSE OXIMETERS
Reflectance Oximeters: To assess arterial oxygenation
when it is impossible to provide a transmission path.
â˘Used to monitor fetal scalp during labor.
â˘An esophageal probe has been developed to monitor SpO2
â˘Measurement of gastric mucosal SpO2 has the potential to
provide a monitor of splanchnic perfusion.
40. Alternatives to pulse oximetry:
Bench CO-oximetry:
is the gold standard - and is the classic method by which a pulse
oximeter is calibrated.
The CO-oximeter calculates the actual concentrations of
haemoglobin, deoxyhaemoglobin, carboxyhaemoglobin and
methaemoglobin in the sample and hence calculates the actual
oxygen.
CO-oximeters are much more accurate than pulse oximeters - to
within 1%, but they give a 'snapshot' of oxygen saturation, are
bulky, expensive and require constant maintenance as well as
requiring a sample of arterial blood to be taken.
42. INTRODUCTION
The presence of CO2 in exhaled gas reflects the fundamental
physiologic processes of ventilation, pulmonary blood flow
and aerobic metabolism.
Its continuous monitoring assures the Anaesthesiologist of
correct placement of EndoTracheal tube or Laryngeal Mask
Airway as well as integrity of a breathing circuit.
43. ⢠Capnometry is measurement and quantification of inhaled
or exhaled CO2 concentrations at the airway opening.
⢠Capnometer is a device that measures CO2 concentrations.
⢠Capnography is a method of measurement and graphical
display of CO2 as a function of time or volume.
⢠Capnograph is a device that records and displays CO2
concentrations, usually as a function of time.
⢠Capnogram refers to a graphical display that capnograph
generates; CO2 waveform.
TERMINOLOGY
44. HISTORY
⢠The first infra-red CO2 measuring and recording apparatus was
introduced in 1943 by Karl Luft, a German Bioengineer.
It was big, heavy and impractical to use.
⢠In 1978 Holland was the first country to adopt capnography as a
standard of monitoring during Anaesthesia.
⢠Since then capnography has evolved into an essential
component of standard anesthesia monitoring.
⢠In 1998 - ASA as standard care for all general anaesthetics
administered
45. ⢠Changes in respired CO2 may reflect alterations in metabolism,
circulation, respiration and breathing system. Monitoring CO2
gives indication of patientâs metabolic rate.
⢠Assessment of CO2 production, pulmonary perfusion, alveolar
ventilation, respiratory patterns, and elimination of CO2 from the
anaesthesia circuit and ventilator.
â˘Capnography and pulse oximetry together could have helped in
the prevention of 93% of avoidable anesthesia mishaps
according to ASA closed claim study.
SIGNIFICANCE
47. ⢠A beam of infrared light is passed through
a gas sample, and the resulting intensity of
the transmitted light is measured by a
photodetector. The infrared light received is
compared to the infrared light transmitted.
The difference is then converted by
calculations into either partial pressure or
percentage of total gas concentration that
we see on the monitor.
⢠Gaseous CO2 absorbs light over a very
narrow bandwidth centered around 4.26
Îźm.
Infra-red Spectrography
Normal ETCO2 35-
45mmHg
49. SIDE STREAM ANALYZER
⢠Commonly used
⢠CO2 sensors are physically located away from airway gases
⢠Pump or a compressor aspirate gases into sample cell located at
unitâs console through a 6ft tubing, at a rate of 30-500ml/min.
⢠Sidestream capnometers have a transport delay time depending on
sampling rate.
⢠RISE TIME- Time taken by the analyzer
to respond to sudden change in
CO2 concentration.
50. SIDE STREAM ANALYZER
ADVANTAGES DISADVANTAGES
Sampling capillary tube and airway
adapter is easy to connect.
The sampling capillary tube can
easily become obstructed by water
or secretions.
Can be used with patient in almost
any position (prone, etc) and in
awake patients.
Water vapour pressure changes
within the sampling tube can affect
CO2 measurement.
Can be used in awake patients via a
special nasal cannula. CO2 reading is
unaffected by oxygen flow through
the nasal cannula.
Delay in waveform and readout due
to the time it takes the gas sample to
travel to the sensor within the unit.
51. MAIN STREAM ANALYZER
⢠Sample cell directly placed into the breathing system.
⢠Inspiratory and expiratory gases directly pass the infrared light
path.
⢠Hence readings are âreal timeâ
⢠RISE TIME- faster than side stream analyzers
⢠Suitable for neonates and children.
52. DISADVANTAGES
⢠Puts weight at the end of the endotracheal tube that often needs
to be supported. Long electrical cord.
⢠Risk of minor facial burns .
⢠The sensor windows can become obstructed with secretions.
⢠Sensor and airway adapter can be positional â difficult to use in
unusual positions (prone,etc).
⢠Bulky and difficult to sterilize.
MAIN STREAM ANALYZER
54. Two segments: Inspiratory segment
and Expiratory segment,
â˘The Inspiratory segment: also
designated as phase 0.
â˘The Expiratory segment: further
divided into phase I, II and III, and
occasionally phase IV, which
represents the terminal rise in C02
concentration
Two angles: alpha and beta.
55. Phase 0
⢠Is the inspiratory phase where
normal air is breathed in.
⢠There is only 0.36mmHg of CO2 in
the inspired air compared to
expired air.
56. Phase I
ďLatter part of Inspiration.
ďCorresponds to the exhalation of dead space gas from
central conducting airways or any equipment distal to
sampling site, which ideally should have no detectable CO2,
i.e PCO2
~0
57. Phase II (Expiratory
upstroke)
⢠A sharp rise in PCO2
to a plateau.
⢠Indicates the sampling of
transitional gas between the
airways and alveoli
58. Phase III (Alveolar Plateau)
⢠Corresponds to PCO2
in alveolar compartment
⢠For a lung with relatively homogenous ventilation, Phase III is
almost flat throughout expiration.
⢠It almost always has a positive slope,
indicating a rising PCO2 .
⢠Last point of phase III- End tidal Point CO2 at its Maximum.
⢠5-5.5 % or 35-40 Torr in normal individuals
59. ANGLES
Alpha angle- between phase II and III. which
increases as slope of phase III increases.
⢠Normally it is about 100 -110°.
⢠Decreased- obstructive lung disease
Beta angle-between phase III and phase 0
⢠Normally about 90°.
⢠Increased-During rebreathing, children
60. ⢠Advantages of Time Capnography:
1. Simple and convenient:
2. Monitor non-intubated patients
3. Monitors dynamics of inspiration as well as expiration
⢠Disadvantages of Time Capnography:
1. Poor estimation of V/Q status of the lung
2. Can not be used to estimate components of physiological
deadspace
61. Basic Physiology of a Capnogram
⢠At end of inspiration - CO2-free gases.
⢠Carbon dioxide diffuses in alveoli and equilibrates with end-alveolar
capillary blood (PACO2 = PcCO2 = 40 mm Hg).
⢠The actual concentration of CO2 in the alveoli is determined by the
extent of ventilation and perfusion into the alveoli (V/Q ratio).
⢠Well ventilated areas of lung ( well matched V/Q regions) â Lower
PCO2
⢠Less well ventilated areas (poorly matched V/Q regions) have
higher PCO2
⢠As one moves proximally in the respiratory tract, the concentration
of CO2 decreases gradually to zero at some point - respiratory dead
space
62. PETCO2 and Cardiac output
⢠Increases in cardiac output and
pulmonary blood flow result in
better perfusion of the alveoli
and a rise in PETCO2
⢠A PETCO2 greater than 30 mm Hg
was invariably associated with a
cardiac output more than 4
L/min or a cardiac index > 2
L/min/sq mt BSA.
⢠When PETCO2 exceeded 34 mm
Hg, pulmonary blood flow was
more than 5 L/min (CI > 2.5
L/min/ sq mt BSA)
63. APPLICATIONS
â˘ETCO2 as an estimate of PaCO2
Measurements of ETCO2 constitute a useful non-invasive tool to
monitor PaCO2 and hence, the ventilatory status of patients during
anesthesia, or in the intensive care unit. In normal individuals, the (a-ET)
PCO2 may vary from 2-5 mmHg.
â˘Adequacy of spontaneous ventilation & Ventilator malfunction
â˘Integrity of anaesthetic apparatus
â˘Warning- Apnoea, extubation, disconnection, obstruction
â˘Adjustments of fresh gas flow rates in rebreathing systems
â˘Accidental oesophageal intubation
⢠Metabolic states
⢠Changes in lung Compliance/Resistance
⢠Cardiopulmonary resuscitation
66. ABNORMAL CAPNOGRAM AND
CLINICAL CONSIDERATIONS
To analyze the abnormal capnogram, five
characteristics should be inspected:
⢠Size (height)
⢠Shape
⢠Frequency
⢠Rhythm
⢠Baseline
80. A rapid decrease of PETC02 in the absence of changes in
blood pressure, central venous pressure and heart rate indicates
an air embolism without systemic hemodynamic consequences
82. VOLUME CAPNOGRAM
⢠Graphic display of CO2 concentration or partial pressure versus
exhaled volume.
⢠Inspiratory phase is not defined in volume capnogram
Advantages
⢠The volume of CO2 exhaled per breath can be measured.
⢠Significant changes in the morphology of the expired wave form
can be detected in the volume capnogram.
⢠Total physiologic dead space can be measured, using arterial
PCO2 and the Bohr equation, assuming PACO2=PaCO2.
⢠Anatomic dead space can be calculated directly from the volume
capnogram
83.
84.
85. RECENT ADVANCES
Microstream capnography
Side stream capnometers using low flow aspiration rates (50ml/min)
minimizes dispersion of gases in the sampling tubes.
⢠Despite low flows the response time is preserved by using highly CO2
specific infrared source and maintaining laminar gas flow throughout the
breathing circuit.
⢠Useful in neonates and infants with small tidal volumes and high
respiratory rates.
⢠Can be used in adults as well.
86. COMPARISON
⢠Oxygenation is monitored by pulse oximetry whereas Ventilation is
monitored with capnography
⢠Oximeters measure saturated haemoglobin in peripheral blood and
provide additional information about the adequacy of lung perfusion
and oxygen delivery to the tissues. However, pulse oximetry is a late
indicator of O2 supply, and is less sensitive than capnography. It does
not afford a complete picture of ventilatory status.
⢠Capnography continuously and nearly instantaneously measures
pulmonary ventilation and is able to rapidly detect small changes in
cardio-respiratory function before oximeter readings change.
⢠Hypoventilation & hypercarbia may occur without a decrease in Hb
O2 saturation, so pulse oximeter cannot be relied on to detect leaks,
disconnections or esophageal intubations ; whereas capnography can
be reliably used in these conditions.
87. CONCLUSION
â˘Pulse oximetry is simple, convenient , inexpensive tool which has
unique advantage of continuous noninvasive method of measuring Hb
saturation.
â˘Carbon dioxide analysis is a means for assessing metabolism,
circulation and ventilation.
â˘Capnography detects differential diagnosis of hypoxia to enable
remedial measures to be taken before hypoxia results in an irreversible
brain damage.
â˘Capnography and pulse oximetry together prevent 93% of avoidable
anesthesia mishaps.
Carl matthes ( German physician) also called as father of oximetry
HRPO developed for in home sleep apnea screening. It stores n records both pulse rate and spo2 in 1 second interval
Variations in the amplitude of pulse oximetry plethysmographic waveform have been shown to predict fluid responsiveness in mechanically ventilated patients.
An index derived from the percentage of difference between the maximum and minimum amplitudes of pleth waveform during respiratory cycle has been incorporated into commercial pulse oximeter and used to quantify plethysmograpgic waveform and predict fluid responsiveness.
The unknown concentration C is thus inversely proportional to the light path length d and directly proportional to the log of the ratio of incident to transmitted light intensity.
Red and infrared light (wavelength 0.6 to 1.0 micron) are generally used because the constituents of interest to anesthesiologists (volatile anesthetics, CO2, and Hb)
absorb light within that range. Fortunately, both red and infrared light can penetrate soft tissues and may therefore be used to measure the concentrations of Hb species
in vivo . Small molecules absorb infrared light only if they have bonds and are asymmetric; in other words, their molecules have a dipole moment. Therefore nitrogen,
oxygen, and helium cannot be measured by infrared light. Another limitation of infrared light is that ordinary glass absorbs it; therefore the measurement chambers for
these devices must be made of sapphire or other infraredpermeable
materials.
Spectrophotometry is based in Beer Lambert Law of absorption
Conventional pulse oximeters (including all commercial pulse oximeters until 2005) use only two wavelengths of light, typically 660 nm (red light) and
940 nm (near-infrared light). Pulsatile expansion of the arteriolar bed increases the light path length, thereby increasing
absorbency. The pulse oximeter first determines the AC component of absorbance at each wavelength and then divides this value by the DC component to obtain the
pulse-added absorbance, which is independent of the incident light intensity. The oximeter then calculates the ratio (R) of the two pulse-added absorbances (one for
each wavelength):
Finally, the value of R (often called the ratio of ratios) is related to the displayed estimate of saturation of peripheral
oxygen (SpO2) by a âlook-up tableâ programmed into the oximeterâs software.
Each pulse oximeter probe contains LEDs, which emit two wavelengths of light, (red and near infrared) through a cutaneous vascular bed. A photodetector on the other side measures the intensity of transmitted light at each wavelength
Finger is prone to sympathetic vasoconstriction. In case of poor circulation, finger block, digital pulp infiltration or vasodilator.
Nail shades brown, black, blue and green interfere
Other sites : toe, tongue useful in burns patients, cheek more accurate than finger probes, esophagus,
Nose sites- bridge, wings of nostrils, septum
Ear- alcohol/ EMLA can be used to massage the ear 45s before applying the probe
ESOPHAGUS-Uses reflectance oximetry
More consistent and reliable in hemodynamic instability.
FOREHEAD
Just above eyebrow, centered slightly lateral to iris
Less affected by Vasoconstriction,
Disadvantages-Trendelenberg position- Venous Pooling( â SPO2)
OTHER
Pharyngeal
Palm, foot, Ankle
Penis
lower calf or arm in infants
OTHER
Pharyngeal
Palm, foot, Ankle
Penis
lower calf or arm in infants
Oximeter Standards ⢠There must be a means to limit the duration of continuous operation at temperature above 41°C . ⢠The accuracy must be stated over the range of 70% to 100% SpO2. ⢠There must be an indication when the SpO2 or pulse rate data is not current. ⢠It must be provided with an alarm system ⢠There must be an alarm for low SpO2 that is not less than 85% SpO2 . ⢠An indication of signal inadequacy must be provided if the SpO2 or pulse rate value displayed is potentially incorrec
To assess hypoxemia during sleep studies to diagnose obstructive sleep apnoea
Fetal oximetry: performed using a sensor placed transcervically against the fetal cheek.
Four Major Sources of artifacts:
Ambient light; low perfusion (weak AC to DC signal ratio); Venous blood pulsations ( by patient motion); additional light absorbers in the blood
Sources of artifacts produce low signal to noise rationresulting in erroneous spo2 values.
Methhemoglobin: pulse oximetere give falsely low readings for saturations >85% and falsly high readings for saturations<85%. It impairs the unloading of oxygen to tissue by forming a reversible complex with it.
Carboxyhemoglobin: aborption spectrum similar to oxyhemoglobin. So pulse oximeters will overread spo2 by the percentage of COHb present.
Absence of pulsatile artial signal during extreme hypothermia or hypoperfusion can limit ability of pulse oximeter
Due to longer averaging period, response to any acute change in SaO2 may result in âFrozenâ SpO2
.
Surgical stereotactic positioning systems that make use of IR position sensors interfere with the pulse ox readings.
In new signal-processing algorithm developed by Masimo, Inc., the oximeter acctually computes a venous noise reference signal, which is common to both light wavelengths. The noise reference signal is then subtracted from the total signal and a true arterial signal is left.
This is one of the five âparallel engineâ algorithms that Masimo SET (Signal Extraction Technology) simultaneously uses to find the most reliable SpO2 value for the current signal conditions.
EMLA cream prilo +lido 2.5% each
Although mixed venous hemoglobin saturation may be determined by intermittent blood sampling from thedistal port of PAC, a specially designed PAC can provide
this information reliably and continuously. Fiberopticbundles incorporated into PAC determine the hemoglobinoxygen saturation in pulmonary artery blood. A special computer connected to this PAC displays the mixed venous hemoglobin saturation continuously. The technology is typically incorporated into the standard PAC or the continuous
cardiac output PAC (see later), in the latter case providing both continuous cardiac output and venous oximetry data.
Technical problems with continuous mixed venous oximetry are generally limited to improper PAC tip positioning against the vessel wall or inaccurate calibration.
Multi-wavelength fiberoptic technology and reflection intensity algorithms help to reduce wall artifacts caused by spurious reflections from a PAC thrombus or the pulmonary
arterial walls.
capno greek word meaning smoke. Capnometer is the device that performs the measurement.
URAS- Ultra Rot Absorption Schreiber
Assessment of CO2 production, pulmonary perfusion, alveolar ventilation, respiratory patterns, and elimination of CO2 from the anaesthesia circuit and ventilator.
However, ETCO2 is a reliable indicator of metabolism in mechanically ventilated patients more than spontaneously breathing patients.
Many gases absorb infrared energy at a specific wavelength. This property used for measuring concentration of gas.
Raman spectrography uses the priniciple of raman scattering for co2 measurement.
Mass spectrograph separates molecules on the basis of mass to charge ratios.
Photoacoustic: same principles as IR based analyzers but PAS uses acoustic technique for measurement of concentration of a gas.
Because the absorption spectrum for CO2 partially overlaps with the spectra of other gaseous species commonly encountered in anesthesia (i.e., waterand nitrous oxide), infrared filters and compensation algorithms are used to minimize this interference and improve accuracy.
Capnometry is measurement and quantification of inhaled or exhaled CO2 concentrations at the airway opening.
Capnometer is a device that measures CO2 concentrations.
Gas withdrawal rates may vary from 30 to 500 mL/minute.
This lost gas volume may need to be considered during closed-circuit anesthesia or during ventilation of neonates and infants. The volume can be returned to the circuit, or it can be routed to a scavenger to prevent contamination of the environment with anesthetic or waste gases
. Gases must also pass through various filters and water traps before they are presented to the sample.
Rise time usually the time interval required for the output to change from 10-70%. Commercial capnometers take 10-400msec
Capnogram refers to a graphical display that capnograph generates; CO2 waveform.
Alveolar Plateau (phase III) has positive slope due toContinuous excretion of CO2Â into the alveoli becoming progressively smaller.
Late emptying of alveoli with low V/Q ratio containing relatively higher CO2Â concentration.
PetCO2 refers to the final value of exhaled Pco2 curve, at the very end of expiratory phase
Phase IV This upstroke results from the closure of lung units with lower Pco2 and allows the regions of higher CO2 to contribute a greater proportion of the exhaled gas to be sampled. From this point patient starts to inhale again.
Decreased- obstructive lung disease- As dead space volume takes longer to be exhaled.
Cardiac output- amount of blood the LV ejects into systemic circulation in one minute SV*HR= CO
Cardiac index - CO per min per BSA
Cardiac reserve is ( CO at rest - max vol blood heart can pump per min)
Golden number is 8, when ET co2 40, CO= 8
(a-Et)Pco2 difference is because of the dilution of the alveolar gas with the dead space gas.
⢠âCO2 PRODUCTION &
DELIVERY TO LUNGS
ďâmetabolic rate ďFever ďSepsis ďSeizures
ďMalignant hypothermia ďThyrotoxicosis
ďâCardiac output (during CPR) ďBicarbonate administration
⢠âALVEOLAR VENTILATION
ďHypoventilation ďRespiratory centre depression ďPartial muscular paralysis
ďNeuromuscular disease ďCOPD
⢠EQUIPMENT MALFUNCTION
ďRebreathing ďExhausted C02 absorber
ďLeak in ventilator circuit ďFaulty inspiratory/ expiratory valve
⢠â CO2 PRODUCTION AND
DELIVERY TO LUNGS
ďHypothermia ďPulmonary hypoperfusion
ďCardiac arrest ďPulmonaryembolism
ďHaemorrhage ďHypotension
⢠âALVEOLAR VENTILATION
ďHyperventilation
⢠EQUIPMENT MALFUNCTION
ďVentilator disconnect ďEsophageal intubation
ďComplete airway obstruction ďPoor sampling
ďLeak around ETT cuff
During hyperventilation, base line remains at zero. However, the height of the capnograms decrease gradually. Progressive depression of cardiac out or metabolism can also decrease the height of the capnograms. During hypoventilation There is a progressively increasing end-tidal PCO2 values. Base line remaining at zero. The shape of the waveform remains normal.
Plateau is prolonged due to rebreathing
An incompetent inspiratory valve will allow exhaled CO2- containing gas to enter the inspiratory limb of the circuit during expiration. During the next inspiration, the CO2-containing gas in the inspiratory limb enters the patient, extending the expiratory alveolar plateau (phase III) of the time capnogram
The capnogram shows prolonged phase II as well as slanting of descending limb of inspiratory segement. The expiratory unidirectional valve was noted to be fixed in the open position and thus allowing previously exhaled gases, high in CO2, to be rebreathed with each inspiration. The CO2 waveform returned to normal soon after the valve was removed, cleaned, dried, and replaced.
Carbon dioxide waveform recorded in a patient with severe kypho-scoliosis. The CO2 waveform has two humps. Kyphoscoliosis resulted in a compression of the right lung. The compressed right lung had a relatively high airway resistance, was poorly ventilated, and was relatively hypercapnic, whereas the left lung had a relatively low airway resistance, was hyperventilated, and was relatively hypocapnic. Under these circumstances, relatively hypocapnic gas from well ventilated, low airway resistance lung reached the CO2 analyzer first causing first distinct low peak, and relatively hypercapnic gas from poorly ventilated, high airway resistance lung reached the CO2 analyzer last causing second distinct high peak.
Biphasic capnogram recorded in a patient after single lung transplantation. This is due to different populations of alveoli. The first peak represents expired carbon dioxide from allografted lung, which has normal compliance, good perfusion, and good ventilation-perfusion ratios (V/Q). The second peak most likely reflects expired carbon dioxide from the native lung, because of slanted upstroke or steeper plateau is characteristic of the mismatched V/Q ratios and differing alveolar time constants in emphysema. Independent of the perfusion characteristics of the two lungs, the differences in their compliance alone could account for the observed biphasic capnogram, with the transplanted lung emptying more rapidly than the native lung.
This capnogram occurs due to sampling leaks in the sampling tube cracks, or a loose connection between sampling tubes and the monitor. It has also been reported due to breaks in the water filter of the carbon dioxide analyzer.
capnogram with a "tail up" as shown below during the use of an accidentally crushed sampling tube with a slit-like hole. "tail up" capnogram with lower end-tidal CO2 values with slit the sampling tubes as compared to the intact sampling tubes during IPPV. However, during spontaneous ventilation no such deformity was observed, although end-tidal CO2 was lower than the normal.
A similar mechanism as described above may be operative during IPPV. However, during spontaneous ventilation, there is no positive pressure (infact, there is slight negative pressure) and therefore, the dilution of sampling gases through the leak continue in both phases of respiratory cycle. This gives a normal shape to the capnograms, but with lower end-tidal CO2 values as compared to intact or undamaged sampling tubes.
The volume capnogram is a plot of the fraction of carbon dioxide (Fco2) in exhaled gas versus exhaled volume.
It is dividedinto three phases, which reflect the same sources of expired gas as present in the time capnograph:
anatomic dead space (phase I, red),
transitional (phase II, blue),
alveolar gas (phase III, green).
Thevolume capnogram allows for the partition of total tidal volume (VT)
airway dead space volume (VDaw)
an effective alveolar tidal volume (VTalv) by a vertical line through phase II, positioned such that the approximately triangular areas p and q are equal.
It also provides the slope of phase III as a quantitative measure of the heterogeneity of alveolar ventilation.
The total area below the horizontal line (denotingthe Fco2 of a gas in equilibrium with arterial blood) can be dividedinto three distinct areas: X, Y, and Z.
Area X corresponds to the total volume of CO2 exhaled over a tidal breath. This value can be used to compute the CO2 production (vË co2) the mixed expired CO2
fraction or partial pressure (Pco2) to be used in the Bohr equation based on the division of the exhaled CO2 volume by the
exhaled tidal volume.
Area Y represents wasted ventilation secondary to alveolar dead space
area Z corresponds to wasted ventilation secondary to anatomic dead space (VDaw). Thus, areas Y + Z represent the total physiologic dead space.
The volume capnogram can also be plotted as a Pco2 versus exhaled volume curve. Fetco2, Fraction
of end-tidal CO2.