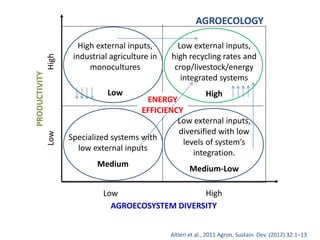
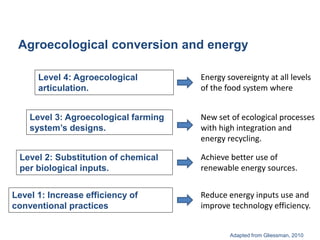
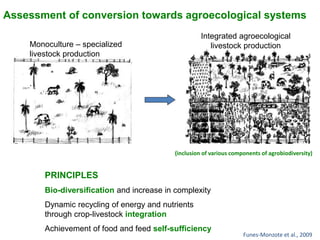
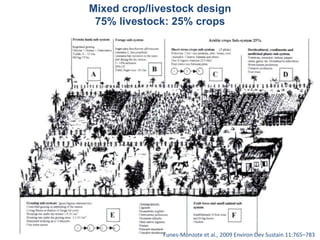
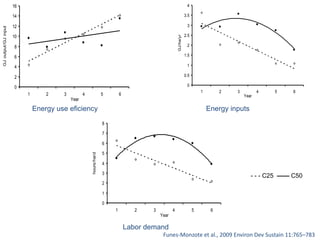
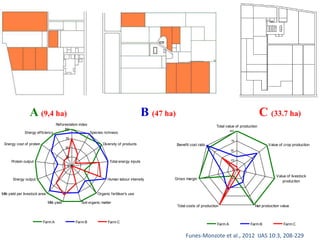
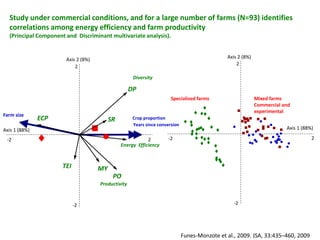
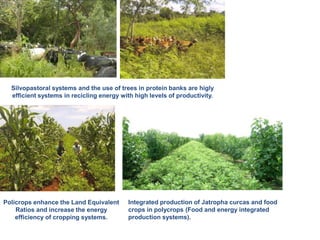
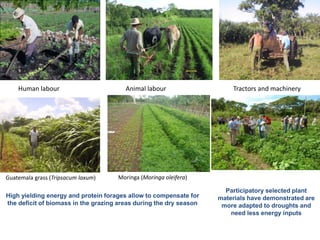
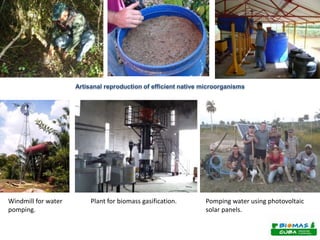
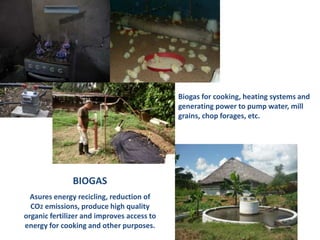
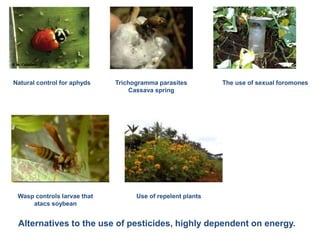
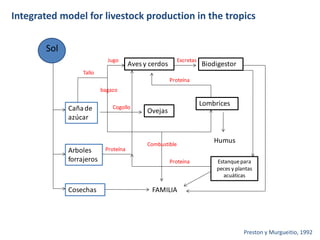
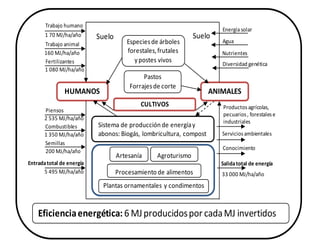
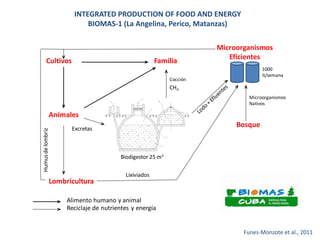
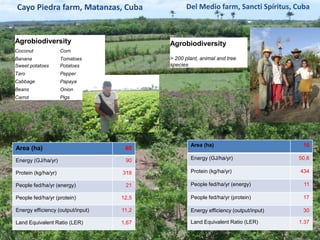
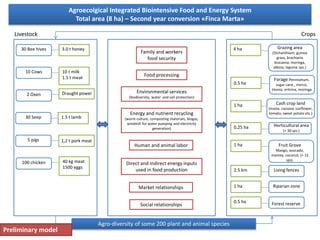
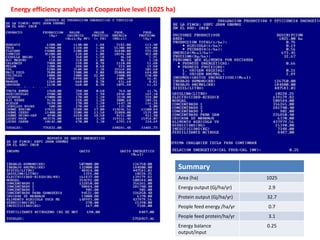
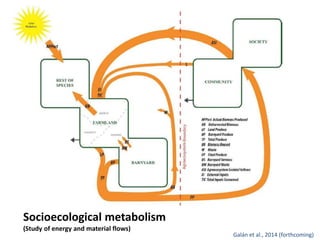
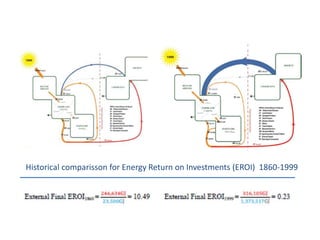
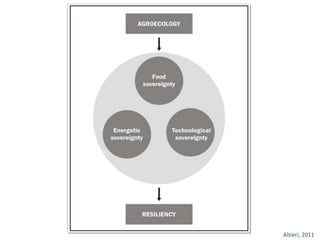
Agroecology and energy 
Fernando R. Funes-Monzote, PhD. 
Agroecologist 
Researcher, profesor and farmer 
Vice-president of Latin American Scientific Society for Agroecology (SOCLA) 
Apartado 4029, C.P. 10400, Ciudad de La Habana, Cuba, 
e-mail: mgahonam@enet.cu 
https://www.facebook.com/fincamartam 
FAO, Rome, 18 Sept, 2014
Altieri, 2011
AGROECOLOGY 
Low external inputs, 
high recycling rates and 
crop/livestock/energy 
integrated systems 
High 
High external inputs, 
industrial agriculture in 
ENERGY 
EFFICIENCY 
monocultures 
Low 
Low external inputs, 
diversified with low 
levels of system’s 
integration. 
Medium-Low 
Specialized systems with 
low external inputs 
Medium 
AGROECOSYSTEM DIVERSITY 
PRODUCTIVITY 
High 
Low 
Low 
High 
Altieri et al., 2011 Agron. Sustain. Dev. (2012) 32:1–13
Agroecological conversion and energy 
Level 3: Agroecological farming 
system’s designs. 
Level 2: Substitution of chemical 
per biological inputs. 
Level 1: Increase efficiency of 
conventional practices 
Energy sovereignty at all levels 
of the food system where 
New set of ecological processes 
with high integration and 
energy recycling. 
Achieve better use of 
renewable energy sources. 
Adapted from Gliessman, 2010 
Level 4: Agroecological 
articulation. 
Reduce energy inputs use and 
improve technology efficiency.
Assessment of conversion towards agroecological systems 
Monoculture – specialized 
livestock production 
Integrated agroecological 
livestock production 
(inclusion of various components of agrobiodiversity) 
PRINCIPLES 
Bio-diversification and increase in complexity 
Dynamic recycling of energy and nutrients 
through crop-livestock integration 
Achievement of food and feed self-sufficiency 
Funes-Monzote et al., 2009
Mixed crop/livestock design 
75% livestock: 25% crops 
Funes-Monzote et al., 2009 Environ Dev Sustain 11:765–783
16 
14 
12 
10 
8 
6 
4 
2 
0 
1 2 3 4 5 6 
Year 
GJ output/GJ input 
4 
3.5 
3 
2.5 
2 
1.5 
1 
0.5 
0 
1 2 3 4 5 6 
Year 
GJ/ha/yr 
Energy use eficiency Energy inputs 
8 
7 
6 
5 
4 
3 
2 
1 
0 
1 2 3 4 5 6 
Year 
hours/ha/d 
Labor demand 
- - - C25 —— C50 
Funes-Monzote et al., 2009 Environ Dev Sustain 11:765–783
A (9,4 ha) B (47 ha) C (33.7 ha) 
Reforestation index 
100 
75 
50 
25 
0 
Species richness 
Diversity of products 
Total energy inputs 
Human labour intensity 
Organic fertiliser's use 
Energy ef f iciency 
Milk yield Soil organic matter 
Energy cost of protein 
Protein output 
Energy output 
Milk yield per livestock area 
Farm A Farm B Farm C 
Total value of production 
100 
75 
50 
25 
0 
Value of crop production 
Value of livestock 
production 
Benef it cost ratio 
Gross margin 
Total costs of production Net production value 
Farm A Farm B Farm C 
Funes-Monzote et al., 2012 IJAS 10:3, 208-229
Study under commercial conditions, and for a large number of farms (N=93) identifies 
correlations among energy efficiency and farm productivity 
(Principal Component and Discriminant multivariate analysis). 
Axis 1 (88%) 
2 
Axis 2 (8%) 
2 
Specialised farms Mixed farms 
● ■ ● 
Axis 2 (8%) 
ECP Crop proportion 
●  
-2 
-2 
Commercial and 
experimental 
 
 
 
 
 
 
 
  
 
 
 
 
 
 
 
 
 
 
 
 
 
  
■ 
■ 
■■ 
■■■■ 
■■ 
■ ■ 
■ ■ 
■ 
■■ 
■ 
●● ● 
● 
●● 
■ 
■ 
■ 
■ 
● 
● 
● 
●● 
●■ 
● ● 
● 
● 
●● ● ●● 
■ 
● 
Diversity 
Energy Efficiency 
PO 
TEI MY 
Farm size 
Axis 1 (88%) 
Years since conversion 
2 
-2 2 
-2 
Productivity 
DP 
SR 
Funes-Monzote et al., 2009. JSA, 33:435–460, 2009
Silvopastoral systems and the use of trees in protein banks are higly 
efficient systems in recicling energy with high levels of productivity. 
Policrops enhance the Land Equivalent 
Ratios and increase the energy 
efficiency of cropping systems. 
Integrated production of Jatropha curcas and food 
crops in polycrops (Food and energy integrated 
production systems).
Human labour Animal labour Tractors and machinery 
Guatemala grass (Tripsacum laxum) Moringa (Moringa oleifera) 
High yielding energy and protein forages allow to compensate for 
the deficit of biomass in the grazing areas during the dry season 
Participatory selected plant 
materials have demonstrated are 
more adapted to droughts and 
need less energy inputs
Artisanal reproduction of efficient native microorganisms 
Windmill for water 
pomping. 
Plant for biomass gasification. Pomping water using photovoltaic 
solar panels.
Biogas for cooking, heating systems and 
generating power to pump water, mill 
grains, chop forages, etc. 
BIOGAS 
Asures energy recicling, reduction of 
CO2 emissions, produce high quality 
organic fertilizer and improves access to 
energy for cooking and other purposes.
Natural control for aphyds Trichogramma parasites 
Cassava spring 
The use of sexual foromones 
Wasp controls larvae that 
atacs soybean 
Use of repelent plants 
Alternatives to the use of pesticides, highly dependent on energy.
Integrated model for livestock production in the tropics 
Sol 
Caña de 
azúcar 
Arboles 
forrajeros 
Cosechas 
Jugo 
Aves y cerdos 
Excretas 
Biodigestor 
FAMILIA 
Lombrices 
Humus 
Estanque para 
peces y plantas 
acuáticas 
Ovejas 
Tallo 
bagazo 
Cogollo 
Proteína 
Proteína 
Proteína 
Combustible 
Preston y Murgueitio, 1992
Energía solar 
Agua 
Nutrientes 
HUMANOS ANIMALES 
Productos agrícolas, 
pecuarios , forestales e 
industriales 
Suelo Suelo 
Trabajo humano 
1 70 MJ/ha/año 
Trabajo animal 
160 MJ/ha/año 
Fertilizantes 
1 080 MJ/ha/año 
Piensos 
2 535 MJ/ha/año 
Sistema de producción de energía y 
abonos: Biogás, lombricultura, compost 
Combustibles 
1 350 MJ/ha/año Servicios ambientales 
Conocimiento 
Salida total de energía 
Especies de árboles 
forestales, frutales 
y postes vivos 
Pastos 
Forrajes de corte 
CULTIVOS 
Artesanía Agroturismo 
Procesamiento de alimentos 33 000 MJ/ha/año 
Semillas 
200 MJ/ha/año 
Entrada total de energía 
5 495 MJ/ha/año 
Plantas ornamentales y condimentos 
Diversidad genética 
Eficiencia energética: 6 MJ producidos por cada MJ invertidos
Microorganismos 
Eficientes 
Cultivos Familia 
Biodigestor 25 m3 
Animales 
Cocción 
Excretas 
Alimento humano y animal 
Reciclaje de nutrientes y energía 
CH4 
Lombricultura 
Lixiviados 
Microorganismos 
Nativos 
Bosque 
Humus de lombriz 
1000 
lt/semana 
INTEGRATED PRODUCTION OF FOOD AND ENERGY 
BIOMAS-1 (La Angelina, Perico, Matanzas) 
Funes-Monzote et al., 2011
Cayo Piedra farm, Matanzas, Cuba Del Medio farm, Sancti Spíritus, Cuba 
Agrobiodiversity 
Coconut Corn 
Banana Tomatoes 
Sweet potatoes Potatoes 
Taro Pepper 
Cabbage Papaya 
Beans Onion 
Carrot Pigs 
Area (ha) 40 
Energy (GJ/ha/yr) 90 
Protein (kg/ha/yr) 318 
People fed/ha/yr (energy) 21 
People fed/ha/yr (protein) 12,5 
Energy efficiency (output/input) 11,2 
Land Equivalent Ratio (LER) 1,67 
Agrobiodiversity 
> 200 plant, animal and tree 
species 
Area (ha) 10 
Energy (GJ/ha/yr) 50,6 
Protein (kg/ha/yr) 434 
People fed/ha/yr (energy) 11 
People fed/ha/yr (protein) 17 
Energy efficiency (output/input) 30 
Land Equivalent Ratio (LER) 1.37
Abbona et al., 2006
Agroecolgical Integrated Biointensive Food and Energy System 
Total area (8 ha) – Second year conversion «Finca Marta» 
Livestock Crops 
30 Bee hives 
10 Cows 
2 Oxen 
30 Seep 
5 pigs 
100 chicken 
3.0 t honey 
10 t milk 
1.5 t meat 
Draught power 
1.5 t lamb 
1,2 t pork meat 
40 kg meat 
1500 eggs 
Grazing area 
(Dichanthium, guinea 
grass, brachiaria 
leucaena, moringa, 
albizia, legume sps.) 
4 ha 
Forage:Pennisetum, 
sugar cane , morus, 
titonia, eritrina, moringa 
Horticultural area 
(+ 30 sps.) 
0.5 ha 
0.25 ha 
Fruit Grove 
Mango, avocado, 
mamey, coconut, (+ 15 
sps). 
1 ha 
1 ha Riparian zone 
0.5 ha Forest reserve 
Family and workers 
food security 
Food processing 
Environmental services 
(biodiversity, water and soil protection) 
Energy and nutrient recycling 
(worm culture, composting materials, biogas, 
windmill for water pumping and electricity 
generation) 
Cash crop land 
(maize, cassava, sunflower, 
tomato, sweet potato etc.) 
1 ha 
2.5 km Living fences 
Human and animal labor 
Direct and indirect energy inputs 
used in food production 
Market relationships 
Social relationships 
Agro-diversity of some 200 plant and animal species 
Preliminary model
COMPUTARIZED SYSTEM ENERGIA 3.01 
Energy efficiency 
calculations 
Methodology 
Report
Energy efficiency analysis at Cooperative level (1025 ha) 
Summary 
Area (ha) 1025 
Energy output (Gj/ha/yr) 2.9 
Protein output (Gj/ha/yr) 32.7 
People feed energy /ha/yr 0.7 
People feed protein/ha/yr 3.1 
Energy balance 
0.25 
output/input
Farm 
Cayo Piedra 
Perico 
Cooperative 
Juan Oramas 
Bacuranao 
Municipality Martí 
(22343 
inhabitants) 
Total area (ha) 40 1025 55577 
Labour intensity (hr/ha/day) 0,95 
(medium) 
0,34 
(low) 
0,35 
(low) 
Energy (GJ/ha/yr) 90 
(high) 
2,9 
(low) 
5,7 
(low) 
Protein (kg/ha/yr) 318 
(high) 
32,7 
(low) 
89,3 
(low) 
People feed/ha/yr (energy) 21 
(high) 
0,7 
(low) 
1,0 
(low) 
People feed/ha/yr (protein) 12,5 
(high) 
3,1 
(low) 
3,1 
(low) 
Total no. People feed Energy 840 
Protein 500 
718 
3176 
55577 
172288 
Energy efficiency (output/input) 11,2 
(high) 
0,25 
(low) 
0,76 
(low) 
Energy cost of protein (MJ/kg) 27,3 
Medium 
190,7 
High 
70,8 
High 
Energy efficiency (analysis at three scales)
Socioecological metabolism 
(Study of energy and material flows) 
Galán et al., 2014 (forthcoming)
Historical comparisson for Energy Return on Investments (EROI) 1860-1999
Altieri, 2011
Agroecology and energy 
Thank you 
very much! 
Fernando R. Funes-Monzote, PhD. 
Agroecologist 
Researcher, profesor and farmer 
Vice-president of Latin American Scientific Society for Agroecology (SOCLA) 
Apartado 4029, C.P. 10400, Ciudad de La Habana, Cuba, 
e-mail: mgahonam@enet.cu 
https://www.facebook.com/fincamartam 
FAO, Rome, 18 Sept, 2014

Agroecology and energy

  • 1.
    Agroecology and energy Fernando R. Funes-Monzote, PhD. Agroecologist Researcher, profesor and farmer Vice-president of Latin American Scientific Society for Agroecology (SOCLA) Apartado 4029, C.P. 10400, Ciudad de La Habana, Cuba, e-mail: mgahonam@enet.cu https://www.facebook.com/fincamartam FAO, Rome, 18 Sept, 2014
  • 2.
  • 3.
    AGROECOLOGY Low externalinputs, high recycling rates and crop/livestock/energy integrated systems High High external inputs, industrial agriculture in ENERGY EFFICIENCY monocultures Low Low external inputs, diversified with low levels of system’s integration. Medium-Low Specialized systems with low external inputs Medium AGROECOSYSTEM DIVERSITY PRODUCTIVITY High Low Low High Altieri et al., 2011 Agron. Sustain. Dev. (2012) 32:1–13
  • 4.
    Agroecological conversion andenergy Level 3: Agroecological farming system’s designs. Level 2: Substitution of chemical per biological inputs. Level 1: Increase efficiency of conventional practices Energy sovereignty at all levels of the food system where New set of ecological processes with high integration and energy recycling. Achieve better use of renewable energy sources. Adapted from Gliessman, 2010 Level 4: Agroecological articulation. Reduce energy inputs use and improve technology efficiency.
  • 5.
    Assessment of conversiontowards agroecological systems Monoculture – specialized livestock production Integrated agroecological livestock production (inclusion of various components of agrobiodiversity) PRINCIPLES Bio-diversification and increase in complexity Dynamic recycling of energy and nutrients through crop-livestock integration Achievement of food and feed self-sufficiency Funes-Monzote et al., 2009
  • 6.
    Mixed crop/livestock design 75% livestock: 25% crops Funes-Monzote et al., 2009 Environ Dev Sustain 11:765–783
  • 7.
    16 14 12 10 8 6 4 2 0 1 2 3 4 5 6 Year GJ output/GJ input 4 3.5 3 2.5 2 1.5 1 0.5 0 1 2 3 4 5 6 Year GJ/ha/yr Energy use eficiency Energy inputs 8 7 6 5 4 3 2 1 0 1 2 3 4 5 6 Year hours/ha/d Labor demand - - - C25 —— C50 Funes-Monzote et al., 2009 Environ Dev Sustain 11:765–783
  • 8.
    A (9,4 ha)B (47 ha) C (33.7 ha) Reforestation index 100 75 50 25 0 Species richness Diversity of products Total energy inputs Human labour intensity Organic fertiliser's use Energy ef f iciency Milk yield Soil organic matter Energy cost of protein Protein output Energy output Milk yield per livestock area Farm A Farm B Farm C Total value of production 100 75 50 25 0 Value of crop production Value of livestock production Benef it cost ratio Gross margin Total costs of production Net production value Farm A Farm B Farm C Funes-Monzote et al., 2012 IJAS 10:3, 208-229
  • 9.
    Study under commercialconditions, and for a large number of farms (N=93) identifies correlations among energy efficiency and farm productivity (Principal Component and Discriminant multivariate analysis). Axis 1 (88%) 2 Axis 2 (8%) 2 Specialised farms Mixed farms ● ■ ● Axis 2 (8%) ECP Crop proportion ●  -2 -2 Commercial and experimental                         ■ ■ ■■ ■■■■ ■■ ■ ■ ■ ■ ■ ■■ ■ ●● ● ● ●● ■ ■ ■ ■ ● ● ● ●● ●■ ● ● ● ● ●● ● ●● ■ ● Diversity Energy Efficiency PO TEI MY Farm size Axis 1 (88%) Years since conversion 2 -2 2 -2 Productivity DP SR Funes-Monzote et al., 2009. JSA, 33:435–460, 2009
  • 10.
    Silvopastoral systems andthe use of trees in protein banks are higly efficient systems in recicling energy with high levels of productivity. Policrops enhance the Land Equivalent Ratios and increase the energy efficiency of cropping systems. Integrated production of Jatropha curcas and food crops in polycrops (Food and energy integrated production systems).
  • 11.
    Human labour Animallabour Tractors and machinery Guatemala grass (Tripsacum laxum) Moringa (Moringa oleifera) High yielding energy and protein forages allow to compensate for the deficit of biomass in the grazing areas during the dry season Participatory selected plant materials have demonstrated are more adapted to droughts and need less energy inputs
  • 12.
    Artisanal reproduction ofefficient native microorganisms Windmill for water pomping. Plant for biomass gasification. Pomping water using photovoltaic solar panels.
  • 13.
    Biogas for cooking,heating systems and generating power to pump water, mill grains, chop forages, etc. BIOGAS Asures energy recicling, reduction of CO2 emissions, produce high quality organic fertilizer and improves access to energy for cooking and other purposes.
  • 14.
    Natural control foraphyds Trichogramma parasites Cassava spring The use of sexual foromones Wasp controls larvae that atacs soybean Use of repelent plants Alternatives to the use of pesticides, highly dependent on energy.
  • 15.
    Integrated model forlivestock production in the tropics Sol Caña de azúcar Arboles forrajeros Cosechas Jugo Aves y cerdos Excretas Biodigestor FAMILIA Lombrices Humus Estanque para peces y plantas acuáticas Ovejas Tallo bagazo Cogollo Proteína Proteína Proteína Combustible Preston y Murgueitio, 1992
  • 16.
    Energía solar Agua Nutrientes HUMANOS ANIMALES Productos agrícolas, pecuarios , forestales e industriales Suelo Suelo Trabajo humano 1 70 MJ/ha/año Trabajo animal 160 MJ/ha/año Fertilizantes 1 080 MJ/ha/año Piensos 2 535 MJ/ha/año Sistema de producción de energía y abonos: Biogás, lombricultura, compost Combustibles 1 350 MJ/ha/año Servicios ambientales Conocimiento Salida total de energía Especies de árboles forestales, frutales y postes vivos Pastos Forrajes de corte CULTIVOS Artesanía Agroturismo Procesamiento de alimentos 33 000 MJ/ha/año Semillas 200 MJ/ha/año Entrada total de energía 5 495 MJ/ha/año Plantas ornamentales y condimentos Diversidad genética Eficiencia energética: 6 MJ producidos por cada MJ invertidos
  • 17.
    Microorganismos Eficientes CultivosFamilia Biodigestor 25 m3 Animales Cocción Excretas Alimento humano y animal Reciclaje de nutrientes y energía CH4 Lombricultura Lixiviados Microorganismos Nativos Bosque Humus de lombriz 1000 lt/semana INTEGRATED PRODUCTION OF FOOD AND ENERGY BIOMAS-1 (La Angelina, Perico, Matanzas) Funes-Monzote et al., 2011
  • 18.
    Cayo Piedra farm,Matanzas, Cuba Del Medio farm, Sancti Spíritus, Cuba Agrobiodiversity Coconut Corn Banana Tomatoes Sweet potatoes Potatoes Taro Pepper Cabbage Papaya Beans Onion Carrot Pigs Area (ha) 40 Energy (GJ/ha/yr) 90 Protein (kg/ha/yr) 318 People fed/ha/yr (energy) 21 People fed/ha/yr (protein) 12,5 Energy efficiency (output/input) 11,2 Land Equivalent Ratio (LER) 1,67 Agrobiodiversity > 200 plant, animal and tree species Area (ha) 10 Energy (GJ/ha/yr) 50,6 Protein (kg/ha/yr) 434 People fed/ha/yr (energy) 11 People fed/ha/yr (protein) 17 Energy efficiency (output/input) 30 Land Equivalent Ratio (LER) 1.37
  • 19.
  • 20.
    Agroecolgical Integrated BiointensiveFood and Energy System Total area (8 ha) – Second year conversion «Finca Marta» Livestock Crops 30 Bee hives 10 Cows 2 Oxen 30 Seep 5 pigs 100 chicken 3.0 t honey 10 t milk 1.5 t meat Draught power 1.5 t lamb 1,2 t pork meat 40 kg meat 1500 eggs Grazing area (Dichanthium, guinea grass, brachiaria leucaena, moringa, albizia, legume sps.) 4 ha Forage:Pennisetum, sugar cane , morus, titonia, eritrina, moringa Horticultural area (+ 30 sps.) 0.5 ha 0.25 ha Fruit Grove Mango, avocado, mamey, coconut, (+ 15 sps). 1 ha 1 ha Riparian zone 0.5 ha Forest reserve Family and workers food security Food processing Environmental services (biodiversity, water and soil protection) Energy and nutrient recycling (worm culture, composting materials, biogas, windmill for water pumping and electricity generation) Cash crop land (maize, cassava, sunflower, tomato, sweet potato etc.) 1 ha 2.5 km Living fences Human and animal labor Direct and indirect energy inputs used in food production Market relationships Social relationships Agro-diversity of some 200 plant and animal species Preliminary model
  • 21.
    COMPUTARIZED SYSTEM ENERGIA3.01 Energy efficiency calculations Methodology Report
  • 22.
    Energy efficiency analysisat Cooperative level (1025 ha) Summary Area (ha) 1025 Energy output (Gj/ha/yr) 2.9 Protein output (Gj/ha/yr) 32.7 People feed energy /ha/yr 0.7 People feed protein/ha/yr 3.1 Energy balance 0.25 output/input
  • 23.
    Farm Cayo Piedra Perico Cooperative Juan Oramas Bacuranao Municipality Martí (22343 inhabitants) Total area (ha) 40 1025 55577 Labour intensity (hr/ha/day) 0,95 (medium) 0,34 (low) 0,35 (low) Energy (GJ/ha/yr) 90 (high) 2,9 (low) 5,7 (low) Protein (kg/ha/yr) 318 (high) 32,7 (low) 89,3 (low) People feed/ha/yr (energy) 21 (high) 0,7 (low) 1,0 (low) People feed/ha/yr (protein) 12,5 (high) 3,1 (low) 3,1 (low) Total no. People feed Energy 840 Protein 500 718 3176 55577 172288 Energy efficiency (output/input) 11,2 (high) 0,25 (low) 0,76 (low) Energy cost of protein (MJ/kg) 27,3 Medium 190,7 High 70,8 High Energy efficiency (analysis at three scales)
  • 24.
    Socioecological metabolism (Studyof energy and material flows) Galán et al., 2014 (forthcoming)
  • 25.
    Historical comparisson forEnergy Return on Investments (EROI) 1860-1999
  • 26.
  • 27.
    Agroecology and energy Thank you very much! Fernando R. Funes-Monzote, PhD. Agroecologist Researcher, profesor and farmer Vice-president of Latin American Scientific Society for Agroecology (SOCLA) Apartado 4029, C.P. 10400, Ciudad de La Habana, Cuba, e-mail: mgahonam@enet.cu https://www.facebook.com/fincamartam FAO, Rome, 18 Sept, 2014