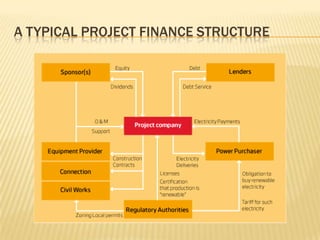
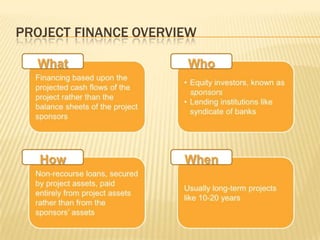
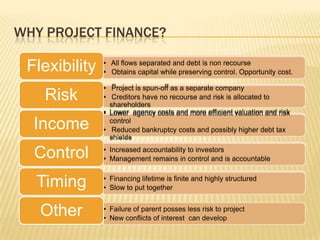
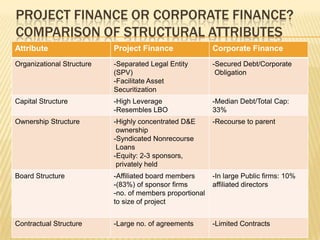
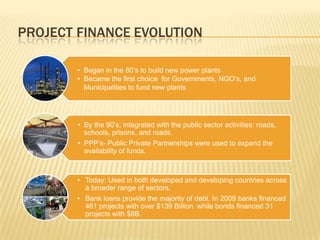
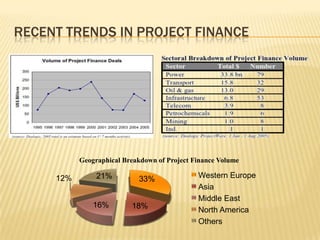
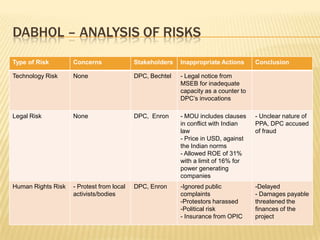
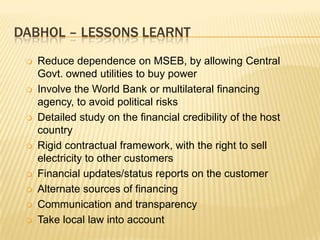
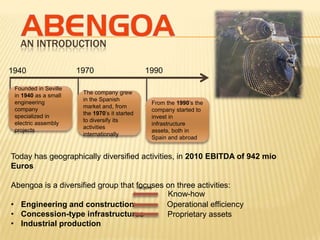
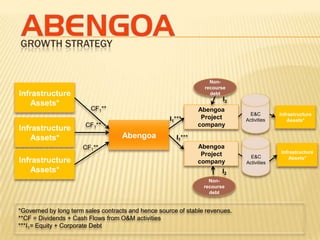
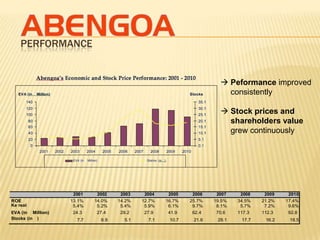
PROJECT FINANCE     •Anurag Jaiswal
                    •Akanksha Agarwal
Corporate Finance   •Alessio Tixi
                    •Diego Castañeda
                    •Leidy Suarez
                    •Prateek Singh
A TYPICAL PROJECT FINANCE STRUCTURE
PROJECT FINANCE OVERVIEW

  What                Who


   How                When
WHY PROJECT FINANCE?
               • All flows separated and debt is non recourse
 Flexibility   • Obtains capital while preserving control. Opportunity cost.

               • Project is spun-off as a separate company
    Risk       • Creditors have no recourse and risk is allocated to
                 shareholders
               • Lower agency costs and more efficient valuation and risk
                 control
  Income       • Reduced bankruptcy costs and possibly higher debt tax
                 shields
               •   Increased accountability to investors
  Control      •   Management remains in control and is accountable

               • Financing lifetime is finite and highly structured
  Timing       • Slow to put together


   Other       • Failure of parent posses less risk to project
               • New conflicts of interest can develop
PROJECT FINANCE OR CORPORATE FINANCE?
COMPARISON OF STRUCTURAL ATTRIBUTES
Attribute                  Project Finance                Corporate Finance
Organizational Structure   -Separated Legal Entity        -Secured Debt/Corporate
                           (SPV)                           Obligation
                           -Facilitate Asset
                           Securitization
Capital Structure          -High Leverage                 -Median Debt/Total Cap:
                           -Resembles LBO                 33%
Ownership Structure        -Highly concentrated D&E       -Recourse to parent
                            ownership
                           -Syndicated Nonrecourse
                            Loans
                           -Equity: 2-3 sponsors,
                            privately held
Board Structure            -Affiliated board members      -In large Public firms: 10%
                           -(83%) of sponsor firms        affiliated directors
                           -no. of members proportional
                           to size of project


Contractual Structure      -Large no. of agreements       -Limited Contracts
DISADVANTAGES OF PROJECT FINANCE

 Higher transactions costs involved
 Contracts can be very complex and allow
  less managerial flexibility
 Takes more time to structure and negotiate

 Project debt can be more expensive

 Requires greater disclosure of proprietary
  information
PROJECT FINANCE EVOLUTION

        • Began in the 80’s to build new power plants
        • Became the first choice for Governments, NGO’s, and
          Municipalities to fund new plants


        • By the 90’s, integrated with the public sector activities: roads,
          schools, prisons, and roads.
        • PPP’s- Public Private Partnerships were used to expand the
          availability of funds.


        • Today: Used in both developed and developing countries across
          a broader range of sectors.
        • Bank loans provide the majority of debt. In 2009 banks financed
          461 projects with over $139 Billion while bonds financed 31
          projects with $8B.
RECENT TRENDS IN PROJECT FINANCE


           Geographical Breakdown of Project Finance Volume

     12%        21%         33%               Western Europe
                                              Asia
                                              Middle East
               16%        18%                 North America
                                              Others
PROJECT FINANCE IN DEVELOPING COUNTRIES


  GDP        is driven by                  is boosted by
                            Productivity                   Infrastructure
per capita


                                                           Enables funding
                                                                 for


                                                             Project
                                                             Finance
CASE STUDY– DABHOL POWER

                     Electricity


        D/E Ratio:
          70:30                    India
                     Dabho
                       l
                     Power
          Biggest
          foreign    Plant         1993
        investment
          in 1992


                       $2.9b
WHY THIS EXAMPLE?

• To understand the typical risks of a
  plant set-up in an emerging economy
• Review reasons of failure of a project -
  all parties affected, finally exited
• Evaluation of a backup plan
DABHOL – PROJECT STRUCTURE
                                             Project Sponsor
                                              Enron Corp
                                                  (65%)
                                        Dividends
                                        +              Capital                                   Banks
                                        Interest                                              ANZ, Credit
    Administration                                               Principal + Interest         Suisse First
                       Payment + Cash        Project Company                                 boston, ABN-
    Maharashtra        Flows                                                               Amro, Citibank.
   State Electricity                          Dabhol Power                                   State Bank of
    Board (15%)                                Corporation   Debt Financing                India, ICIC, IFCI,
                                                                                              IDBI, Canara
                                                                                                 Bank

            Payment                                    Construction
                                                       and OM
                                                       Agreements
     Guarantors
      Govt. of                                                              Operation &
                                  Project                                   Maintenance
   Maharashtra, G                Developer
    ovt. of India                                                            Company
                                Enron Corp                                 Bechtel (10%)
                                                                          General Electric
                                                                               (10%)


                                                                               Suppliers
DABHOL – ANALYSIS OF RISKS
Type of Risk      Concerns              Stakeholders   Inappropriate             Conclusion
                                                       Actions
Resource Risk     •Contamination of     DPC, GOM,      -DPC ignored public       -Terrible publicity
(Water & Land)    salt water, used by   Enron          complaints                - Pressure to
                  fishermen                            -Government severely      change practices
                  •Diversion of fresh                  ignored public            -Delay in project
                  water                                permission and
                  •Land acquisition                    environmental impact
                                                       - Enron denial
Political Risks   -Changing state       GOM, GOI,      - New govt. dismissed     -MSEB rescinded
                  govt.                 DPC, Enron     the contract              the contract in
                  -Slow moving                         -MSEB renegotiated        2001
                  admin.                               the deal for higher       -Enron halted
                  -Conflicts of                        stake.                    phase II project,
                  contract terms                       - Govt. refused for any   issued a notice to
                                                       state owned to buy the    sell is stake for
                                                       stake                     $1bn.
                                                                                 - Enron had to
                                                                                 settle for a discount
Commercial Risk   -Default on           MSEB, GOM,     -Forced MSEB to buy       -An arbitration
                  payments              GOI            power at higher price     notice
                                                       -payments in US$          - Evoked political
                                                                                 Force Majeure
DABHOL – ANALYSIS OF RISKS
Type of Risk        Concerns               Stakeholders   Inappropriate Actions      Conclusion

Technology Risk     None                   DPC, Bechtel   - Legal notice from
                                                          MSEB for inadequate
                                                          capacity as a counter to
                                                          DPC’s invocations

Legal Risk          None                   DPC, Enron     - MOU includes clauses     - Unclear nature of
                                                          in conflict with Indian    PPA, DPC accused
                                                          law                        of fraud
                                                          - Price in USD, against
                                                          the Indian norms
                                                          - Allowed ROE of 31%
                                                          with a limit of 16% for
                                                          power generating
                                                          companies
Human Rights Risk   - Protest from local   DPC, Enron     -Ignored public            -Delayed
                    activists/bodies                      complaints                 - Damages payable
                                                          -Protestors harassed       threatened the
                                                          -Political risk            finances of the
                                                          - Insurance from OPIC      project
DABHOL – LESSONS LEARNT
    Reduce dependence on MSEB, by allowing Central
     Govt. owned utilities to buy power
    Involve the World Bank or multilateral financing
     agency, to avoid political risks
    Detailed study on the financial credibility of the host
     country
    Rigid contractual framework, with the right to sell
     electricity to other customers
    Financial updates/status reports on the customer
    Alternate sources of financing
    Communication and transparency
    Take local law into account
CASE STUDY– ABENGOA


                            High
                          leverage


         Expen
                                                Size
         diture

                         Abengoa


                  Time               Location
AN INTRODUCTION

1940                  1970                     1990

 Founded in Seville
                       The company grew
 in 1940 as a small
                       in the Spanish
 engineering                                    From the 1990’s the
                       market and, from
 company                                        company started to
                       the 1970’s it started
 specialized in                                 invest in
                       to diversify its
 electric assembly                              infrastructure
                       activities
 projects                                       assets, both in
                       internationally
                                                Spain and abroad


Today has geographically diversified activities, in 2010 EBITDA of 942 mio
Euros

Abengoa is a diversified group that focuses on three activities:
                                    Require
                                            Know-how
• Engineering and construction              Operational efficiency
• Concession-type infrastructures           Proprietary assets
• Industrial production
GROWTH STRATEGY


                                                                   Non-
                                                                 recourse
Infrastructure                                                     debt
                                                                        I2
    Assets*
                         CF1**                                 Abengoa
                                                                                E&C        Infrastructure
                                                     I1***      Project       Activities       Assets*
                       CF1**                                   company
Infrastructure
    Assets*                         Abengoa            I1***
                      CF1**                                    Abengoa
                                                                Project                    Infrastructure
                                                                                E&C            Assets*
Infrastructure                                                 company        Activities
    Assets*                                                             I2
                                                                   Non-
                                                                 recourse
                                                                   debt


*Governed by long term sales contracts and hence source of stable revenues.
**CF = Dividends + Cash Flows from O&M activities
***I1= Equity + Corporate Debt
INVESTMENT STRATEGY
 New concession-type project
 assets, built by Abengoa’s Engineering
 companies.


FINANCIAL STRATEGY
• Access to long term, corporate debt at
  the Abengoa companies level

• Use of non-recourse debt at SPC
  (Special Purpose companies, i.e. Project
  Finance vehicles) level

• Stabilization of cash-flows for parent
  companies
IMPACT ON CAPITAL STRUCTURE


                                                                               Covenant for Debt

                                                                               Net Corporate Debt/
                                                                               Corporate EBITDA

                                                                               Stable under 1.85
                                                                               throughout 2009


in   Million        2001    2002    2003      2004      2005      2006      2007      2008      2009      2010
Total Debt          696.6   881.0   877.8   1,108.2   1,561.0   2,790.2   4,538.8   4,780.7   6,415.5   9,211.7
Corportate Debt     495.0   611.1   608.1     743.4     890.1   1,536.4   2,849.7   2,688.0   3,482.1   5,161.6
Project Finance     201.6   269.9   269.7     364.8     670.8   1,253.9   1,689.2   2,092.7   2,933.4   4,050.1
Equity              363.1   351.6   377.9     522.2     526.2     541.1     797.5     627.5   1,171.0   1,630.3
Debt/Equity Ratio     1.9     2.5     2.3       2.1       3.0       5.2       5.7       7.6       5.5       5.7
CONSEQUENCES ON COST OF EQUITY


                                                                          Greater total
                                                                          financial leverage

                                                                           higher beta

                                                                              higher Ke


                      2001    2002    2003    2004    2005    2006    2007       2008    2009    2010
D ebt/Equity R atio     1.9     2.5     2.3     2.1     3.0     5.2     5.7        7.6     5.5     5.7
B eta                  0.30    0.33    0.52    0.71    0.85    1.55    1.22       1.05    1.20    1.60
K e real              5.4%    5.2%    5.4%    5.9%    6.1%    9.7%    8.1%       5.7%    7.2%    9.6%
CONSEQUENCES ON CASH FLOW


                                                                      The stabilization of
                                                                      cash flows brought a
                                                                      substantial
                                                                      decrease in the
                                                                      financial cycle at a
                                                                      corporate level


                   2001   2002     2003     2004     2005     2006     2007      2008      2009      2010
Fin.Cycle (days)    2.4   (9.7)   (20.0)   (17.4)   (34.6)   (43.5)   (91.3)   (133.0)   (149.3)   (164.8)
Work.Capital          9    (41)     (91)     (84)    (195)    (323)    (815)   (1,392)   (1,720)   (2,547)
Cash               320    376      426      357       567    1,136    1,698     1,334     1,546     2,983
PERFORMANCE


                                                                      Peformance improved
                                                                       consistently

                                                                      Stock prices and
                                                                       shareholders value
                                                                       grew continuously


                    2001    2002    2003    2004    2005    2006    2007    2008    2009    2010
ROE                13.1%   14.0%   14.2%   12.7%   16.7%   25.7%   19.5%   34.5%   21.2%   17.4%
Ke real             5.4%    5.2%    5.4%    5.9%    6.1%    9.7%    8.1%    5.7%    7.2%    9.6%
EVA (in Million)   24.3    27.4    29.2    27.9    41.9    62.4    70.6    117.3   112.3   92.8
Stocks (in )         7.7     6.9     5.1     7.1    10.7    21.6    29.1    17.7    16.2    18.5
CONCLUSIONS
 Abengoa successfully evolved from a business strategy focused
  on heavy engineering to include both construction activities and long term
  investments in infrastructure assets

 Abengoa fully explores all synergies between construction business and
  infrastructure services by:
     Using project finance for projects with a higher risk profile, thus also
       reinforcing corporate’s ability to raise more debt.
     Using corporate financing to finance non-cyclical activities
     Construction budgets are managed to produce payables with long
       maturities. As a consequence, working capital is a source of cash in
       Abengoa’s financial model.

Abengoa is able to be very competitive in public auctions through a low
ROA (4-6%). This would translate into a low return on investments if the
company wasn’t able to make use of high leverage, achieving an ROE of 17-
26%.
THANK YOU!


             QUESTIONS?

An introduction to project finance

  • 1.
    PROJECT FINANCE •Anurag Jaiswal •Akanksha Agarwal Corporate Finance •Alessio Tixi •Diego Castañeda •Leidy Suarez •Prateek Singh
  • 2.
    A TYPICAL PROJECTFINANCE STRUCTURE
  • 3.
    PROJECT FINANCE OVERVIEW What Who How When
  • 4.
    WHY PROJECT FINANCE? • All flows separated and debt is non recourse Flexibility • Obtains capital while preserving control. Opportunity cost. • Project is spun-off as a separate company Risk • Creditors have no recourse and risk is allocated to shareholders • Lower agency costs and more efficient valuation and risk control Income • Reduced bankruptcy costs and possibly higher debt tax shields • Increased accountability to investors Control • Management remains in control and is accountable • Financing lifetime is finite and highly structured Timing • Slow to put together Other • Failure of parent posses less risk to project • New conflicts of interest can develop
  • 5.
    PROJECT FINANCE ORCORPORATE FINANCE? COMPARISON OF STRUCTURAL ATTRIBUTES Attribute Project Finance Corporate Finance Organizational Structure -Separated Legal Entity -Secured Debt/Corporate (SPV) Obligation -Facilitate Asset Securitization Capital Structure -High Leverage -Median Debt/Total Cap: -Resembles LBO 33% Ownership Structure -Highly concentrated D&E -Recourse to parent ownership -Syndicated Nonrecourse Loans -Equity: 2-3 sponsors, privately held Board Structure -Affiliated board members -In large Public firms: 10% -(83%) of sponsor firms affiliated directors -no. of members proportional to size of project Contractual Structure -Large no. of agreements -Limited Contracts
  • 6.
    DISADVANTAGES OF PROJECTFINANCE  Higher transactions costs involved  Contracts can be very complex and allow less managerial flexibility  Takes more time to structure and negotiate  Project debt can be more expensive  Requires greater disclosure of proprietary information
  • 7.
    PROJECT FINANCE EVOLUTION • Began in the 80’s to build new power plants • Became the first choice for Governments, NGO’s, and Municipalities to fund new plants • By the 90’s, integrated with the public sector activities: roads, schools, prisons, and roads. • PPP’s- Public Private Partnerships were used to expand the availability of funds. • Today: Used in both developed and developing countries across a broader range of sectors. • Bank loans provide the majority of debt. In 2009 banks financed 461 projects with over $139 Billion while bonds financed 31 projects with $8B.
  • 8.
    RECENT TRENDS INPROJECT FINANCE Geographical Breakdown of Project Finance Volume 12% 21% 33% Western Europe Asia Middle East 16% 18% North America Others
  • 9.
    PROJECT FINANCE INDEVELOPING COUNTRIES GDP is driven by is boosted by Productivity Infrastructure per capita Enables funding for Project Finance
  • 10.
    CASE STUDY– DABHOLPOWER Electricity D/E Ratio: 70:30 India Dabho l Power Biggest foreign Plant 1993 investment in 1992 $2.9b
  • 11.
    WHY THIS EXAMPLE? •To understand the typical risks of a plant set-up in an emerging economy • Review reasons of failure of a project - all parties affected, finally exited • Evaluation of a backup plan
  • 12.
    DABHOL – PROJECTSTRUCTURE Project Sponsor Enron Corp (65%) Dividends + Capital Banks Interest ANZ, Credit Administration Principal + Interest Suisse First Payment + Cash Project Company boston, ABN- Maharashtra Flows Amro, Citibank. State Electricity Dabhol Power State Bank of Board (15%) Corporation Debt Financing India, ICIC, IFCI, IDBI, Canara Bank Payment Construction and OM Agreements Guarantors Govt. of Operation & Project Maintenance Maharashtra, G Developer ovt. of India Company Enron Corp Bechtel (10%) General Electric (10%) Suppliers
  • 13.
    DABHOL – ANALYSISOF RISKS Type of Risk Concerns Stakeholders Inappropriate Conclusion Actions Resource Risk •Contamination of DPC, GOM, -DPC ignored public -Terrible publicity (Water & Land) salt water, used by Enron complaints - Pressure to fishermen -Government severely change practices •Diversion of fresh ignored public -Delay in project water permission and •Land acquisition environmental impact - Enron denial Political Risks -Changing state GOM, GOI, - New govt. dismissed -MSEB rescinded govt. DPC, Enron the contract the contract in -Slow moving -MSEB renegotiated 2001 admin. the deal for higher -Enron halted -Conflicts of stake. phase II project, contract terms - Govt. refused for any issued a notice to state owned to buy the sell is stake for stake $1bn. - Enron had to settle for a discount Commercial Risk -Default on MSEB, GOM, -Forced MSEB to buy -An arbitration payments GOI power at higher price notice -payments in US$ - Evoked political Force Majeure
  • 14.
    DABHOL – ANALYSISOF RISKS Type of Risk Concerns Stakeholders Inappropriate Actions Conclusion Technology Risk None DPC, Bechtel - Legal notice from MSEB for inadequate capacity as a counter to DPC’s invocations Legal Risk None DPC, Enron - MOU includes clauses - Unclear nature of in conflict with Indian PPA, DPC accused law of fraud - Price in USD, against the Indian norms - Allowed ROE of 31% with a limit of 16% for power generating companies Human Rights Risk - Protest from local DPC, Enron -Ignored public -Delayed activists/bodies complaints - Damages payable -Protestors harassed threatened the -Political risk finances of the - Insurance from OPIC project
  • 15.
    DABHOL – LESSONSLEARNT  Reduce dependence on MSEB, by allowing Central Govt. owned utilities to buy power  Involve the World Bank or multilateral financing agency, to avoid political risks  Detailed study on the financial credibility of the host country  Rigid contractual framework, with the right to sell electricity to other customers  Financial updates/status reports on the customer  Alternate sources of financing  Communication and transparency  Take local law into account
  • 16.
    CASE STUDY– ABENGOA High leverage Expen Size diture Abengoa Time Location
  • 17.
    AN INTRODUCTION 1940 1970 1990 Founded in Seville The company grew in 1940 as a small in the Spanish engineering From the 1990’s the market and, from company company started to the 1970’s it started specialized in invest in to diversify its electric assembly infrastructure activities projects assets, both in internationally Spain and abroad Today has geographically diversified activities, in 2010 EBITDA of 942 mio Euros Abengoa is a diversified group that focuses on three activities: Require Know-how • Engineering and construction Operational efficiency • Concession-type infrastructures Proprietary assets • Industrial production
  • 18.
    GROWTH STRATEGY Non- recourse Infrastructure debt I2 Assets* CF1** Abengoa E&C Infrastructure I1*** Project Activities Assets* CF1** company Infrastructure Assets* Abengoa I1*** CF1** Abengoa Project Infrastructure E&C Assets* Infrastructure company Activities Assets* I2 Non- recourse debt *Governed by long term sales contracts and hence source of stable revenues. **CF = Dividends + Cash Flows from O&M activities ***I1= Equity + Corporate Debt
  • 19.
    INVESTMENT STRATEGY Newconcession-type project assets, built by Abengoa’s Engineering companies. FINANCIAL STRATEGY • Access to long term, corporate debt at the Abengoa companies level • Use of non-recourse debt at SPC (Special Purpose companies, i.e. Project Finance vehicles) level • Stabilization of cash-flows for parent companies
  • 20.
    IMPACT ON CAPITALSTRUCTURE Covenant for Debt Net Corporate Debt/ Corporate EBITDA Stable under 1.85 throughout 2009 in Million 2001 2002 2003 2004 2005 2006 2007 2008 2009 2010 Total Debt 696.6 881.0 877.8 1,108.2 1,561.0 2,790.2 4,538.8 4,780.7 6,415.5 9,211.7 Corportate Debt 495.0 611.1 608.1 743.4 890.1 1,536.4 2,849.7 2,688.0 3,482.1 5,161.6 Project Finance 201.6 269.9 269.7 364.8 670.8 1,253.9 1,689.2 2,092.7 2,933.4 4,050.1 Equity 363.1 351.6 377.9 522.2 526.2 541.1 797.5 627.5 1,171.0 1,630.3 Debt/Equity Ratio 1.9 2.5 2.3 2.1 3.0 5.2 5.7 7.6 5.5 5.7
  • 21.
    CONSEQUENCES ON COSTOF EQUITY Greater total financial leverage  higher beta higher Ke 2001 2002 2003 2004 2005 2006 2007 2008 2009 2010 D ebt/Equity R atio 1.9 2.5 2.3 2.1 3.0 5.2 5.7 7.6 5.5 5.7 B eta 0.30 0.33 0.52 0.71 0.85 1.55 1.22 1.05 1.20 1.60 K e real 5.4% 5.2% 5.4% 5.9% 6.1% 9.7% 8.1% 5.7% 7.2% 9.6%
  • 22.
    CONSEQUENCES ON CASHFLOW The stabilization of cash flows brought a substantial decrease in the financial cycle at a corporate level 2001 2002 2003 2004 2005 2006 2007 2008 2009 2010 Fin.Cycle (days) 2.4 (9.7) (20.0) (17.4) (34.6) (43.5) (91.3) (133.0) (149.3) (164.8) Work.Capital 9 (41) (91) (84) (195) (323) (815) (1,392) (1,720) (2,547) Cash 320 376 426 357 567 1,136 1,698 1,334 1,546 2,983
  • 23.
    PERFORMANCE  Peformance improved consistently  Stock prices and shareholders value grew continuously 2001 2002 2003 2004 2005 2006 2007 2008 2009 2010 ROE 13.1% 14.0% 14.2% 12.7% 16.7% 25.7% 19.5% 34.5% 21.2% 17.4% Ke real 5.4% 5.2% 5.4% 5.9% 6.1% 9.7% 8.1% 5.7% 7.2% 9.6% EVA (in Million) 24.3 27.4 29.2 27.9 41.9 62.4 70.6 117.3 112.3 92.8 Stocks (in ) 7.7 6.9 5.1 7.1 10.7 21.6 29.1 17.7 16.2 18.5
  • 24.
    CONCLUSIONS  Abengoa successfullyevolved from a business strategy focused on heavy engineering to include both construction activities and long term investments in infrastructure assets  Abengoa fully explores all synergies between construction business and infrastructure services by:  Using project finance for projects with a higher risk profile, thus also reinforcing corporate’s ability to raise more debt.  Using corporate financing to finance non-cyclical activities  Construction budgets are managed to produce payables with long maturities. As a consequence, working capital is a source of cash in Abengoa’s financial model. Abengoa is able to be very competitive in public auctions through a low ROA (4-6%). This would translate into a low return on investments if the company wasn’t able to make use of high leverage, achieving an ROE of 17- 26%.
  • 25.
    THANK YOU! QUESTIONS?

Editor's Notes

  • #2 1: Title
  • #3 2b What is project FinanceLEIDY
  • #4 2-What is project financeDefinitionLifespan of the projectStable cashflowsStructureStakeholdersPeopleLEIDY
  • #5 3a Why Project FinanceWhy people go for it, comparison with other financial instruments (normally it’s internal financing) (see course material, 5 criteria)DIEGO
  • #9 5 How is project finance used currently?Historical, statistical, industry overviewIndustry sizeSize of project financingTrends and geographical distribution of project financingAnurag/Alessio
  • #10 5 Peculiarities of project finance in emerging countriesPRATEEK
  • #20 The Financial strategy involves access to long term, corporate debt at the Abengoa companies level (Abengoa issues debt mostly through the holding company, but other operational companies may also issue corporate debt). Abengoa parent companies receive cash-flows from project companies both through dividends, through construction contracts and through O&M contracts with parent companies. Infrastructure project companies also issue long term debt, but this debt is non-recourse, project financing debt. Project financing is an important part of the strategy as banks that lend long-term resources to Abengoa parent companies do not consider non-resource debt as part of Abengoa’s net debt.
  • #21 Abengoa’s higher leverage has not hindered its access to debt markets. Actually, banks do not perceive an increase in total debt as an increase in corporate risk, since a large part of total debt consists in project financing. Abengoa’s long term corporate debt has only one covenant: Net Corporate Debt/Corporate EBITDA. Cash, debts and EBITDA in projects financed by non- recourse debt are not taken into account. Only corporate cash, corporate debt, corporate EBITDA (including project dividends) are considered for its 3.0 Net Corporate Debt/Corporate EBITDA covenant. By this standard, Abengoa still has room for new corporate debt as Net Corporate Debt/Corporate EBITDA has ranged from 1.17 to 1.84 from 2007 to 2009.
  • #22 However, as a consequence of the greater total financial leverage Abengoa’s ROE has substantially increased, even considering the increase in its interest expenses. On the other hand, higher leverage also brought a higher beta and consequently Abengoa’s cost of equity also increased in the same period, as it can be seen in table 4 and figure 12.
  • #23 Finally, table 6 and figure 14 point out another interesting effect of Abengoa’s strategy, the huge financial cycle reduction from 2.4 days to –164.8 days between 2001 and 2010, which consequently implied in an increase of cash position caused by working capital reduction.
  • #24 However, taking into consideration the rise in value created for Abengoa’s stockholders in the last ten years, the final economical result of Abengoa’s financial strategy has been extremely positive. As it can be seen in table 5 and figure 13, Abengoa’s EVA had a substantial growth from 2001 to 2010, which largely explains the performance of Abengoa’s stock in the period. Quite simply, EVA is the profit earned by the firm less the cost of financing the firm's capital.where: , is the Return on Invested Capital (ROIC); is the weighted average cost of capital (WACC); is the economic capital employed;NOPAT is the net operating profit after tax, with adjustments and translations, generally for the amortization of goodwill, the capitalization of brand advertising and others non-cash items.