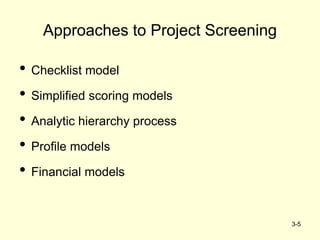
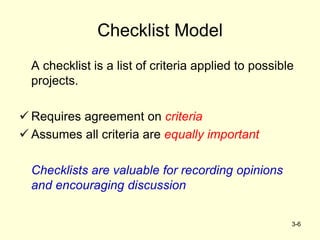
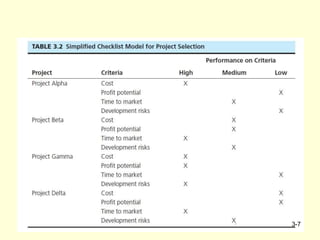
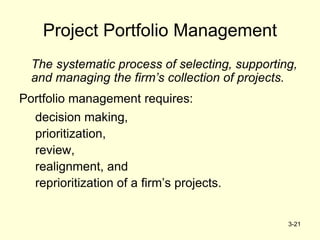
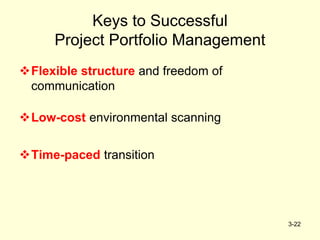
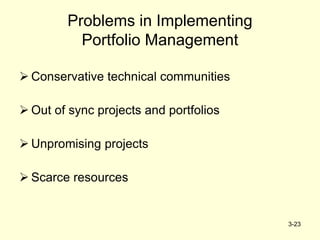
3-1
Project Selection and
Portfolio Management
3-2
Project Selection
Screening models help managers pick winners
from a pool of projects. Screening models are
numeric or nonnumeric and should have:
• Realism: An effective model must reflect organizational objectives,
including a firm’s strategic goals and mission.
• Capability: A model should be flexible enough to respond to changes
in the conditions under which projects are carried out. For example, the
model should allow the company to compare different types of projects
(long-term versus short-term projects, projects of different technologies or
capabilities, projects with different commercial objectives).
• Flexibility: The model should be easily modified if trial applications
require changes. It must, for example, allow for adjustments due to changes
in exchange rates, tax laws, building codes, and so forth.
• Ease of use: A model must be simple enough to be used
by people in all areas of the organization, both those in
specific project roles and those in related functional
positions.
• Cost effectiveness: The screening model should be cost
effective. A selection approach that is expensive to use
in terms of either time or money is likely to have the
worst possible effect: causing organizational members to
avoid using it because of the excessive cost of
employing the screening model.
• Comparability: It must be broad enough to be applied to
multiple projects. If a model is too narrowly focused, it
may be useless in comparing potential projects or foster
biases toward some over others.A useful model must
support general comparisons of project alternatives.
3-3
3-4
Screening & Selection Issues
• Risk – unpredictability to the firm
• Commercial – market potential
• Internal operating – changes in firm operations
• Additional – image, patent, fit, etc.
All models only partially reflect reality and
have both objective and subjective factors
imbedded
3-5
Approaches to Project Screening
• Checklist model
• Simplified scoring models
• Analytic hierarchy process
• Profile models
• Financial models
3-6
Checklist Model
A checklist is a list of criteria applied to possible
projects.
 Requires agreement on criteria
 Assumes all criteria are equally important
Checklists are valuable for recording opinions
and encouraging discussion
3-7
3-8
Simplified Scoring Models
In the simplified scoring model, each
criterion is ranked according to its relative
importance. Each project receives a score that
is the weighted sum of its grade on a list of
criteria. Scoring models require:
 agreement on criteria
 agreement on weights for criteria
 a score assigned for each criteria
Relative scores can be misleading!
( )Score Weight Score 
3-9
Limitation of Scoring Model
• The simple scoring model illustrated here is an
abbreviated and unsophisticated version of the weighted
scoring approach. In general, scoring models try to
impose some structure on the decision-making process
while, at the same time, combining multiple criteria.
• it is not very accurate
• From the perspective of mathematical scaling, it is
simply wrong to treat evaluations on such a scale as real
numbers that can be multiplied and summed.
3-10
3-11
Analytic Hierarchy Process
The AHP is a four step process:
1. Construct a hierarchy of criteria and subcriteria
2. Allocate weights to criteria
3. Assign numerical values to evaluation
dimensions
4. Scores determined by summing the products of
numeric evaluations and weights
Unlike the simple scoring model, these scores
can be compared!
3-12
Profile Models
Show risk/return options for projects.
Maximum
Desired Risk
Minimum
Desired Return
Return
R
i
s
k
X1
X3
X5
X6
X4
X2
Efficient Frontier
Criteria
selection as
axes
Rating each
project on
criteria
3-13
Financial Models
Based on the time value of money principal
• Payback period
• Net present value
• Internal rate of return
• Options models
All of these models use discounted cash flows
3-14
Payback Period
Cash flows should be discounted
Lower numbers are better (faster payback)
Investment
Payback Period
Annual Cash Savings

Determines how long it takes for a project to
reach a breakeven point
3-15
Payback Period Example
A project requires an initial investment of $200,000 and
will generate cash savings of $75,000 each year for the
next five years. What is the payback period?
Year Cash Flow Cumulative
0 ($200,000) ($200,000)
1 $75,000 ($125,000)
2 $75,000 ($50,000)
3 $75,000 $25,000
Divide the cumulative
amount by the cash
flow amount in the
third year and subtract
from 3 to find out the
moment the project
breaks even.
25,000
3 2.67
75,000
years 
3-16
Net Present Value
Projects the change in the firm’s stock value if a
project is undertaken.
(1 )
t
o t
t
t
t
F
NPV I
r p
where
F = net cash flow for period t
R = required rate of return
I = initial cash investment
P = inflation rate during period t
 
 

Higher NPV
values are better!
3-17
Net Present Value Example
Should you invest $60,000 in a project that will return $15,000 per
year for five years? You have a minimum return of 8% and expect
inflation to hold steady at 3% over the next five years.
Year Net flow Discount NPV
0 -$60,000 1.0000 -$60,000.00
1 $15,000 0.9009 $13,513.51
2 $15,000 0.8116 $12,174.34
3 $15,000 0.7312 $10,967.87
4 $15,000 0.6587 $9,880.96
5 $15,000 0.5935 $8,901.77
-$4,561.54
The NPV
column total is
negative, so
don’t invest!
3-18
Internal Rate of Return
A project must meet a minimum rate of return
before it is worthy of consideration.
1 (1 )
t
t
n
t
ACF
IO
IRR t
where
ACF = annual after tax cash flow for time period t
IO = initial cash outlay
n = project's expected life
IRR = the project's internal rate of return



 Higher IRR values
are better!
3-19
Internal Rate of Return Example
A project that costs $40,000 will generate cash flows
of $14,000 for the next four years. You have a rate of
return requirement of 17%; does this project meet
the threshold?
Year Net flow Discount NPV
0 -$40,000 1.0000 -$40,000.00
1 $14,000 0.9009 $12,173.91
2 $14,000 0.8116 $10,586.01
3 $14,000 0.7312 $9,205.23
4 $14,000 0.6587 $8,004.55
-$30.30
This table
has been
calculated
using a
discount
rate of 15%
The project doesn’t meet our 17% requirement
and should not be considered further.
3-20
Options Models
NPV and IRR methods don’t account for failure
to make a positive return on investment.
Options models allow for this possibility.
Options models address:
1. Can the project be postponed?
2. Will future information help decide?
3-21
Project Portfolio Management
The systematic process of selecting, supporting,
and managing the firm’s collection of projects.
Portfolio management requires:
decision making,
prioritization,
review,
realignment, and
reprioritization of a firm’s projects.
3-22
Keys to Successful
Project Portfolio Management
Flexible structure and freedom of
communication
Low-cost environmental scanning
Time-paced transition
3-23
Problems in Implementing
Portfolio Management
 Conservative technical communities
 Out of sync projects and portfolios
 Unpromising projects
 Scarce resources

Project selection

  • 1.
  • 2.
    3-2 Project Selection Screening modelshelp managers pick winners from a pool of projects. Screening models are numeric or nonnumeric and should have: • Realism: An effective model must reflect organizational objectives, including a firm’s strategic goals and mission. • Capability: A model should be flexible enough to respond to changes in the conditions under which projects are carried out. For example, the model should allow the company to compare different types of projects (long-term versus short-term projects, projects of different technologies or capabilities, projects with different commercial objectives). • Flexibility: The model should be easily modified if trial applications require changes. It must, for example, allow for adjustments due to changes in exchange rates, tax laws, building codes, and so forth.
  • 3.
    • Ease ofuse: A model must be simple enough to be used by people in all areas of the organization, both those in specific project roles and those in related functional positions. • Cost effectiveness: The screening model should be cost effective. A selection approach that is expensive to use in terms of either time or money is likely to have the worst possible effect: causing organizational members to avoid using it because of the excessive cost of employing the screening model. • Comparability: It must be broad enough to be applied to multiple projects. If a model is too narrowly focused, it may be useless in comparing potential projects or foster biases toward some over others.A useful model must support general comparisons of project alternatives. 3-3
  • 4.
    3-4 Screening & SelectionIssues • Risk – unpredictability to the firm • Commercial – market potential • Internal operating – changes in firm operations • Additional – image, patent, fit, etc. All models only partially reflect reality and have both objective and subjective factors imbedded
  • 5.
    3-5 Approaches to ProjectScreening • Checklist model • Simplified scoring models • Analytic hierarchy process • Profile models • Financial models
  • 6.
    3-6 Checklist Model A checklistis a list of criteria applied to possible projects.  Requires agreement on criteria  Assumes all criteria are equally important Checklists are valuable for recording opinions and encouraging discussion
  • 7.
  • 8.
    3-8 Simplified Scoring Models Inthe simplified scoring model, each criterion is ranked according to its relative importance. Each project receives a score that is the weighted sum of its grade on a list of criteria. Scoring models require:  agreement on criteria  agreement on weights for criteria  a score assigned for each criteria Relative scores can be misleading! ( )Score Weight Score 
  • 9.
  • 10.
    Limitation of ScoringModel • The simple scoring model illustrated here is an abbreviated and unsophisticated version of the weighted scoring approach. In general, scoring models try to impose some structure on the decision-making process while, at the same time, combining multiple criteria. • it is not very accurate • From the perspective of mathematical scaling, it is simply wrong to treat evaluations on such a scale as real numbers that can be multiplied and summed. 3-10
  • 11.
    3-11 Analytic Hierarchy Process TheAHP is a four step process: 1. Construct a hierarchy of criteria and subcriteria 2. Allocate weights to criteria 3. Assign numerical values to evaluation dimensions 4. Scores determined by summing the products of numeric evaluations and weights Unlike the simple scoring model, these scores can be compared!
  • 12.
    3-12 Profile Models Show risk/returnoptions for projects. Maximum Desired Risk Minimum Desired Return Return R i s k X1 X3 X5 X6 X4 X2 Efficient Frontier Criteria selection as axes Rating each project on criteria
  • 13.
    3-13 Financial Models Based onthe time value of money principal • Payback period • Net present value • Internal rate of return • Options models All of these models use discounted cash flows
  • 14.
    3-14 Payback Period Cash flowsshould be discounted Lower numbers are better (faster payback) Investment Payback Period Annual Cash Savings  Determines how long it takes for a project to reach a breakeven point
  • 15.
    3-15 Payback Period Example Aproject requires an initial investment of $200,000 and will generate cash savings of $75,000 each year for the next five years. What is the payback period? Year Cash Flow Cumulative 0 ($200,000) ($200,000) 1 $75,000 ($125,000) 2 $75,000 ($50,000) 3 $75,000 $25,000 Divide the cumulative amount by the cash flow amount in the third year and subtract from 3 to find out the moment the project breaks even. 25,000 3 2.67 75,000 years 
  • 16.
    3-16 Net Present Value Projectsthe change in the firm’s stock value if a project is undertaken. (1 ) t o t t t t F NPV I r p where F = net cash flow for period t R = required rate of return I = initial cash investment P = inflation rate during period t      Higher NPV values are better!
  • 17.
    3-17 Net Present ValueExample Should you invest $60,000 in a project that will return $15,000 per year for five years? You have a minimum return of 8% and expect inflation to hold steady at 3% over the next five years. Year Net flow Discount NPV 0 -$60,000 1.0000 -$60,000.00 1 $15,000 0.9009 $13,513.51 2 $15,000 0.8116 $12,174.34 3 $15,000 0.7312 $10,967.87 4 $15,000 0.6587 $9,880.96 5 $15,000 0.5935 $8,901.77 -$4,561.54 The NPV column total is negative, so don’t invest!
  • 18.
    3-18 Internal Rate ofReturn A project must meet a minimum rate of return before it is worthy of consideration. 1 (1 ) t t n t ACF IO IRR t where ACF = annual after tax cash flow for time period t IO = initial cash outlay n = project's expected life IRR = the project's internal rate of return     Higher IRR values are better!
  • 19.
    3-19 Internal Rate ofReturn Example A project that costs $40,000 will generate cash flows of $14,000 for the next four years. You have a rate of return requirement of 17%; does this project meet the threshold? Year Net flow Discount NPV 0 -$40,000 1.0000 -$40,000.00 1 $14,000 0.9009 $12,173.91 2 $14,000 0.8116 $10,586.01 3 $14,000 0.7312 $9,205.23 4 $14,000 0.6587 $8,004.55 -$30.30 This table has been calculated using a discount rate of 15% The project doesn’t meet our 17% requirement and should not be considered further.
  • 20.
    3-20 Options Models NPV andIRR methods don’t account for failure to make a positive return on investment. Options models allow for this possibility. Options models address: 1. Can the project be postponed? 2. Will future information help decide?
  • 21.
    3-21 Project Portfolio Management Thesystematic process of selecting, supporting, and managing the firm’s collection of projects. Portfolio management requires: decision making, prioritization, review, realignment, and reprioritization of a firm’s projects.
  • 22.
    3-22 Keys to Successful ProjectPortfolio Management Flexible structure and freedom of communication Low-cost environmental scanning Time-paced transition
  • 23.
    3-23 Problems in Implementing PortfolioManagement  Conservative technical communities  Out of sync projects and portfolios  Unpromising projects  Scarce resources