Downloaded 1,170 times
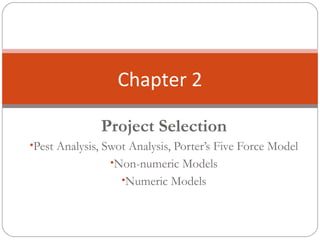


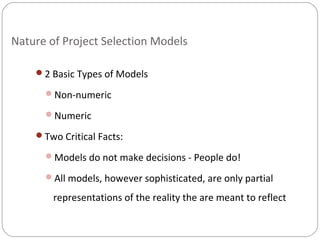
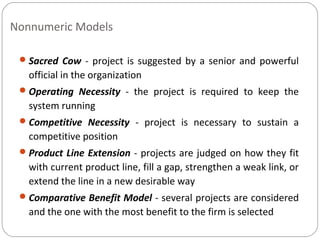
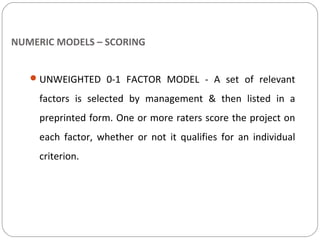
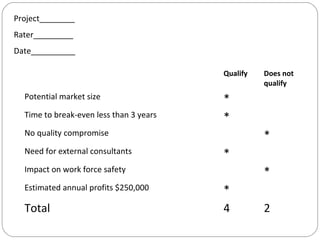
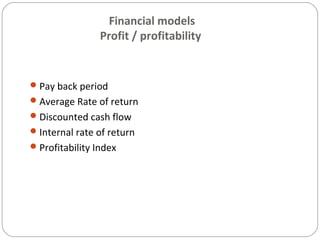


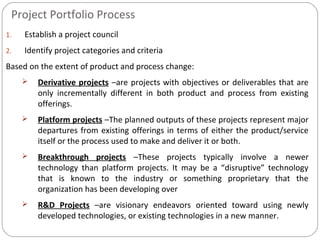
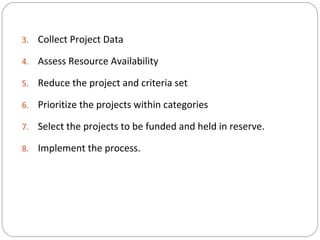
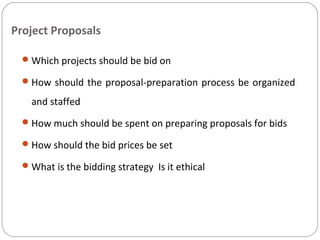
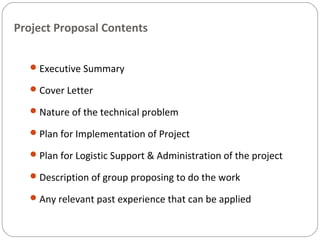

The document discusses various models and methods used for project selection. It begins by describing non-numeric models such as sacred cow, operating necessity, competitive necessity, and product line extension. It then discusses numeric scoring models including unweighted 0-1 factor model, unweighted factor scoring model, and weighted factor scoring model. Finally, it discusses financial models used for project selection, focusing on models that evaluate profitability. The document provides an overview of different approaches organizations can take when selecting projects.


![Project Feasibility [DECEMBER 2006]](https://cdn.slidesharecdn.com/ss_thumbnails/projectfeasibilitydecember2006-130516112918-phpapp02-thumbnail.jpg?width=640&height=640&fit=bounds)