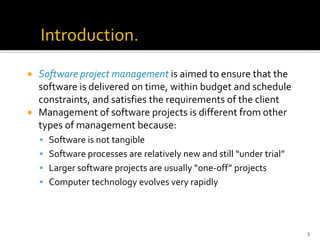
Software projectmanagement is aimed to ensure that the
software is delivered on time, within budget and schedule
constraints, and satisfies the requirements of the client
Management of software projects is different from other
types of management because:
▪ Software is not tangible
▪ Software processes are relatively new and still “under trial”
▪ Larger software projects are usually “one-off” projects
▪ Computer technology evolves very rapidly
3
4.
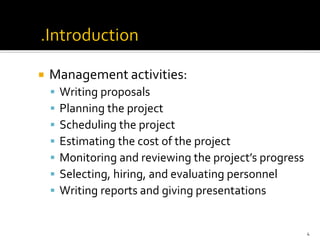
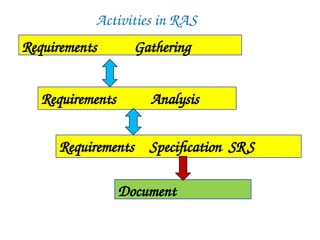
Management activities:
▪Writing proposals
▪ Planning the project
▪ Scheduling the project
▪ Estimating the cost of the project
▪ Monitoring and reviewing the project’s progress
▪ Selecting, hiring, and evaluating personnel
▪ Writing reports and giving presentations
4
5.
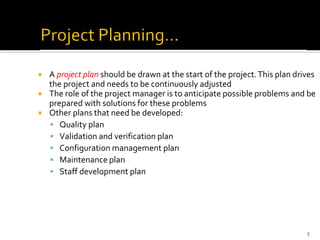
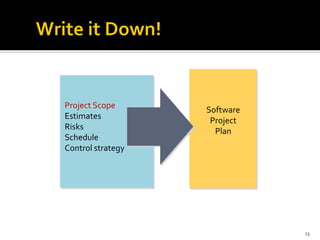
A projectplan should be drawn at the start of the project.This plan drives
the project and needs to be continuously adjusted
The role of the project manager is to anticipate possible problems and be
prepared with solutions for these problems
Other plans that need be developed:
▪ Quality plan
▪ Validation and verification plan
▪ Configuration management plan
▪ Maintenance plan
▪ Staff development plan
5
6.
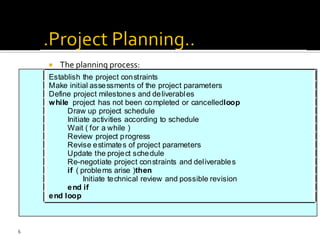
The planningprocess:
Establish the project constraints
Make initial assessments of the project parameters
Define project milestones and deliverables
while project has not been completed or cancelledloop
Draw up project schedule
Initiate activities according to schedule
Wait ( for a while )
Review project progress
Revise estimates of project parameters
Update the project schedule
Re-negotiate project constraints and deliverables
if ( problems arise )then
Initiate technical review and possible revision
end if
end loop
6
7.
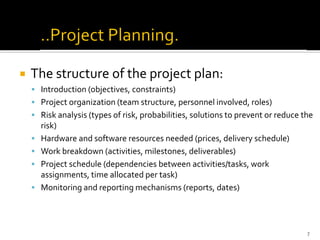
The structureof the project plan:
▪ Introduction (objectives, constraints)
▪ Project organization (team structure, personnel involved, roles)
▪ Risk analysis (types of risk, probabilities, solutions to prevent or reduce the
risk)
▪ Hardware and software resources needed (prices, delivery schedule)
▪ Work breakdown (activities, milestones, deliverables)
▪ Project schedule (dependencies between activities/tasks, work
assignments, time allocated per task)
▪ Monitoring and reporting mechanisms (reports, dates)
7
8.
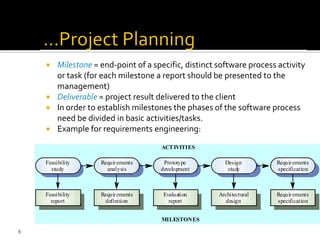
Milestone =end-point of a specific, distinct software process activity
or task (for each milestone a report should be presented to the
management)
Deliverable = project result delivered to the client
In order to establish milestones the phases of the software process
need be divided in basic activities/tasks.
Example for requirements engineering:
Evaluation
report
Prototype
development
Requirements
definition
Requirements
analysis
Feasibility
report
Feasibility
study
Architectural
design
Design
study
Requirements
specification
Requirements
specification
ACTIVITIES
MILESTONES
8
9.
9
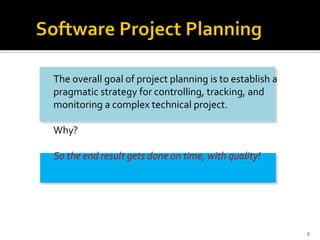
The overall goalof project planning is to establish a
pragmatic strategy for controlling, tracking, and
monitoring a complex technical project.
Why?
So the end result gets done on time, with quality!
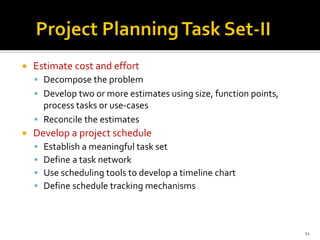
Estimate costand effort
▪ Decompose the problem
▪ Develop two or more estimates using size, function points,
process tasks or use-cases
▪ Reconcile the estimates
Develop a project schedule
▪ Establish a meaningful task set
▪ Define a task network
▪ Use scheduling tools to develop a timeline chart
▪ Define schedule tracking mechanisms
11
12.
Estimation ofresources, cost, and schedule
for a software engineering effort requires
▪ experience
▪ access to good historical information (metrics)
▪ the courage to commit to quantitative predictions
when qualitative information is all that exists
Estimation carries inherent risk and this risk
leads to uncertainty
12
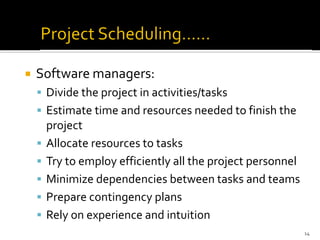
Software managers:
▪Divide the project in activities/tasks
▪ Estimate time and resources needed to finish the
project
▪ Allocate resources to tasks
▪ Try to employ efficiently all the project personnel
▪ Minimize dependencies between tasks and teams
▪ Prepare contingency plans
▪ Rely on experience and intuition
14
15.
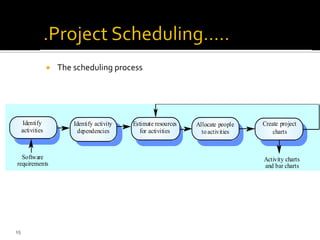
The schedulingprocess
Estimate resources
for activities
Identify activity
dependencies
Identify
activities
Allocate people
toactivities
Create project
charts
Software
requirements
Activity charts
and bar charts
15
16.
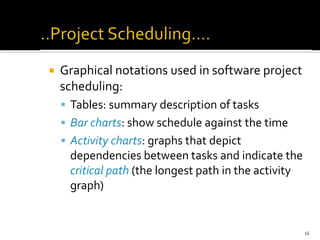
Graphical notationsused in software project
scheduling:
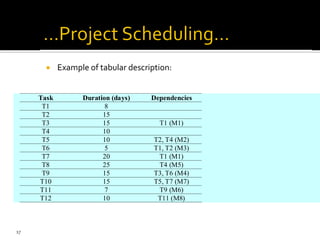
▪ Tables: summary description of tasks
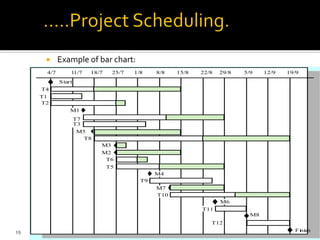
▪ Bar charts: show schedule against the time
▪ Activity charts: graphs that depict
dependencies between tasks and indicate the
critical path (the longest path in the activity
graph)
16
Software projectmanagement is aimed to ensure that the
software is delivered on time, within budget and schedule
constraints, and satisfies the requirements of the client
Management of software projects is different from other
types of management because:
▪ Software is not tangible
▪ Software processes are relatively new and still “under trial”
▪ Larger software projects are usually “one-off” projects
▪ Computer technology evolves very rapidly
3
24.
Management activities:
▪Writing proposals
▪ Planning the project
▪ Scheduling the project
▪ Estimating the cost of the project
▪ Monitoring and reviewing the project’s progress
▪ Selecting, hiring, and evaluating personnel
▪ Writing reports and giving presentations
4
25.
A projectplan should be drawn at the start of the project.This plan drives
the project and needs to be continuously adjusted
The role of the project manager is to anticipate possible problems and be
prepared with solutions for these problems
Other plans that need be developed:
▪ Quality plan
▪ Validation and verification plan
▪ Configuration management plan
▪ Maintenance plan
▪ Staff development plan
5
26.
The planningprocess:
Establish the project constraints
Make initial assessments of the project parameters
Define project milestones and deliverables
while project has not been completed or cancelledloop
Draw up project schedule
Initiate activities according to schedule
Wait ( for a while )
Review project progress
Revise estimates of project parameters
Update the project schedule
Re-negotiate project constraints and deliverables
if ( problems arise )then
Initiate technical review and possible revision
end if
end loop
6
27.
The structureof the project plan:
▪ Introduction (objectives, constraints)
▪ Project organization (team structure, personnel involved, roles)
▪ Risk analysis (types of risk, probabilities, solutions to prevent or reduce the
risk)
▪ Hardware and software resources needed (prices, delivery schedule)
▪ Work breakdown (activities, milestones, deliverables)
▪ Project schedule (dependencies between activities/tasks, work
assignments, time allocated per task)
▪ Monitoring and reporting mechanisms (reports, dates)
7
28.
Milestone =end-point of a specific, distinct software process activity
or task (for each milestone a report should be presented to the
management)
Deliverable = project result delivered to the client
In order to establish milestones the phases of the software process
need be divided in basic activities/tasks.
Example for requirements engineering:
Evaluation
report
Prototype
development
Requirements
definition
Requirements
analysis
Feasibility
report
Feasibility
study
Architectural
design
Design
study
Requirements
specification
Requirements
specification
ACTIVITIES
MILESTONES
8
29.
9
The overall goalof project planning is to establish a
pragmatic strategy for controlling, tracking, and
monitoring a complex technical project.
Why?
So the end result gets done on time, with quality!
Estimate costand effort
▪ Decompose the problem
▪ Develop two or more estimates using size, function points,
process tasks or use-cases
▪ Reconcile the estimates
Develop a project schedule
▪ Establish a meaningful task set
▪ Define a task network
▪ Use scheduling tools to develop a timeline chart
▪ Define schedule tracking mechanisms
11
32.
Estimation ofresources, cost, and schedule
for a software engineering effort requires
▪ experience
▪ access to good historical information (metrics)
▪ the courage to commit to quantitative predictions
when qualitative information is all that exists
Estimation carries inherent risk and this risk
leads to uncertainty
12
Software managers:
▪Divide the project in activities/tasks
▪ Estimate time and resources needed to finish the
project
▪ Allocate resources to tasks
▪ Try to employ efficiently all the project personnel
▪ Minimize dependencies between tasks and teams
▪ Prepare contingency plans
▪ Rely on experience and intuition
14
35.
The schedulingprocess
Estimate resources
for activities
Identify activity
dependencies
Identify
activities
Allocate people
toactivities
Create project
charts
Software
requirements
Activity charts
and bar charts
15
36.
Graphical notationsused in software project
scheduling:
▪ Tables: summary description of tasks
▪ Bar charts: show schedule against the time
▪ Activity charts: graphs that depict
dependencies between tasks and indicate the
critical path (the longest path in the activity
graph)
16
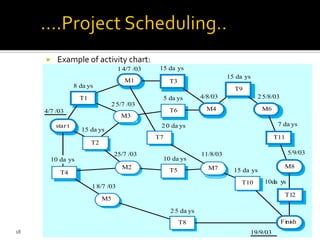
Example ofactivity chart:
star t
T2
M3
T6
Finish
T10
M7
T5
T7
M2
T4
M5
T8
4/7 /03
8 da ys
14/7 /03 15 da ys
4/8/03
15 da ys
25/8/03
7 da ys
5/9/03
10da ys
19/9/03
15 da ys
11/8/03
25 da ys
10 da ys
20 da ys
5 da ys
25/7 /03
15 da ys
25/7 /03
18/7 /03
10 da ys
T1
M1 T3
T9
M6
T11
M8
T12
M4
18
39.
Example ofbar chart:
4/7 11/7 18/7 25/7 1/8 8/8 15/8 22/8 29/8 5/9 12/9 19/9
T4
T1
T2
M1
T7
T3
M5
T8
M3
M2
T6
T5
M4
T9
M7
T10
M6
T11
M8
T12
Start
Fi
ni
sh
19
40.
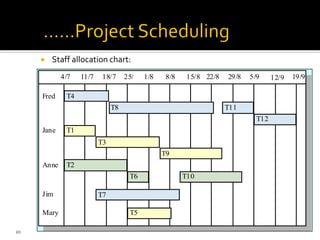
Staff allocationchart:
4/7 11/7 18/7 25/ 1/8 8/8 15/8 22/8 29/8 5/9 12/9 19/9
T4
T8 T11
T12
T1
T3
T9
T2
T6 T10
T7
T5
Fred
Jane
Anne
Mary
Jim
20
41.
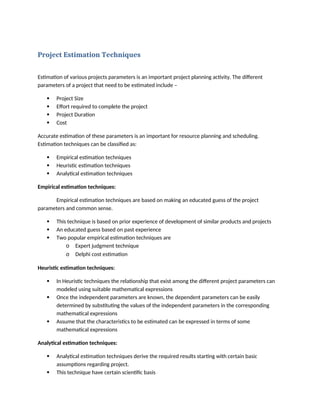
Project Estimation Techniques
Estimationof various projects parameters is an important project planning activity. The different
parameters of a project that need to be estimated include –
Project Size
Effort required to complete the project
Project Duration
Cost
Accurate estimation of these parameters is an important for resource planning and scheduling.
Estimation techniques can be classified as:
Empirical estimation techniques
Heuristic estimation techniques
Analytical estimation techniques
Empirical estimation techniques:
Empirical estimation techniques are based on making an educated guess of the project
parameters and common sense.
This technique is based on prior experience of development of similar products and projects
An educated guess based on past experience
Two popular empirical estimation techniques are
o Expert judgment technique
o Delphi cost estimation
Heuristic estimation techniques:
In Heuristic techniques the relationship that exist among the different project parameters can
modeled using suitable mathematical expressions
Once the independent parameters are known, the dependent parameters can be easily
determined by substituting the values of the independent parameters in the corresponding
mathematical expressions
Assume that the characteristics to be estimated can be expressed in terms of some
mathematical expressions
Analytical estimation techniques:
Analytical estimation techniques derive the required results starting with certain basic
assumptions regarding project.
This technique have certain scientific basis
42.
Halstead’s softwarescience is an example of this technique
Halstead’s software science can be used to derive results starting with a few simple assumptions
Halstead Software Science: - An analytical technique Halstead’s software science is an analytical
technique to measure size, development effort, and development cost of software products.
Halstead used a few primitive program parameters to develop the expressions for overall
program length, potential minimum value, actual volume, effort
Basically useful for estimating software maintenance efforts
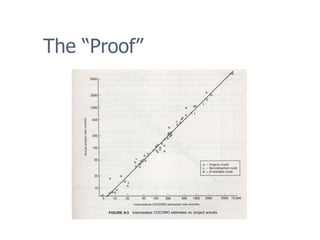
COCOMO(Constructive Cost Model)
Was first proposed by Dr. Barry Boehm in 1981
Is a heuristic estimation technique – this technique assumes that relationship among different
parameters can be modeled using some mathematical expression
This approach implies that size is primary factor for cost, other factors have lesser effect.
Constructive implies that the complexity.
COCOMO prescribes a three stage process for project estimation
An initial estimate is obtained and over next two stages the initial estimate is refined to arrive at
a more accurate estimate
Project used in this model have following attributes:
o Ranging in size from 2000 to 100,000 lines of code
o Programming languages ranging from assembly to PL/1
o These projects were based on the waterfall model of software development
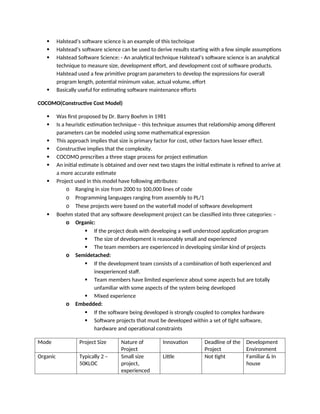
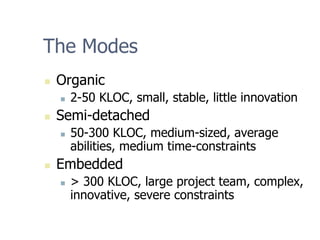
Boehm stated that any software development project can be classified into three categories: -
o Organic:
If the project deals with developing a well understood application program
The size of development is reasonably small and experienced
The team members are experienced in developing similar kind of projects
o Semidetached:
If the development team consists of a combination of both experienced and
inexperienced staff.
Team members have limited experience about some aspects but are totally
unfamiliar with some aspects of the system being developed
Mixed experience
o Embedded:
If the software being developed is strongly coupled to complex hardware
Software projects that must be developed within a set of tight software,
hardware and operational constraints
Mode Project Size Nature of
Project
Innovation Deadline of the
Project
Development
Environment
Organic Typically 2 –
50KLOC
Small size
project,
experienced
Little Not tight Familiar & In
house
43.
developers in
the familiar
environment.
SemidetachedTypically 50 –
300 KLOC
Medium size
project,
Medium size
team, average
previous
experience on
similar project
Medium Medium Medium
Embedded Typically over
300 KLOC
Large project,
Real time
systems,
Complex
interfaces, very
little previous
experience
Significant Tight Complex
hardware/
customer
interfa
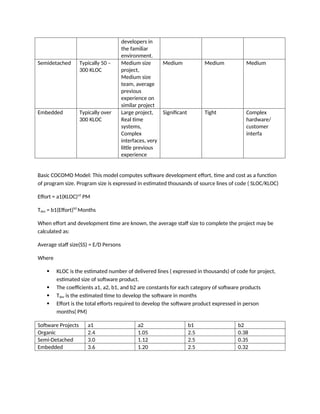
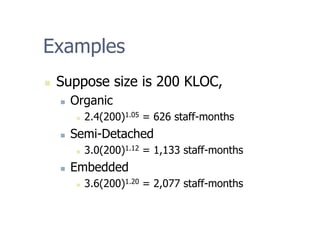
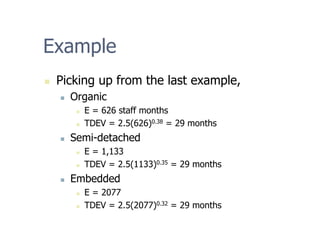
Basic COCOMO Model: This model computes software development effort, time and cost as a function
of program size. Program size is expressed in estimated thousands of source lines of code ( SLOC/KLOC)
Effort = a1(KLOC)a2
PM
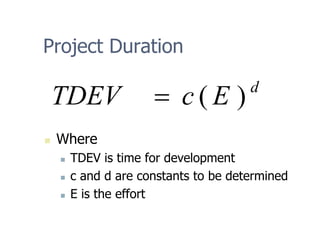
Tdev = b1(Effort)b2
Months
When effort and development time are known, the average staff size to complete the project may be
calculated as:
Average staff size(SS) = E/D Persons
Where
KLOC is the estimated number of delivered lines ( expressed in thousands) of code for project,
estimated size of software product.
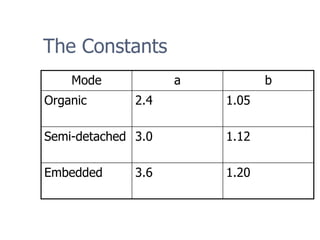
The coefficients a1, a2, b1, and b2 are constants for each category of software products
Tdev is the estimated time to develop the software in months
Effort is the total efforts required to develop the software product expressed in person
months( PM)
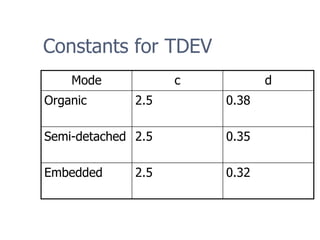
Software Projects a1 a2 b1 b2
Organic 2.4 1.05 2.5 0.38
Semi-Detached 3.0 1.12 2.5 0.35
Embedded 3.6 1.20 2.5 0.32
44.
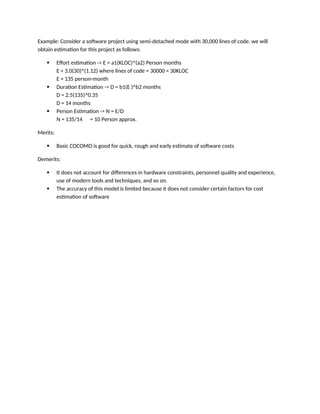
Example: Consider asoftware project using semi-detached mode with 30,000 lines of code. we will
obtain estimation for this project as follows:
Effort estimation -> E = a1(KLOC)^(a2) Person months
E = 3.0(30)^(1.12) where lines of code = 30000 = 30KLOC
E = 135 person-month
Duration Estimation -> D = b1(E )^b2 months
D = 2.5(135)^0.35
D = 14 months
Person Estimation -> N = E/D
N = 135/14 = 10 Person approx.
Merits:
Basic COCOMO is good for quick, rough and early estimate of software costs
Demerits:
It does not account for differences in hardware constraints, personnel quality and experience,
use of modern tools and techniques, and so on.
The accuracy of this model is limited because it does not consider certain factors for cost
estimation of software
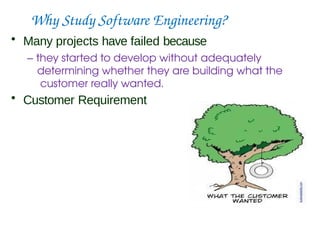
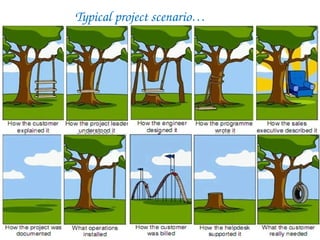
Why Study SoftwareEngineering?
• Many projects have failed because
– they started to develop without adequately
determining whether they are building what the
customer really wanted.
• Customer Requirement
Requirements
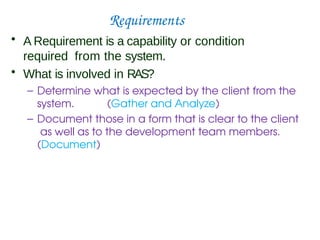
• A Requirementis a capability or condition
required from the system.
• What is involved in RAS?
– Determine what is expected by the client from the
system. (Gather and Analyze)
– Document those in a form that is clear to the client
as well as to the development team members.
(Document)
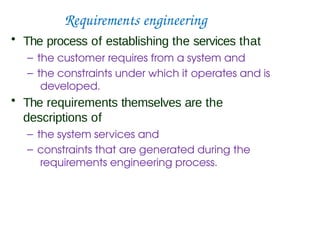
Requirements engineering
• Theprocess of establishing the services that
– the customer requires from a system and
– the constraints under which it operates and is
developed.
• The requirements themselves are the
descriptions of
– the system services and
– constraints that are generated during the
requirements engineering process.
52.
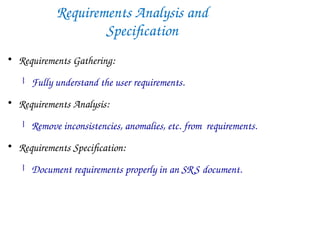
Requirements Analysis and
Specification
RequirementsGathering:
Fully understand the user requirements.
Requirements Analysis:
Remove inconsistencies, anomalies, etc. from requirements.
Requirements Specification:
Document requirements properly in an SRS document.
53.
Need for SRS…
•Good SRS reduces development cost
– Req. errors are expensive to fix later
– Req. changes cost a lot (typically 40% changes)
– Good SRS can minimize changes and errors
– Substantial savings --- effort spent during req. saves
multiple times that effort
54.
Uses of SRSDocument
• Establishes the basis for agreement between
the customers and the suppliers
• Forms the starting point for development.
• Provide a basis for estimating costs and
schedules.
• Provide a baseline for validation and
verification.
• Facilitates transfer.
• Serves as a basis for enhancement.
• The SRS can serve as the basis for writing User Manual
for the software:
– User Manual: Describes the functionality from the
perspective of a user --- An important document for
users.
– Typically also describes how to carry out the required
tasks with examples.
55.
SRS Document: Stakeholders
•SRS intended for a diverse audience:
– Customers and users for validation, contract, ...
– Systems (requirements) analysts
– Developers, programmers to implement the system
– Testers to check that the requirements have been
met
– Project Managers to measure and control the
project
• Different levels of detail and formality is needed
for each audience
• Different templates for requirements
specifications:
– Often variations of IEEE 830
56.
Types of Requirements
•Functional requirements
– Statements of services the system should provide,
how the system should react to particular inputs and
how the system should behave in particular
situations.
• Non-functional requirements
– Constraints on the services or functions offered by
the system such as timing constraints, constraints on
the development process etc.
– Often apply to the system as a whole rather than
individual features or services.
57.
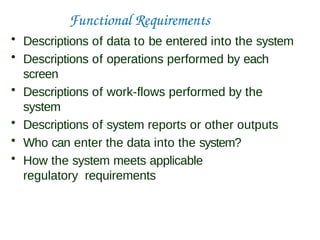
Functional Requirements
• Descriptionsof data to be entered into the system
• Descriptions of operations performed by each
screen
• Descriptions of work-flows performed by the
system
• Descriptions of system reports or other outputs
• Who can enter the data into the system?
• How the system meets applicable
regulatory requirements
58.
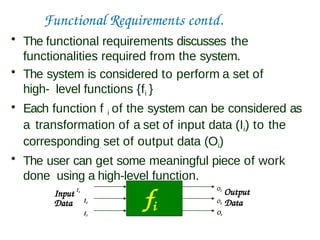
Functional Requirements contd.
•The functional requirements discusses the
functionalities required from the system.
• The system is considered to perform a set of
high- level functions {fi }
• Each function f i of the system can be considered as
a transformation of a set of input data (Ii) to the
corresponding set of output data (Oi)
• The user can get some meaningful piece of work
done using a high-level function.
fi
Data
Input I1
O1
Output
O2 Data
O3
I2
I3
59.
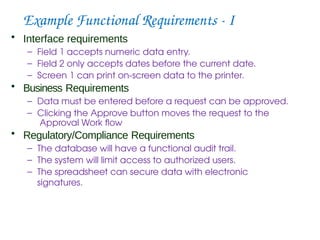
Example Functional Requirements- I
• Interface requirements
– Field 1 accepts numeric data entry.
– Field 2 only accepts dates before the current date.
– Screen 1 can print on-screen data to the printer.
• Business Requirements
– Data must be entered before a request can be approved.
– Clicking the Approve button moves the request to the
Approval Work flow
• Regulatory/Compliance Requirements
– The database will have a functional audit trail.
– The system will limit access to authorized users.
– The spreadsheet can secure data with electronic
signatures.
60.
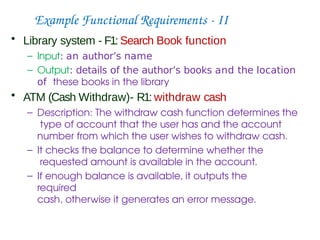
Example Functional Requirements- II
• Library system - F1: Search Book function
– Input: an author’s name
– Output: details of the author’s books and the location
of these books in the library
• ATM (Cash Withdraw)- R1: withdraw cash
– Description: The withdraw cash function determines the
type of account that the user has and the account
number from which the user wishes to withdraw cash.
– It checks the balance to determine whether the
requested amount is available in the account.
– If enough balance is available, it outputs the
required
cash, otherwise it generates an error message.
61.
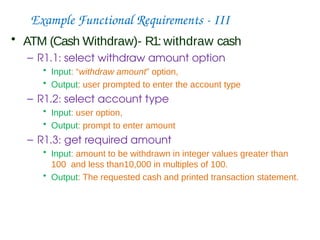
Example Functional Requirements- III
• ATM (Cash Withdraw)- R1: withdraw cash
– R1.1: select withdraw amount option
• Input: “withdraw amount” option,
• Output: user prompted to enter the account type
– R1.2: select account type
• Input: user option,
• Output: prompt to enter amount
– R1.3: get required amount
• Input: amount to be withdrawn in integer values greater than
100 and less than10,000 in multiples of 100.
• Output: The requested cash and printed transaction statement.
62.
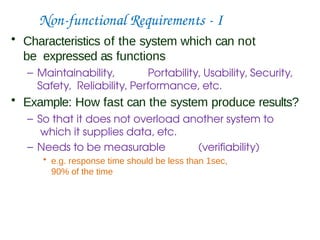
Non-functional Requirements -I
• Characteristics of the system which can not
be expressed as functions
– Maintainability, Portability, Usability, Security,
Safety, Reliability, Performance, etc.
• Example: How fast can the system produce results?
– So that it does not overload another system to
which it supplies data, etc.
– Needs to be measurable (verifiability)
• e.g. response time should be less than 1sec,
90% of the time
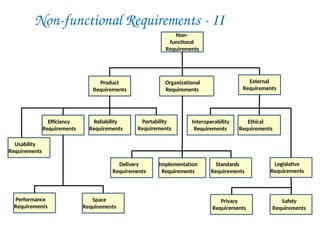
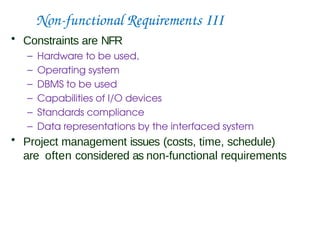
Non-functional Requirements III
•Constraints are NFR
– Hardware to be used,
– Operating system
– DBMS to be used
– Capabilities of I/O devices
– Standards compliance
– Data representations by the interfaced system
• Project management issues (costs, time, schedule)
are often considered as non-functional requirements
65.
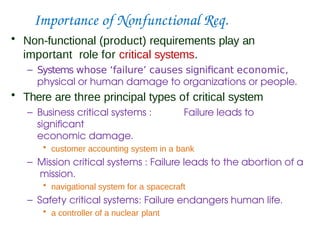
Importance of NonfunctionalReq.
• Non-functional (product) requirements play an
important role for critical systems.
– Systems whose ‘failure’ causes significant economic,
physical or human damage to organizations or people.
• There are three principal types of critical system
– Business critical systems : Failure leads to
significant
economic damage.
• customer accounting system in a bank
– Mission critical systems : Failure leads to the abortion of a
mission.
• navigational system for a spacecraft
– Safety critical systems: Failure endangers human life.
• a controller of a nuclear plant
66.
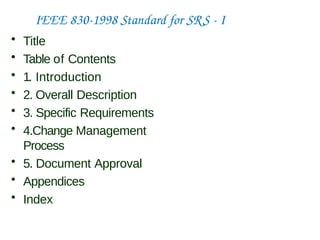
IEEE 830-1998 Standardfor SRS - I
• Title
• Table of Contents
• 1. Introduction
• 2. Overall Description
• 3. Specific Requirements
• 4.Change Management
Process
• 5. Document Approval
• Appendices
• Index
67.
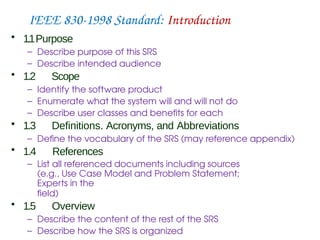
IEEE 830-1998 Standard:Introduction
• 1.1Purpose
– Describe purpose of this SRS
– Describe intended audience
• 1.2 Scope
– Identify the software product
– Enumerate what the system will and will not do
– Describe user classes and benefits for each
• 1.3 Definitions. Acronyms, and Abbreviations
– Define the vocabulary of the SRS (may reference appendix)
• 1.4 References
– List all referenced documents including sources
(e.g., Use Case Model and Problem Statement;
Experts in the
field)
• 1.5 Overview
– Describe the content of the rest of the SRS
– Describe how the SRS is organized
68.
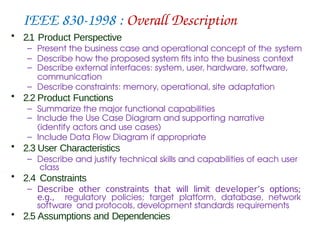
IEEE 830-1998 :Overall Description
• 2.1 Product Perspective
– Present the business case and operational concept of the system
– Describe how the proposed system fits into the business context
– Describe external interfaces: system, user, hardware, software,
communication
– Describe constraints: memory, operational, site adaptation
• 2.2 Product Functions
– Summarize the major functional capabilities
– Include the Use Case Diagram and supporting narrative
(identify actors and use cases)
– Include Data Flow Diagram if appropriate
• 2.3 User Characteristics
– Describe and justify technical skills and capabilities of each user
class
• 2.4 Constraints
– Describe other constraints that will limit developer’s options;
e.g., regulatory policies; target platform, database, network
software and protocols, development standards requirements
• 2.5 Assumptions and Dependencies
69.
IEEE 830-1998 :Specific Requirements
• 3.1 External Interfaces
– Detail all inputs and outputs
– Examples: GUI screens, file formats
• 3.2 Functional Requirements
– Include detailed specifications of all the functional
requirements
• 2.3 Non-Functional Requirements
– Describes all non-functional requirements that
can’t be expressed as a function.
• Characteristics of the system which can not be expressed as
functions.
• e.g. performance requirements, database requirements,
design constraints, quality attributes, . . .
Identify whererequirements gathering fits into
the SDLC
Identify common stakeholder categories in a
systems development project
Write clear, effective, and unambiguous
functional requirements
74.
Implem-
entation
Testing
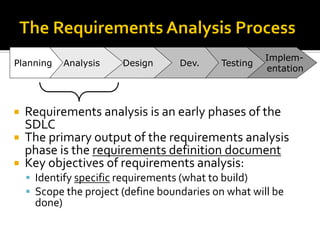
Requirements analysisis an early phases of the
SDLC
The primary output of the requirements analysis
phase is the requirements definition document
Key objectives of requirements analysis:
▪ Identify specific requirements (what to build)
▪ Scope the project (define boundaries on what will be
done)
Dev.
Design
Analysis
Planning
75.
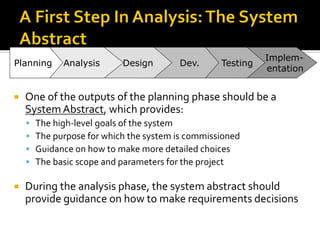
One ofthe outputs of the planning phase should be a
SystemAbstract, which provides:
▪ The high-level goals of the system
▪ The purpose for which the system is commissioned
▪ Guidance on how to make more detailed choices
▪ The basic scope and parameters for the project
During the analysis phase, the system abstract should
provide guidance on how to make requirements decisions
Implem-
entation
Testing
Dev.
Design
Analysis
Planning
76.
Stakeholders arepeople, groups or
organizations (internal or external) that can
affect or will be affected by the project
Clarifying and managing the expectations of
the project stakeholders is essential to
project success
77.
A StakeholderAnalysis identifies and accommodates the
expectations and needs of the project’s stakeholders
Step 1: Identify the major stakeholders for the project
▪ Consider both internal and external to the company
Step 2: Identify the critical assumptions and expectations of
the major stakeholders for the project
Examples of types of project stakeholders:
▪ Stockholders, creditors, customers/clients, production employees,
marketing staff, corporate management and staff, labor unions, local
community, capital markets/investment bankers, government
agencies, competitors, suppliers, contractors
78.
When 38IT professionals in the UK were
asked about which project stages caused
failure, respondents mentioned
“requirements definition” more than any
other phase.
79.
A requirementis a statement about an
intended product that specifies what it
should do or how it should perform.
Goal:To make as specific, unambigous, and
clear as possible.
80.
Well-known approachesto gathering and
documenting requirements include:
▪ Document analysis
▪ Stakeholder interviews
▪ Business process analysis (and re-engineering)
▪ Joint requirements workshops
▪ Use cases
81.
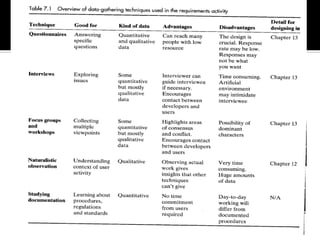
Questionnaires: Seriesof questions designed to
elicit specific information from us.The questions
may require different kinds of answers: some
require a simpleYes/No, others ask us to choose
from a set of pre-supplied answers.
Interviews: Interviews involve asking someone a
set of questions. Often interviews are face-to-
face, but they don’t have to be (more on next
page).
82.
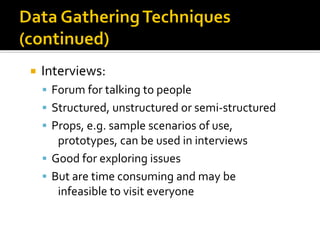
Interviews:
▪ Forumfor talking to people
▪ Structured, unstructured or semi-structured
▪ Props, e.g. sample scenarios of use,
prototypes, can be used in interviews
▪ Good for exploring issues
▪ But are time consuming and may be
infeasible to visit everyone
83.
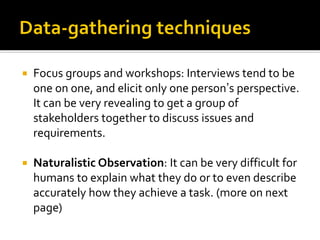
Focus groupsand workshops: Interviews tend to be
one on one, and elicit only one person’s perspective.
It can be very revealing to get a group of
stakeholders together to discuss issues and
requirements.
Naturalistic Observation: It can be very difficult for
humans to explain what they do or to even describe
accurately how they achieve a task. (more on next
page)
84.
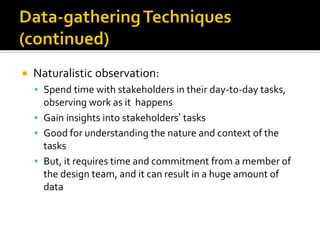
Naturalistic observation:
▪Spend time with stakeholders in their day-to-day tasks,
observing work as it happens
▪ Gain insights into stakeholders’ tasks
▪ Good for understanding the nature and context of the
tasks
▪ But, it requires time and commitment from a member of
the design team, and it can result in a huge amount of
data
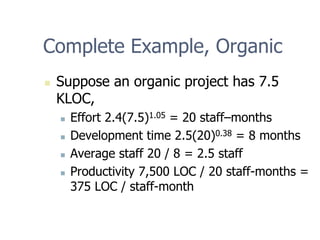
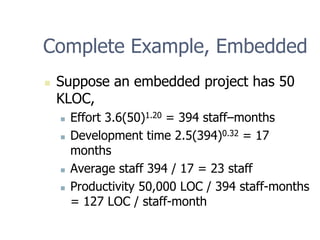
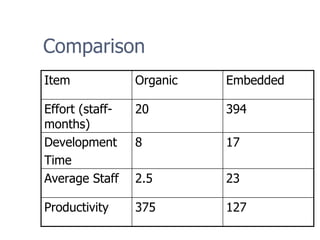
Outline
„ COCOMO ina Coconut-shell
„ Complete Examples
„ Intermediate COCOMO: Cost Drivers
„ Advantages and Limitations of COCOMO
88.
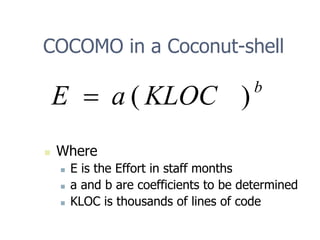
COCOMO in aCoconut-shell
b
KLOC
a
E )
(
=
„ Where
„ E is the Effort in staff months
„ a and b are coefficients to be determined
„ KLOC is thousands of lines of code
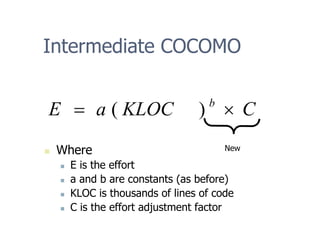
Intermediate COCOMO
„ Where
„E is the effort
„ a and b are constants (as before)
„ KLOC is thousands of lines of code
„ C is the effort adjustment factor
C
KLOC
a
E b
×
= )
(
New
101.
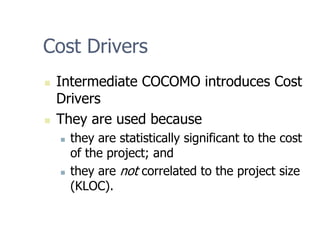
Cost Drivers
„ IntermediateCOCOMO introduces Cost
Drivers
„ They are used because
„ they are statistically significant to the cost
of the project; and
„ they are not correlated to the project size
(KLOC).
102.
Categories
„ I. ProductAttributes
„ II. Computer Attributes
„ III. Personnel Attributes
„ IV. Project Attributes
103.
I. Product Attributes
„RELY Required Software Reliability
„ DATA Data Base Size
„ CPLX Product Complexity
104.
II. Computer Attributes
„TIME Execution Time Constraint
„ STOR Main Storage Constraint
„ VIRT Virtual Machine Volatility1
„ TURN Computer Turnaround Time
1The hardware and software in combination.
105.
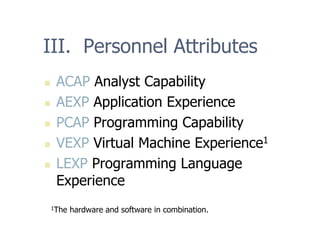
III. Personnel Attributes
„ACAP Analyst Capability
„ AEXP Application Experience
„ PCAP Programming Capability
„ VEXP Virtual Machine Experience1
„ LEXP Programming Language
Experience
1The hardware and software in combination.
106.
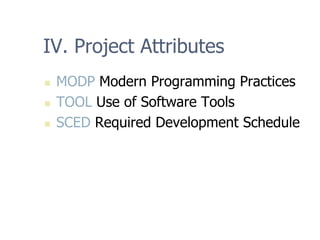
IV. Project Attributes
„MODP Modern Programming Practices
„ TOOL Use of Software Tools
„ SCED Required Development Schedule
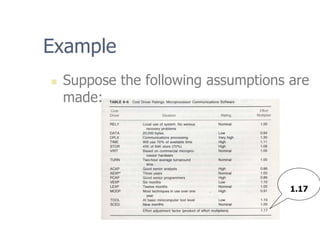
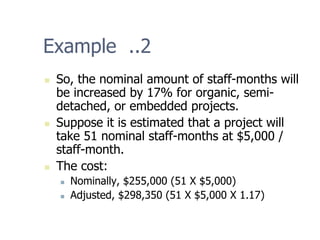
Example ..2
„ So,the nominal amount of staff-months will
be increased by 17% for organic, semi-
detached, or embedded projects.
„ Suppose it is estimated that a project will
take 51 nominal staff-months at $5,000 /
staff-month.
„ The cost:
„ Nominally, $255,000 (51 X $5,000)
„ Adjusted, $298,350 (51 X $5,000 X 1.17)
Advantages
„ Based onhistory
„ Repeatable
„ Unique adjustment factors
„ Has different modes
„ Works well on similar projects
„ Highly calibrated
„ Well-documented
„ Easy to use
111.
Limitations
„ Ignores requirementsvolatility
„ Ignores documentation
„ Ignores customer’s “skill”
„ Oversimplifies security
„ Ignores software safety
„ Ignores personnel turnover
„ Ignores many hardware issues
„ Personnel experience may be obsolete
„ Must know the cost drivers
„ Must be able to predict project size
112.
Final Word
„ “Themodels are just there to help, not
to make the management decisions for
you.”
-- Barry Boehm


![Average Staff Size
[staff]
months]
[
months]
-
[staff
=
=
=
TDEV
E
SS](https://image.slidesharecdn.com/unit-2-251213154559-89ff89ca/85/Unit-2-pdf-Software-engineering-peroject-95-320.jpg)
![Productivity
month
-
staff
KLOC
months]
-
[staff
[KLOC]
=
=
=
E
Size
P](https://image.slidesharecdn.com/unit-2-251213154559-89ff89ca/85/Unit-2-pdf-Software-engineering-peroject-96-320.jpg)