Downloaded 480 times
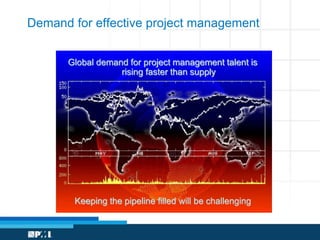
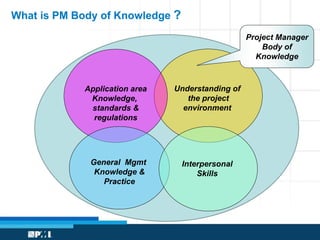
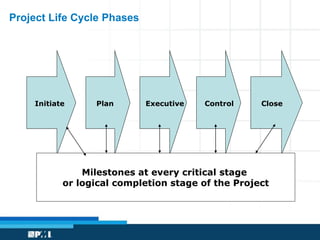
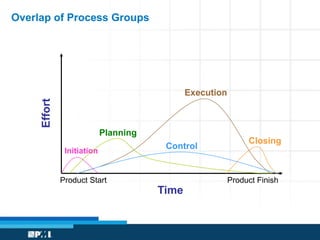

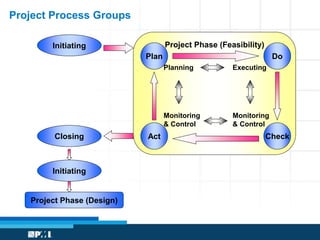

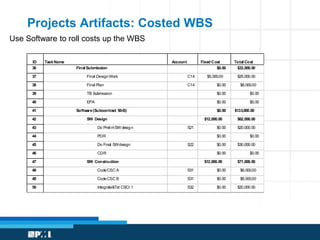
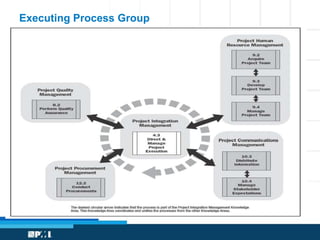
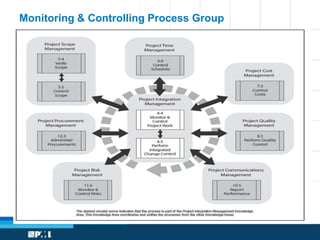
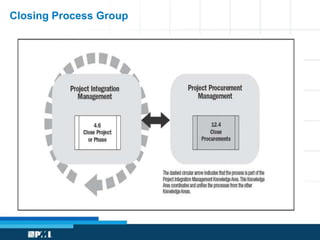
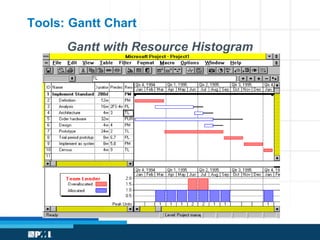
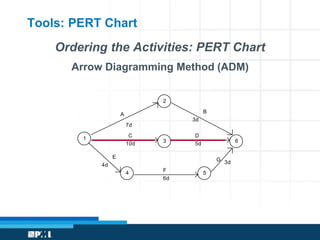
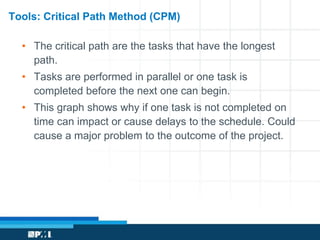
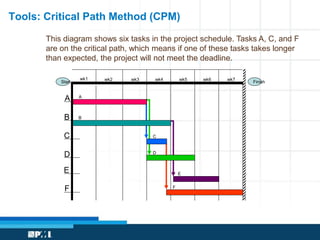
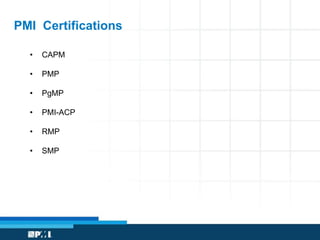
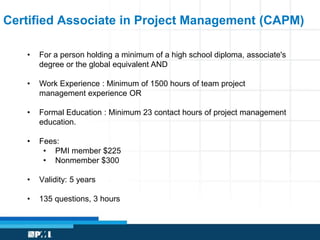


The document provides an overview of project management frameworks and concepts. It discusses the growing demand for project management skills and the project management body of knowledge. It also summarizes key project phases like initiation, planning, execution, monitoring and control, and closing. Additionally, it outlines several project management tools and techniques such as work breakdown structures, Gantt and PERT charts, critical path method, and organizational project management maturity models. Finally, it briefly discusses Agile project management trends and PMI certifications.


