Download as PDF, PPTX


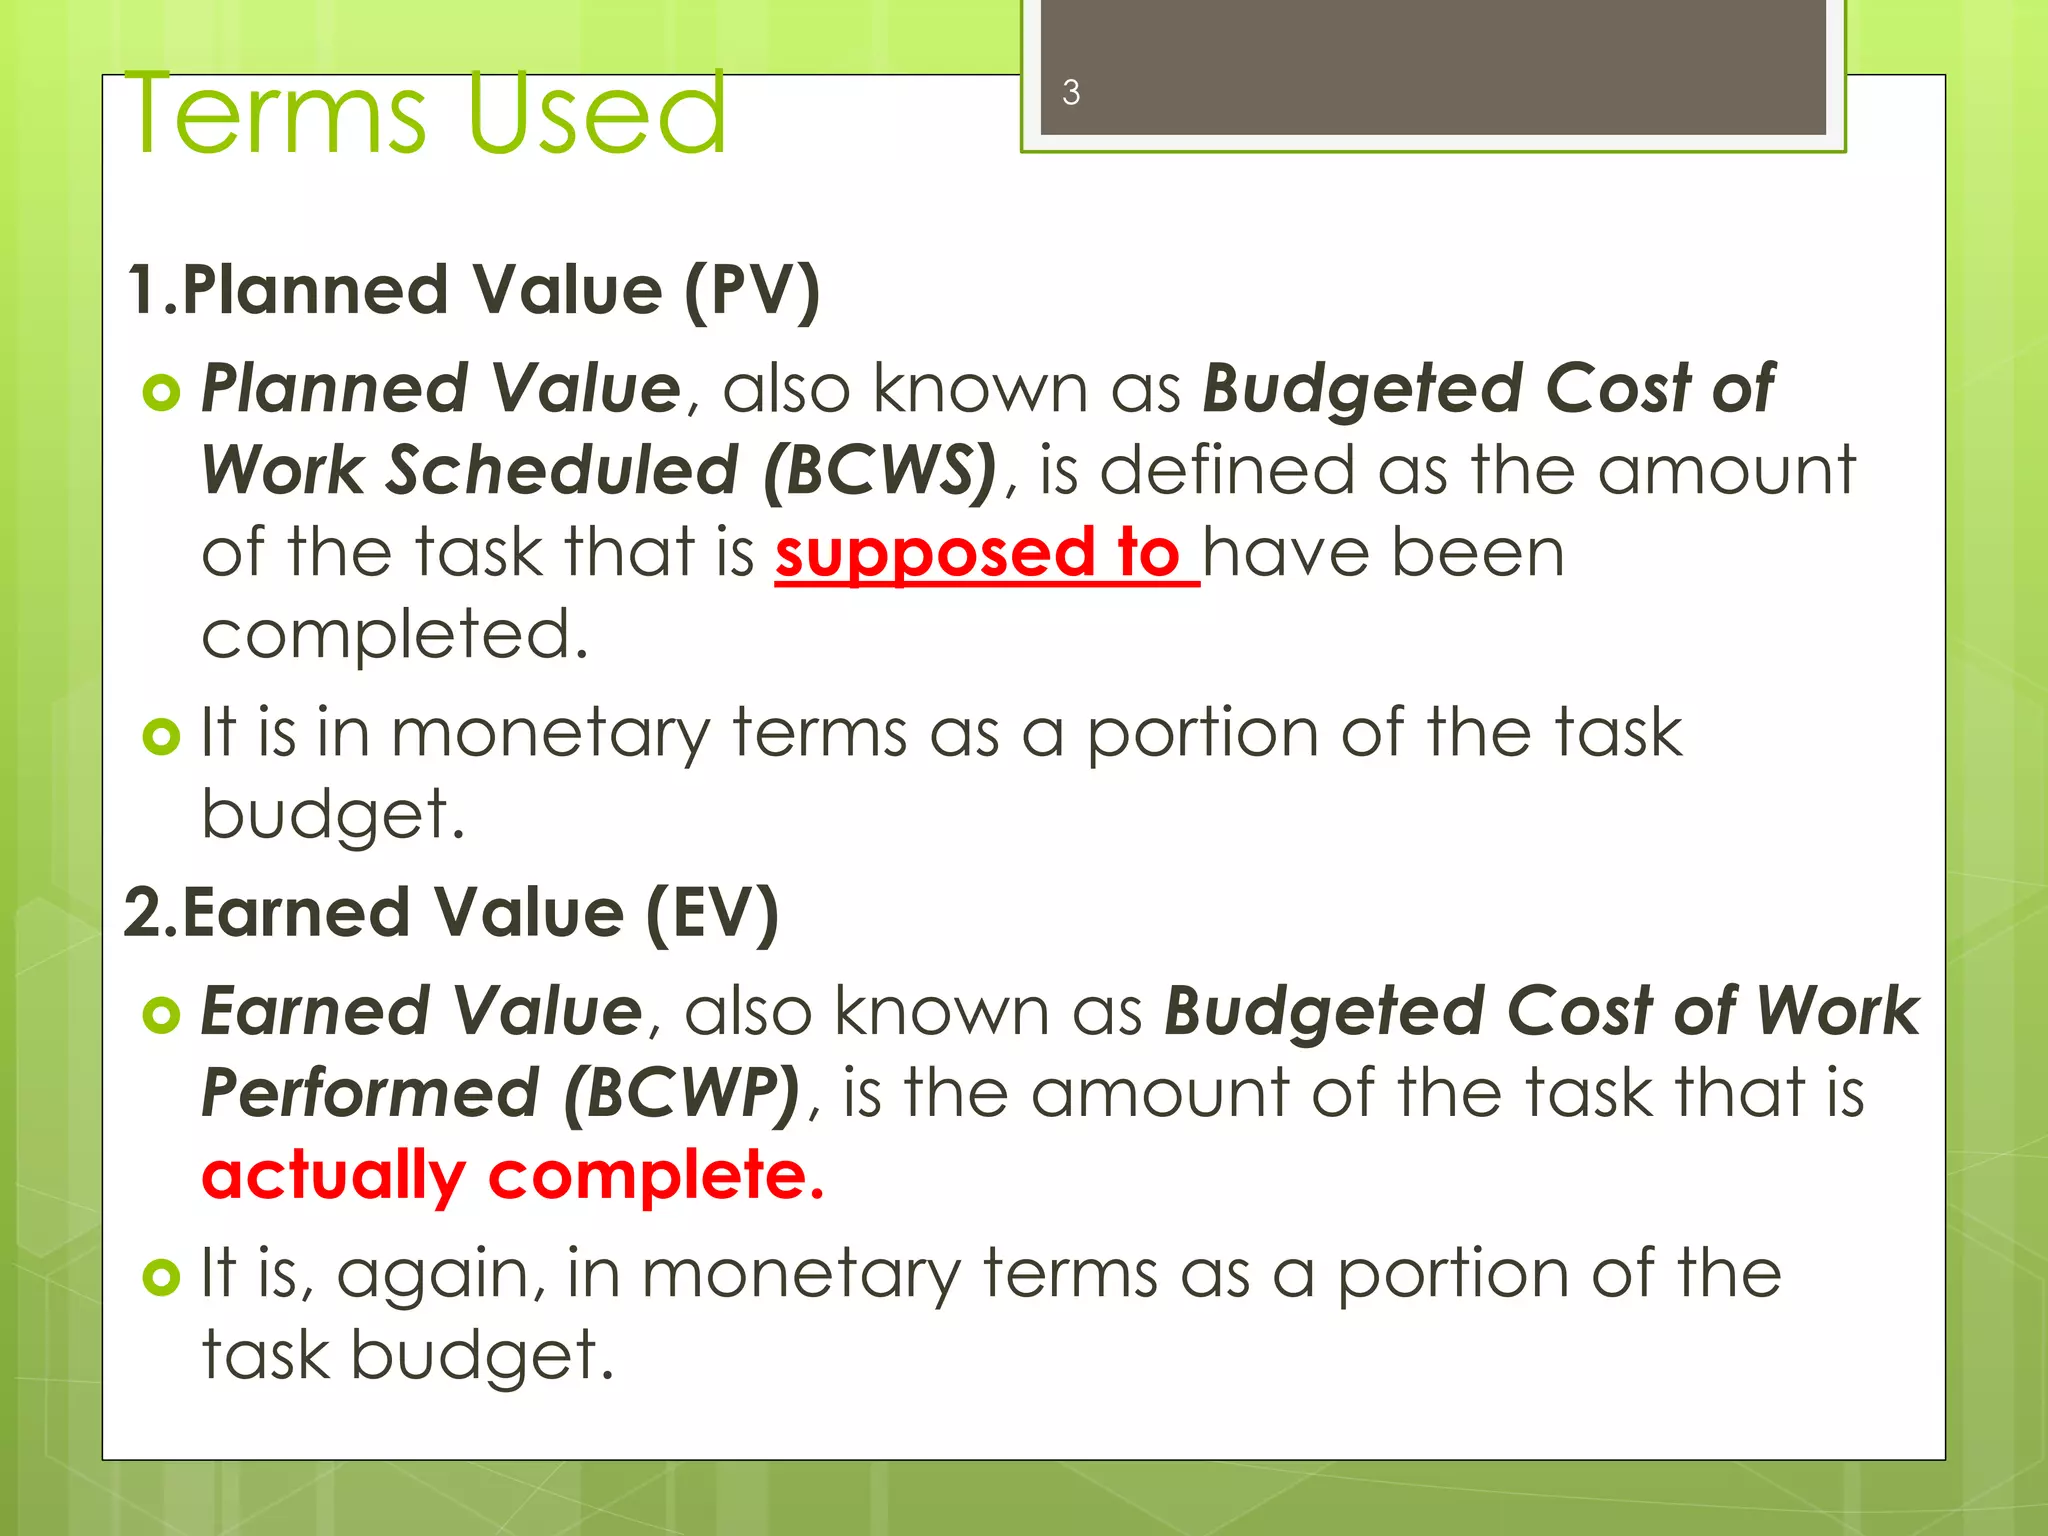

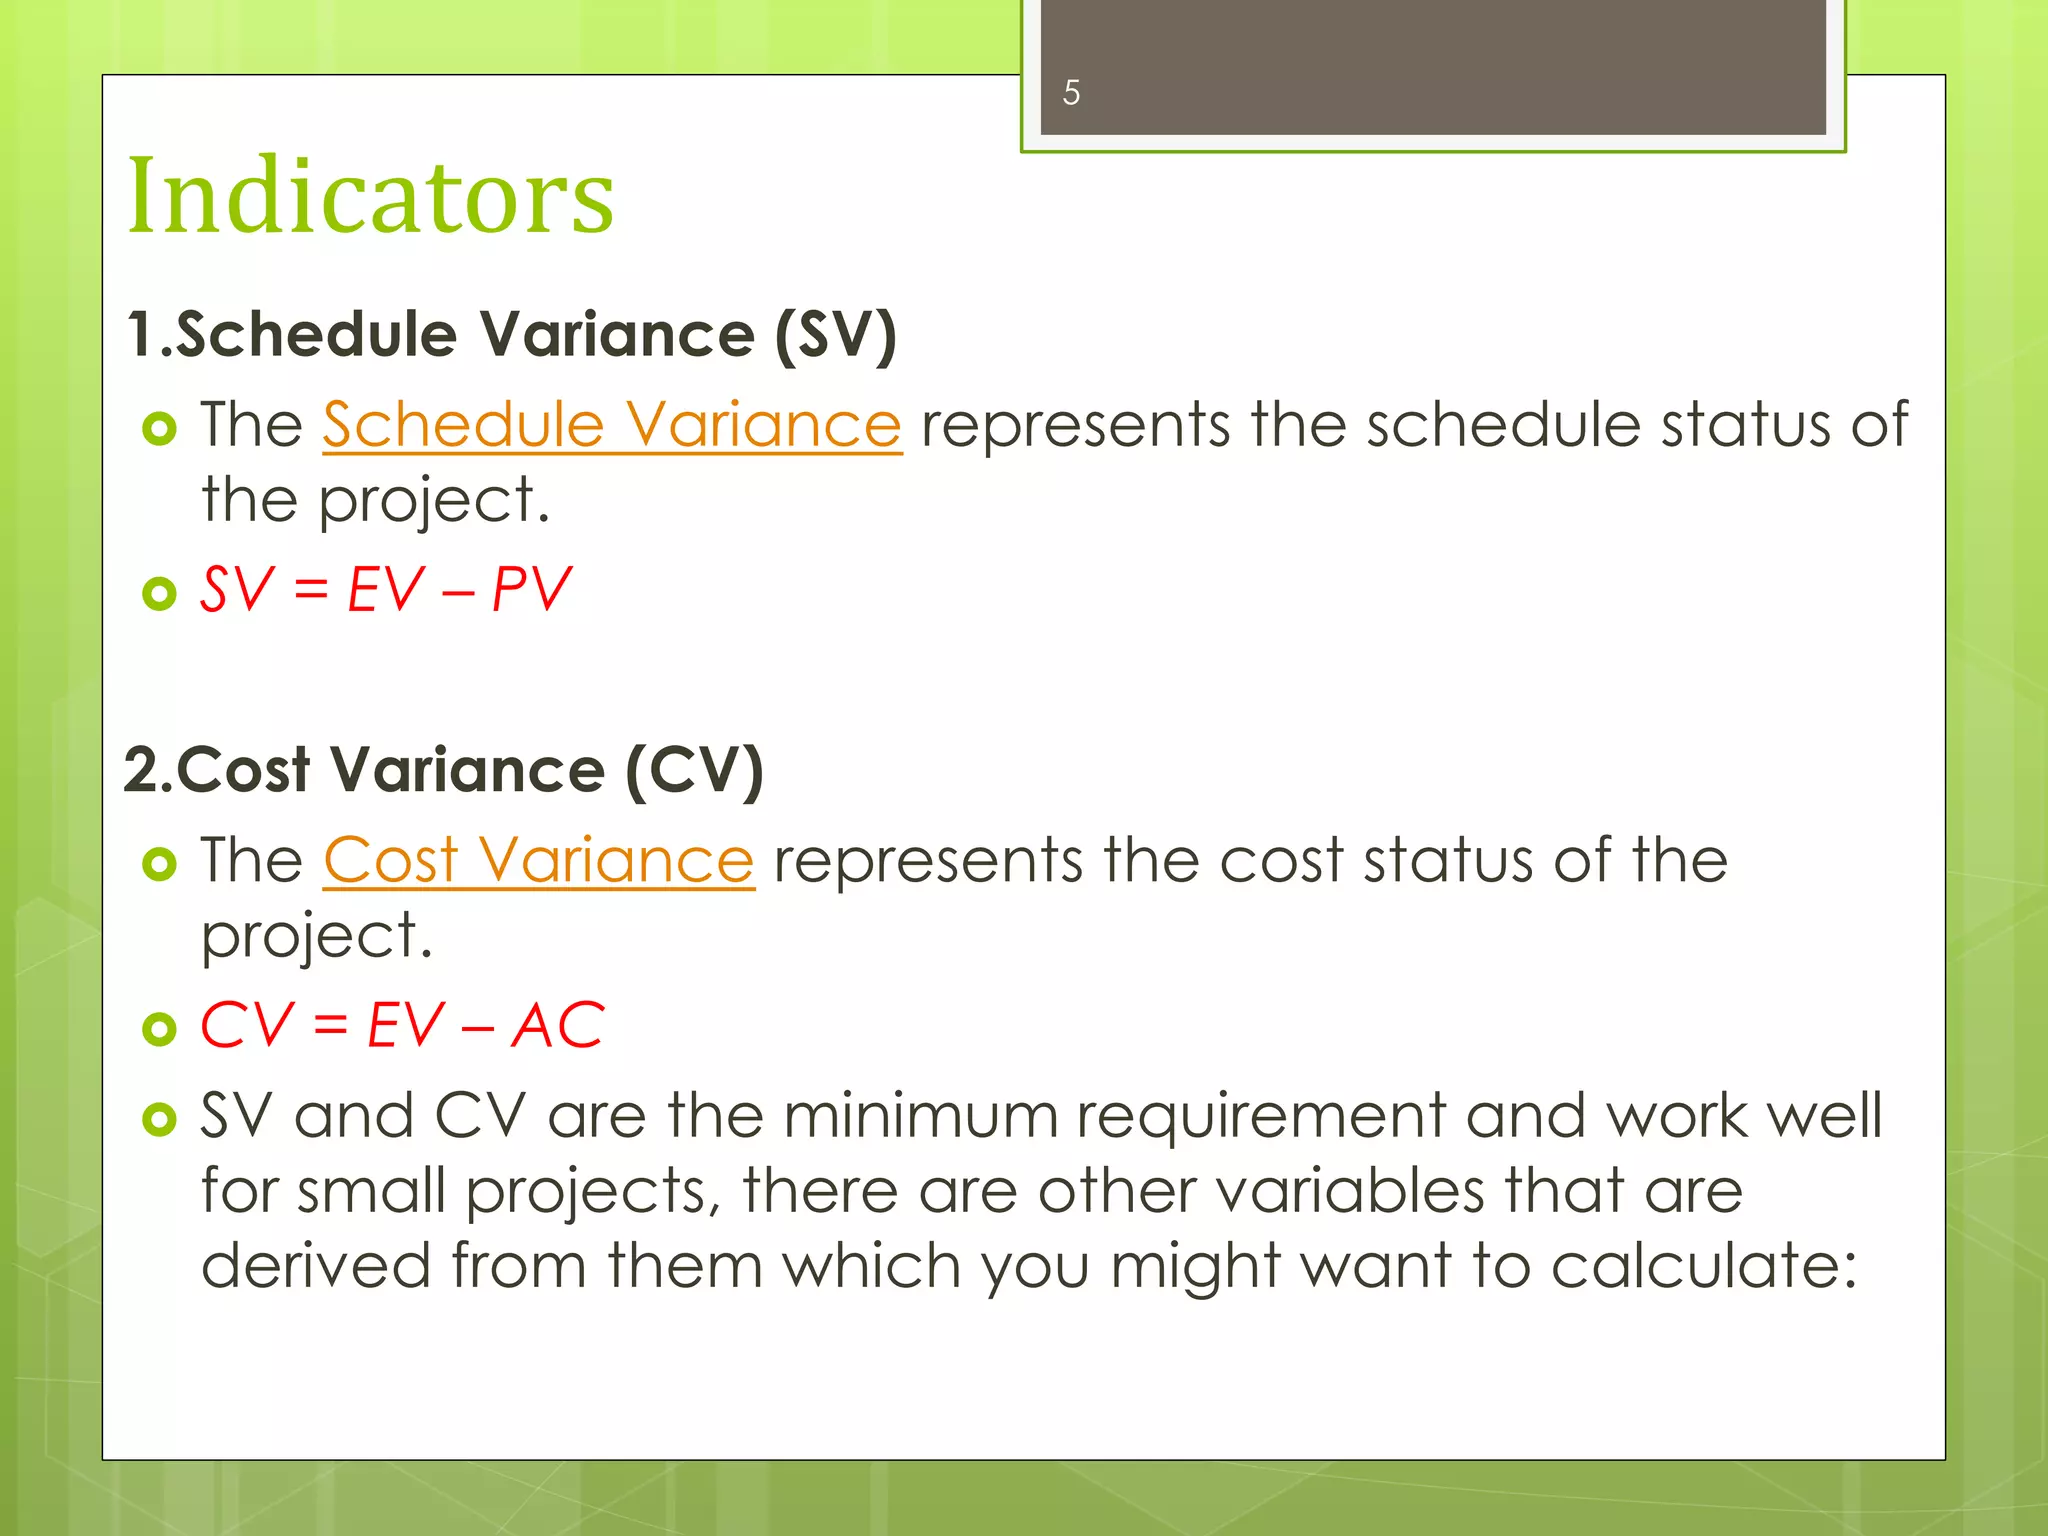
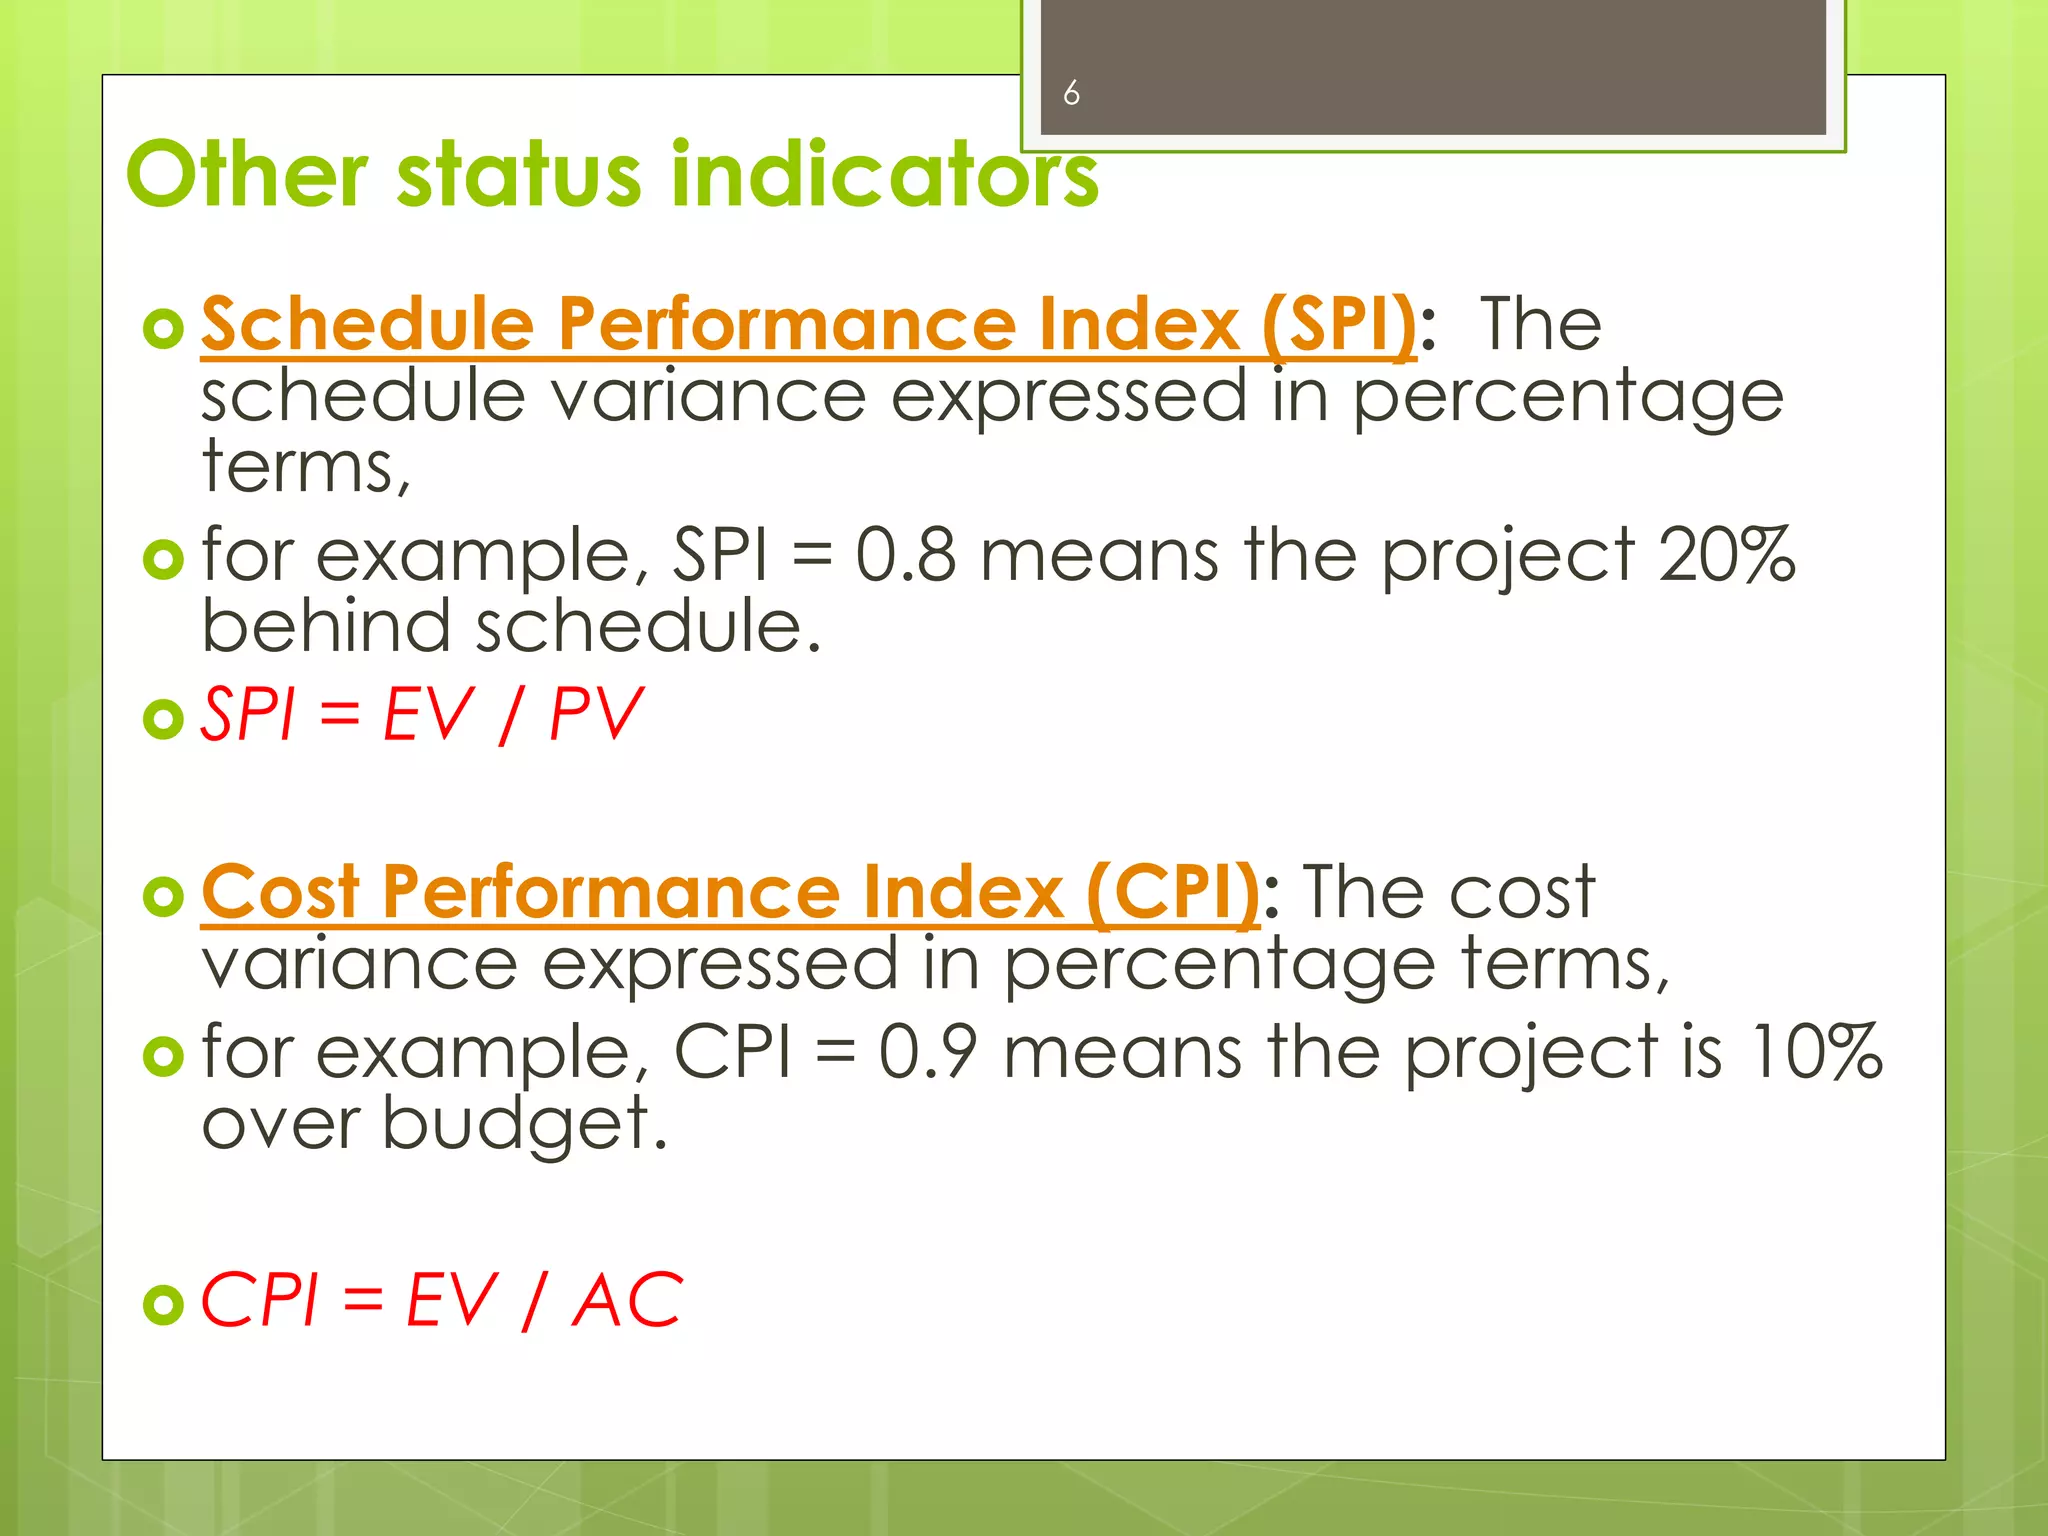


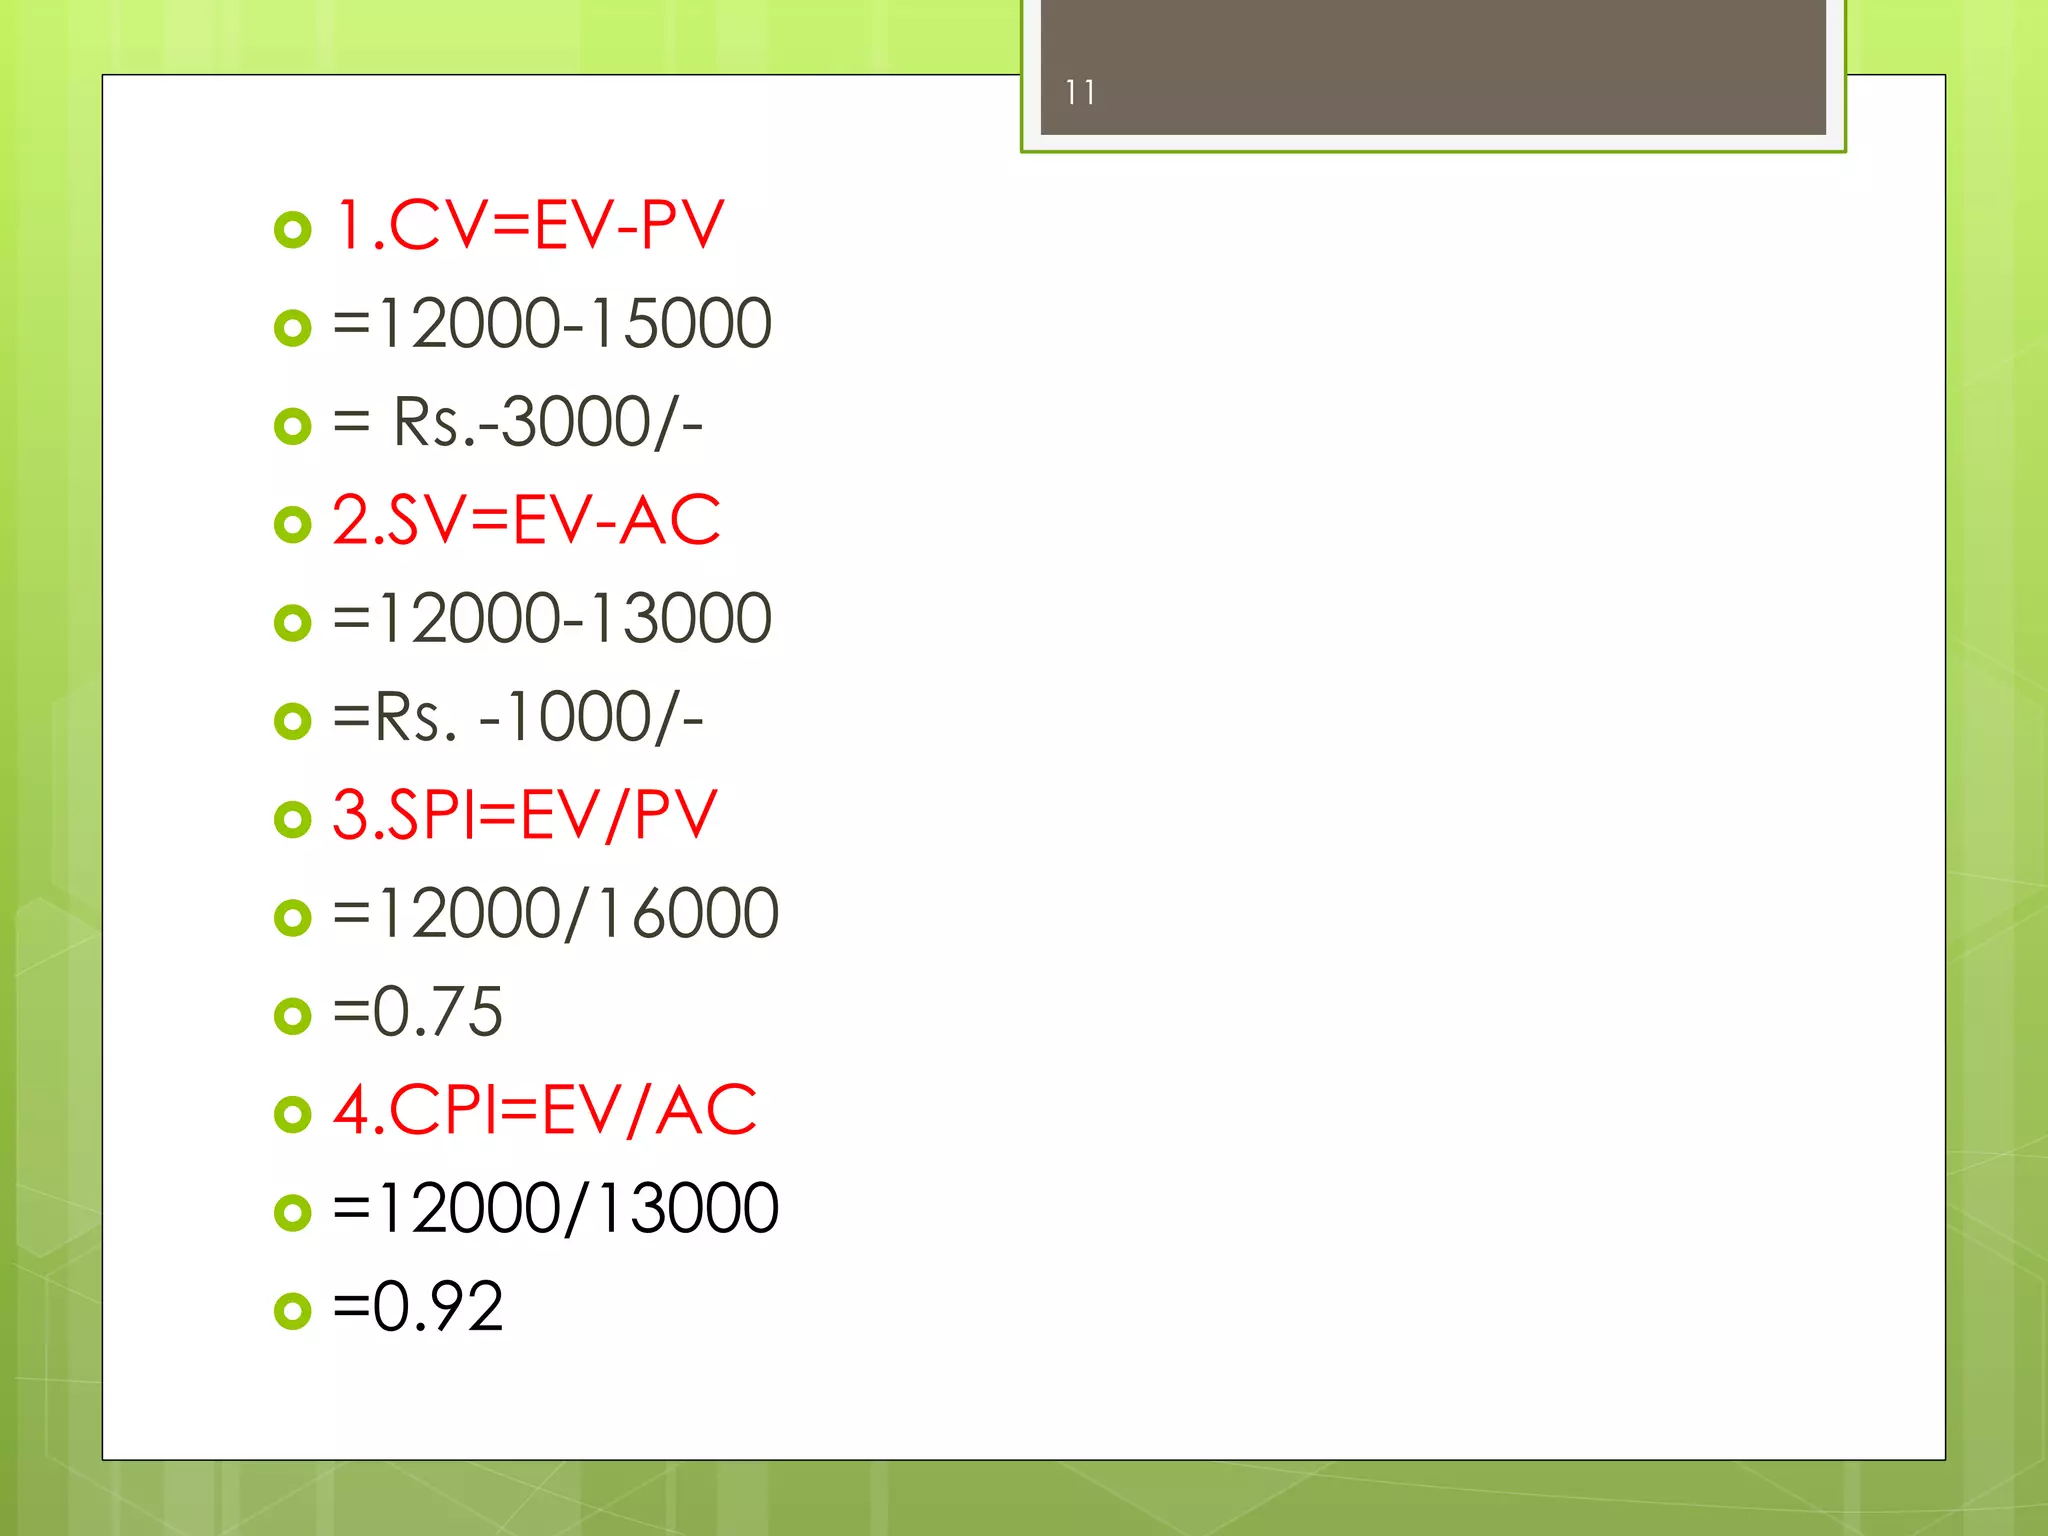


The document discusses earned value analysis, which is a project management tool used to measure project progress by comparing planned, earned, and actual values of work completed. It defines key terms like planned value, earned value, and actual cost. It describes how schedule variance, cost variance, schedule performance index, and cost performance index are calculated from these values and interpreted. An example calculation is provided to demonstrate how negative variances and indexes below 1 indicate a project is behind schedule and over budget.


