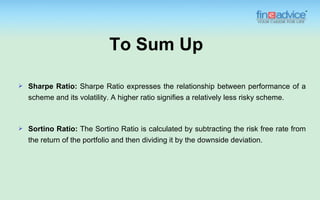
DuPont analysis is a useful technique to break down the different return on equity (ROE) generators. The ROE decomposition helps investors to concentrate separately on key indicators of financial success to define strengths and weaknesses.
Three main financial metrics drive equity return (ROE): operating performance, asset usage performance, and financial leverage. Operating output is a net profit margin or a net income separated by overall revenue or profits.
The efficiency of asset usage is determined by the turnover ratio of the assets. Leverage is calculated by the equity multiplier, equal to average assets divided by average equities.
The component parts of a firm's return on equity (ROE) are calculated using a DuPont analysis. This allows an investor to assess, which financial activities contribute the most to the ROE changes
This presentation is aimed to answer the one of the most fundamental question of Trading: "How much to trade?" You might have decided what to trade but the question how much to trade raises a critical issue which needs to be handled using Statistics. This presentation take its audience through the various money management techniques and position sizing algorithms which come handy for every trader.
Join CMT Level 1, 2 & 3 Program Courses & become a professional Technical Analyst, CMT USA Best COACHING CLASSES. CMT Institute Live Classes by Expert Faculty. Exams are available in India. Best Career in Financial Market.
https://www.ptaindia.com/chartered-market-technician/
We have all heard of Financial speculation, which involves the buying & selling of stocks, bonds, currencies, real estate or any other valuable financial instrument owing to anticipated fluctuations in its price with the aim of profiting from it.
Return on Net Worth (RONW) is used in finance as a measure of a company’s profitability. It reveals how much profit a company generates with the money that the equity shareholders have invested.
Capital Employed is represented as total assets minus current liabilities. In other words, it is the value of the assets that contribute to a company’s ability to generate revenue
In finance, the yield curve is the relation between the interest rate (or cost of borrowing) and the time to maturity of the debt for a given borrower in a given currency.
Simply put, a budget deficit occurs when an entity (often a government) spends more money than it takes in. The opposite of a budget deficit, on the other hand, is a budget surplus.
The expenses that the government incurs is always more than the income it makes. This difference or deficit is known as “Fiscal Deficit”. It is expressed as a percentage of GDP.
Seminar: Gender Board Diversity through Ownership NetworksGRAPE
Seminar on gender diversity spillovers through ownership networks at FAME|GRAPE. Presenting novel research. Studies in economics and management using econometrics methods.
This presentation poster infographic delves into the multifaceted impacts of globalization through the lens of Nike, a prominent global brand. It explores how globalization has reshaped Nike's supply chain, marketing strategies, and cultural influence worldwide, examining both the benefits and challenges associated with its global expansion.
PPrreesseenntteedd bbyy:: GGrroouupp 66
GGlloobbaalliizzaattiioonn
o f
PP
oo
ll
yy
ee
ss
tt
ee
rr
RR
uu
bb
bb
ee
rr
EE
tt
hh
yy
ll
ee
nn
ee
VV
ii
nn
yy
ll
AA
cc
ee
tt
aa
tt
ee
GG
ee
nn
uu
ii
nn
ee
LL
ee
aa
tt
hh
ee
rr
SS
yy
nn
tt
hh
ee
tt
ii
cc
LL
ee
aa
tt
hh
ee
rr
CC
oo
tt
tt
oo
nn
C
o
u
n
t
r
i
e
s
I
n
v
o
l
v
e
d
Ni
k
e
h
a
s
m
o
r
e
t
h
a
n
7
0
0
s
h
o
p
s
i
n
c
o
n
t
r
a
c
t
w
i
t
h
w
o
r
l
d
w
i
d
e,
w
h
e
r
e
i
n
t
h
e
i
r
offi
c
e
s
a
n
d
i
n
d
e
p
e
n
d
e
n
t
fa
c
t
o
r
y
o
u
t
l
e
t
s
a
r
e
fo
u
n
d
w
i
t
h
i
n
t
h
e
p
r
e
m
i
s
e
s
of
ap
p
r
o
x
i
m
a
t
e
l
y
4
5
c
o
u
n
t
r
i
e
s.
AAuussttrraalliiaa
China
India
IInnddoonneessiiaa
TThhaaiillaanndd
TTuurrkkeeyy
USA
VViieettnnaamm
NNiikkee SSuuppppllyy CChhaaiinn
RRuubbbbeerr,, FFaabbrriicc
aanndd ootthheerr rraaww
mmaatteerriiaallss
Shoe
MMaannuuffaaccttuurriinngg
aanndd AAsssseemmbbllyy
MMaarrkkeettiinngg
SSppoorrttiinngg ggooooddss,,
ddeevveellooppmmeenntt
aanndd SShhooee ssttoorreess
OOnnlliinnee,, CCaattaalloogg
aanndd ootthheerr rreettaaiill
NNiikkee bbrraannddeedd
shoes
PPrroodduucctt
ddeevveellooppmmeenntt
CCuussttoommeerr nneeeeddss//wwaannttss ffeeeeddbbaacckk
NNiikk
Nike Supply Chain
Globalization of Nike
Nike Manufacturing Process
Rubber Materials Nike
Ethylene Vinyl Acetate Nike
Genuine Leather Nike
Synthetic Leather Nike
Cotton in Nike Apparel
Nike Shops Worldwide
Nike Manufacturing Countries
Cold Cement Assembly Nike
3D Printing Nike Shoes
Nike Product Development
Nike Marketing Strategies
Nike Customer Feedback
Nike Distribution Centers
Automation in Nike Manufacturing
Nike Consumer Direct Acceleration
Nike Logistics and Transport
The European Unemployment Puzzle: implications from population agingGRAPE
We study the link between the evolving age structure of the working population and unemployment. We build a large new Keynesian OLG model with a realistic age structure, labor market frictions, sticky prices, and aggregate shocks. Once calibrated to the European economy, we quantify the extent to which demographic changes over the last three decades have contributed to the decline of the unemployment rate. Our findings yield important implications for the future evolution of unemployment given the anticipated further aging of the working population in Europe. We also quantify the implications for optimal monetary policy: lowering inflation volatility becomes less costly in terms of GDP and unemployment volatility, which hints that optimal monetary policy may be more hawkish in an aging society. Finally, our results also propose a partial reversal of the European-US unemployment puzzle due to the fact that the share of young workers is expected to remain robust in the US.
How to get verified on Coinbase Account?_.docxBuy bitget
t's important to note that buying verified Coinbase accounts is not recommended and may violate Coinbase's terms of service. Instead of searching to "buy verified Coinbase accounts," follow the proper steps to verify your own account to ensure compliance and security.
2. Elemental Economics - Mineral demand.pdfNeal Brewster
After this second you should be able to: Explain the main determinants of demand for any mineral product, and their relative importance; recognise and explain how demand for any product is likely to change with economic activity; recognise and explain the roles of technology and relative prices in influencing demand; be able to explain the differences between the rates of growth of demand for different products.
Financial Assets: Debit vs Equity Securities.pptxWrito-Finance
financial assets represent claim for future benefit or cash. Financial assets are formed by establishing contracts between participants. These financial assets are used for collection of huge amounts of money for business purposes.
Two major Types: Debt Securities and Equity Securities.
Debt Securities are Also known as fixed-income securities or instruments. The type of assets is formed by establishing contracts between investor and issuer of the asset.
• The first type of Debit securities is BONDS. Bonds are issued by corporations and government (both local and national government).
• The second important type of Debit security is NOTES. Apart from similarities associated with notes and bonds, notes have shorter term maturity.
• The 3rd important type of Debit security is TRESURY BILLS. These securities have short-term ranging from three months, six months, and one year. Issuer of such securities are governments.
• Above discussed debit securities are mostly issued by governments and corporations. CERTIFICATE OF DEPOSITS CDs are issued by Banks and Financial Institutions. Risk factor associated with CDs gets reduced when issued by reputable institutions or Banks.
Following are the risk attached with debt securities: Credit risk, interest rate risk and currency risk
There are no fixed maturity dates in such securities, and asset’s value is determined by company’s performance. There are two major types of equity securities: common stock and preferred stock.
Common Stock: These are simple equity securities and bear no complexities which the preferred stock bears. Holders of such securities or instrument have the voting rights when it comes to select the company’s board of director or the business decisions to be made.
Preferred Stock: Preferred stocks are sometime referred to as hybrid securities, because it contains elements of both debit security and equity security. Preferred stock confers ownership rights to security holder that is why it is equity instrument
<a href="https://www.writofinance.com/equity-securities-features-types-risk/" >Equity securities </a> as a whole is used for capital funding for companies. Companies have multiple expenses to cover. Potential growth of company is required in competitive market. So, these securities are used for capital generation, and then uses it for company’s growth.
Concluding remarks
Both are employed in business. Businesses are often established through debit securities, then what is the need for equity securities. Companies have to cover multiple expenses and expansion of business. They can also use equity instruments for repayment of debits. So, there are multiple uses for securities. As an investor, you need tools for analysis. Investment decisions are made by carefully analyzing the market. For better analysis of the stock market, investors often employ financial analysis of companies.
how to sell pi coins in South Korea profitably.DOT TECH
Yes. You can sell your pi network coins in South Korea or any other country, by finding a verified pi merchant
What is a verified pi merchant?
Since pi network is not launched yet on any exchange, the only way you can sell pi coins is by selling to a verified pi merchant, and this is because pi network is not launched yet on any exchange and no pre-sale or ico offerings Is done on pi.
Since there is no pre-sale, the only way exchanges can get pi is by buying from miners. So a pi merchant facilitates these transactions by acting as a bridge for both transactions.
How can i find a pi vendor/merchant?
Well for those who haven't traded with a pi merchant or who don't already have one. I will leave the what'sapp number of my personal pi merchant who i trade pi with.
Message: +12349014282 VIA Whatsapp.
#pi #sell #nigeria #pinetwork #picoins #sellpi #Nigerian #tradepi #pinetworkcoins #sellmypi
BYD SWOT Analysis and In-Depth Insights 2024.pptxmikemetalprod
Indepth analysis of the BYD 2024
BYD (Build Your Dreams) is a Chinese automaker and battery manufacturer that has snowballed over the past two decades to become a significant player in electric vehicles and global clean energy technology.
This SWOT analysis examines BYD's strengths, weaknesses, opportunities, and threats as it competes in the fast-changing automotive and energy storage industries.
Founded in 1995 and headquartered in Shenzhen, BYD started as a battery company before expanding into automobiles in the early 2000s.
Initially manufacturing gasoline-powered vehicles, BYD focused on plug-in hybrid and fully electric vehicles, leveraging its expertise in battery technology.
Today, BYD is the world’s largest electric vehicle manufacturer, delivering over 1.2 million electric cars globally. The company also produces electric buses, trucks, forklifts, and rail transit.
On the energy side, BYD is a major supplier of rechargeable batteries for cell phones, laptops, electric vehicles, and energy storage systems.
Abhay Bhutada Leads Poonawalla Fincorp To Record Low NPA And Unprecedented Gr...Vighnesh Shashtri
Under the leadership of Abhay Bhutada, Poonawalla Fincorp has achieved record-low Non-Performing Assets (NPA) and witnessed unprecedented growth. Bhutada's strategic vision and effective management have significantly enhanced the company's financial health, showcasing a robust performance in the financial sector. This achievement underscores the company's resilience and ability to thrive in a competitive market, setting a new benchmark for operational excellence in the industry.
when will pi network coin be available on crypto exchange.DOT TECH
There is no set date for when Pi coins will enter the market.
However, the developers are working hard to get them released as soon as possible.
Once they are available, users will be able to exchange other cryptocurrencies for Pi coins on designated exchanges.
But for now the only way to sell your pi coins is through verified pi vendor.
Here is the what'sapp contact of my personal pi vendor
+12349014282
Turin Startup Ecosystem 2024 - Ricerca sulle Startup e il Sistema dell'Innov...Quotidiano Piemontese
Turin Startup Ecosystem 2024
Una ricerca de il Club degli Investitori, in collaborazione con ToTeM Torino Tech Map e con il supporto della ESCP Business School e di Growth Capital
Turin Startup Ecosystem 2024 - Ricerca sulle Startup e il Sistema dell'Innov...
Sharpe & Sortino Ratios
1.
2. How do you select
funds?
The most simple approach would be peformance i.e. returns,
right?!
But is it sufficient to track only returns?
3. There is something more…
The reliability of the scheme too is a critical aspect. Reliability is nothing but
volatility.
A scheme giving good returns but is extremely volatile or unreliable may not find
favor with a larger number of investors.
This calls for a measure of performance which takes into account both returns as
well as volatility / reliability.
4. Understanding Sharpe & Sortino Ratios
Sharpe Ratio expresses the relationship between performance of a scheme and its
volatility.
A higher ratio signifies a relatively less risky scheme.
Mathematically is can be expressed as:
Sharpe ratio = Average returns / Volatility (Std. Deviation)
5. What does it mean?
Thus if the performance is average while the volatility is very low, the ratio
becomes large.
If one were to look at cricket for an example, a player like Rahul Dravid will have a
decent average (let’s say 40) and a low volatility (lets say 0.5). Hence his Sharpe
Ratio would be 40/0.5 =80.
6. On the other hand…
Virendra Sehwag could have a slightly higher average than Dravid (let’s say 45) but
his volatility, as we all know, is quite high.
Either he makes big hundreds or gets out for a very low score. Let’s presume his
volatility is 0.75. His Sharpe ratio will then be 45/.75 = 60 (which is lower than the
Sharpe Ratio of Dravid).
7. So what does this suggest?
Despite a higher average, Sehwag’s Sharpe ratio is lower than that of Dravid.
This indicates that simply looking at performance from the average point of view is not
enough to judge a player.
One needs to take a look at different dimensions as well.
8. Hence…
It may be wiser to pick up Dravid for the longer version of the game, say Test
Matches and Sehwag might be a better pick for the shortest version of the game,
say T-20.
Also, the ratio will become large if either the numerator increases or the
denominator decreases.
9. The Sharpe Ratio of Tata
Infrastructure Fund is 0.0899 for
the period of three years from
1st June, ’06 to 31st May, ’09,
wherein Risk Free Rate is
assumed at 6%.
10. So what is the
Sortino Ratio?
The Sortino ratio is similar to the Sharpe ratio, except while Sharpe ratio uses
Standard Deviation in the denominator, Sortino ratio uses downside deviation.
It is important to note that while standard deviation does not discriminate between
upward and downward volatility, downward deviation does so.
11. Thus…
Standard deviation can be high in the case of excessive upward movement of price
and it may result into a lower Sharpe Ratio.
Sharpe ratio will be low because the high standard deviation is the denominator.
Now we may believe that the scheme is unsuitable and therefore misrepresent the
real picture (since upward movement is desirable from an investor’s perspective!).
12. Hence it was necessary to find another ratio which differentiates harmful volatility
from volatility in general by replacing standard deviation with downside deviation in
the denominator.
Thus, the Sortino Ratio was calculated by subtracting the risk free rate from the
return of the portfolio and then dividing it by the downside deviation.
13. Conceptually speaking…
Sortino Ratio = Performance/ Downside deviation. The Sortino ratio measures
the return to ‘bad’ volatility.
This ratio allows investors to assess risk in a better manner than simply looking at
excess returns to total volatility.
A large Sortino Ratio indicates a low risk of large losses occurring.
14. To give an example, assume investment A has a return of +10% in year one
and -10% in year two. Investment B has a 0% return in year one and a 20%
return in year two.
The total variance in these investments is the same, i.e. 20%. However,
investment B is obviously more favorable. Why??
As the Sharpe ratio measures risk using standard deviation only, it does not
differentiate between positive and negative volatility.
15. The Sortino ratio, on the other hand,
measures performance against the
downward deviation… so it is able to spot
the negative volatility associated with
investment A immediately and help us
classify investment B as a more favorable
investment!
16. The Sortino Ratio of Tata Infrastructure
Fund is 12.796 for the period of three
years from 1st June, ’06 to 31st May, ’09,
wherein Risk Free Rate is assumed at 6%.
17. To Sum Up
Sharpe Ratio: Sharpe Ratio expresses the relationship between performance of a
scheme and its volatility. A higher ratio signifies a relatively less risky scheme.
Sortino Ratio: The Sortino Ratio is calculated by subtracting the risk free rate from
the return of the portfolio and then dividing it by the downside deviation.