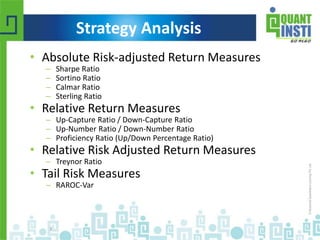
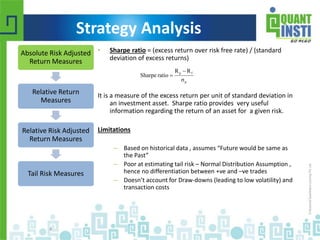
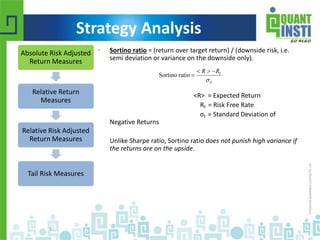
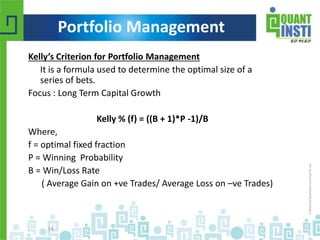
Webinar on 
Performance Evaluation & 
Money Management 
Shaurya Chandra 
© Copyright 2010-2014 QuantInsti Quantitative Learning Private Limited
Building a Diversified Portfolio? 
© Copyright 2010-2014 QuantInsti Quantitative Learning Private Limited
• Absolute Risk-adjusted Return Measures 
– Sharpe Ratio 
– Sortino Ratio 
– Calmar Ratio 
– Sterling Ratio 
• Relative Return Measures 
– Up-Capture Ratio / Down-Capture Ratio 
– Up-Number Ratio / Down-Number Ratio 
– Proficiency Ratio (Up/Down Percentage Ratio) 
• Relative Risk Adjusted Return Measures 
– Treynor Ratio 
• Tail Risk Measures 
– RAROC-Var 
© Copyright 2010-2014 QuantInsti Quantitative Learning Private Limited 
3 
Strategy Analysis
Strategy Analysis 
• Sharpe ratio = (excess return over risk free rate) / (standard 
deviation of excess returns) 
R R 
p f 
σ 
It is a measure of the excess return per unit of standard deviation in 
an investment asset. Sharpe ratio provides very useful 
information regarding the return of an asset for a given risk. 
Limitations 
– Based on historical data , assumes “Future would be same as 
the Past” 
– Poor at estimating tail risk – Normal Distribution Assumption , 
hence no differentiation between +ve and –ve trades 
– Doesn’t account for Draw-downs (leading to low volatility) and 
transaction costs 
© Copyright 2010-2014 QuantInsti Quantitative Learning Private Limited 
4 
p 
Sharpe ratio 
 
 
Absolute Risk Adjusted 
Return Measures 
Relative Return 
Measures 
Relative Risk Adjusted 
Return Measures 
Tail Risk Measures
Strategy Analysis 
• Sortino ratio = (return over target return) / (downside risk, i.e. 
semi deviation or variance on the downside only). 
 R  R 
 
Sortino ratio f 
 
<R> = Expected Return 
Rf = Risk Free Rate 
σf = Standard Deviation of 
Negative Returns 
Unlike Sharpe ratio, Sortino ratio does not punish high variance if 
the returns are on the upside. 
© Copyright 2010-2014 QuantInsti Quantitative Learning Private Limited 
5 
d 
Absolute Risk Adjusted 
Return Measures 
Relative Return 
Measures 
Relative Risk Adjusted 
Return Measures 
Tail Risk Measures
The Flaw of Averages 
© Copyright 2010-2014 QuantInsti Quantitative Learning Private Limited
• Calmar ratio = (return) / (maximum drawdown). Generally 
quoted for the last 3 years 
• Sterling ratio = (return) / (absolute(average drawdown – 10%)). 
Generally quoted for the last 3 years 
Absolute Risk Adjusted 
Return Measures 
Relative Return 
Measures 
Relative Risk Adjusted 
Return Measures 
Tail Risk Measures 
© Copyright 2010-2014 QuantInsti Quantitative Learning Private Limited 
7 
Strategy Analysis
• Up Capture Ratio = (fund’s return when benchmark return 
increased) / (benchmark’s return when benchmark increased) 
• Up Number Ratio = (number of period when fund’s return 
increased when benchmark return increased) / (number of 
periods when benchmark’s return increased) 
• Up Percentage Ratio (Proficiency Ratio) = (number of period 
when fund’s return outperformed the benchmark when 
benchmark’s return increased) / (number of periods when 
benchmark’s return increased) 
• Likewise Down Capture Ratio, Down Number Ratio, Down 
Percentage Ratio 
Absolute Risk Adjusted 
Return Measures 
Relative Return 
Measures 
Relative Risk Adjusted 
Return Measures 
Tail Risk Measures 
© Copyright 2010-2014 QuantInsti Quantitative Learning Private Limited 
8 
Strategy Analysis
Strategy Analysis 
• Treynor ratio = (excess return over risk free rate)/ beta of 
portfolio 
r  
R 
i f ri = Average Return of the Portfolio 
Rf = Average Return of the Risk-Free Rate 
β = Beta of the Portfolio 
It is a measure of returns earned in excess of that which could 
have been earned on a riskless investment per unit of market risk 
where β is a measure of market risk. The only difference 
between Sharpe Ratio and Treynor Ratio is that the later uses β 
as the measurement of ‘Volatility’. 
Absolute Risk Adjusted 
Return Measures 
Relative Return 
Measures 
Relative Risk Adjusted 
Return Measures 
Tail Risk Measures 
© Copyright 2010-2014 QuantInsti Quantitative Learning Private Limited 
9 
i 
Treynor ratio 
 

Strategy Analysis 
• RAROC (Risk Adjusted Return on Capital) = (expected return) / 
(Value at Risk) 
RE = Expected Return 
VaR = Value at Risk 
R 
AROC E R  
In any investment, risk is traded off against benefit. RAROC gives 
us a picture of the returns on several different investments with 
varying risk levels. 
Absolute Risk Adjusted 
Return Measures 
Relative Return 
Measures 
Relative Risk Adjusted 
Return Measures 
Tail Risk Measures 
© Copyright 2010-2014 QuantInsti Quantitative Learning Private Limited 
10 
VaR
Trade Sizing 
• Ad hoc: trade no larger than lets you 
sleep at night 
• Margin plus drawdown 
• Fixed Fractional 
• Fixed Ratio 
• Hybrid fixed fractional/fixed ratio 
© Copyright 2010-2014 QuantInsti Quantitative Learning Private Limited
Methods that Don’t Work 
• Martingale methods: increase position size 
after a loss; decrease it after a win. 
• Anti-Martingale methods. 
• Equity curve methods: increase size when 
your equity curve falls below its moving 
average (“reversion to mean”), or increase 
size when you cross above the moving 
average (“trade the trend in equity curve”). 
© Copyright 2010-2014 QuantInsti Quantitative Learning Private Limited
Why They Don’t Work 
• Martingale and equity curve methods assume 
dependency between trades. 
• In most cases, trades are independent of each 
other. The odds of the next trade being a win are 
not related to whether the last trade was a win or 
a loss. 
• If trades are independent, you can’t determine 
the likelihood of the next trade being a win or a 
loss based on the previous trade. 
© Copyright 2010-2014 QuantInsti Quantitative Learning Private Limited
Kelly’s Criterion for Portfolio Management 
It is a formula used to determine the optimal size of a 
series of bets. 
Focus : Long Term Capital Growth 
Kelly % (f) = ((B + 1)*P -1)/B 
Where, 
f = optimal fixed fraction 
P = Winning Probability 
B = Win/Loss Rate 
( Average Gain on +ve Trades/ Average Loss on –ve Trades) 
© Copyright 2010-2014 QuantInsti Quantitative Learning Private Limited 
14 
Portfolio Management
Some Advice! 
© Copyright 2010-2014 QuantInsti Quantitative Learning Private Limited
Thanks! 
THANK YOU 
Contact us at: 
Email: contact@quantinsti.com 
Phone: +91-22-61691400, +91-9920448877 
© Copyright 2010-2014 QuantInsti Quantitative Learning Private Limited

Performance evaluation & portfolio management

  • 1.
    Webinar on PerformanceEvaluation & Money Management Shaurya Chandra © Copyright 2010-2014 QuantInsti Quantitative Learning Private Limited
  • 2.
    Building a DiversifiedPortfolio? © Copyright 2010-2014 QuantInsti Quantitative Learning Private Limited
  • 3.
    • Absolute Risk-adjustedReturn Measures – Sharpe Ratio – Sortino Ratio – Calmar Ratio – Sterling Ratio • Relative Return Measures – Up-Capture Ratio / Down-Capture Ratio – Up-Number Ratio / Down-Number Ratio – Proficiency Ratio (Up/Down Percentage Ratio) • Relative Risk Adjusted Return Measures – Treynor Ratio • Tail Risk Measures – RAROC-Var © Copyright 2010-2014 QuantInsti Quantitative Learning Private Limited 3 Strategy Analysis
  • 4.
    Strategy Analysis •Sharpe ratio = (excess return over risk free rate) / (standard deviation of excess returns) R R p f σ It is a measure of the excess return per unit of standard deviation in an investment asset. Sharpe ratio provides very useful information regarding the return of an asset for a given risk. Limitations – Based on historical data , assumes “Future would be same as the Past” – Poor at estimating tail risk – Normal Distribution Assumption , hence no differentiation between +ve and –ve trades – Doesn’t account for Draw-downs (leading to low volatility) and transaction costs © Copyright 2010-2014 QuantInsti Quantitative Learning Private Limited 4 p Sharpe ratio   Absolute Risk Adjusted Return Measures Relative Return Measures Relative Risk Adjusted Return Measures Tail Risk Measures
  • 5.
    Strategy Analysis •Sortino ratio = (return over target return) / (downside risk, i.e. semi deviation or variance on the downside only).  R  R  Sortino ratio f  <R> = Expected Return Rf = Risk Free Rate σf = Standard Deviation of Negative Returns Unlike Sharpe ratio, Sortino ratio does not punish high variance if the returns are on the upside. © Copyright 2010-2014 QuantInsti Quantitative Learning Private Limited 5 d Absolute Risk Adjusted Return Measures Relative Return Measures Relative Risk Adjusted Return Measures Tail Risk Measures
  • 6.
    The Flaw ofAverages © Copyright 2010-2014 QuantInsti Quantitative Learning Private Limited
  • 7.
    • Calmar ratio= (return) / (maximum drawdown). Generally quoted for the last 3 years • Sterling ratio = (return) / (absolute(average drawdown – 10%)). Generally quoted for the last 3 years Absolute Risk Adjusted Return Measures Relative Return Measures Relative Risk Adjusted Return Measures Tail Risk Measures © Copyright 2010-2014 QuantInsti Quantitative Learning Private Limited 7 Strategy Analysis
  • 8.
    • Up CaptureRatio = (fund’s return when benchmark return increased) / (benchmark’s return when benchmark increased) • Up Number Ratio = (number of period when fund’s return increased when benchmark return increased) / (number of periods when benchmark’s return increased) • Up Percentage Ratio (Proficiency Ratio) = (number of period when fund’s return outperformed the benchmark when benchmark’s return increased) / (number of periods when benchmark’s return increased) • Likewise Down Capture Ratio, Down Number Ratio, Down Percentage Ratio Absolute Risk Adjusted Return Measures Relative Return Measures Relative Risk Adjusted Return Measures Tail Risk Measures © Copyright 2010-2014 QuantInsti Quantitative Learning Private Limited 8 Strategy Analysis
  • 9.
    Strategy Analysis •Treynor ratio = (excess return over risk free rate)/ beta of portfolio r  R i f ri = Average Return of the Portfolio Rf = Average Return of the Risk-Free Rate β = Beta of the Portfolio It is a measure of returns earned in excess of that which could have been earned on a riskless investment per unit of market risk where β is a measure of market risk. The only difference between Sharpe Ratio and Treynor Ratio is that the later uses β as the measurement of ‘Volatility’. Absolute Risk Adjusted Return Measures Relative Return Measures Relative Risk Adjusted Return Measures Tail Risk Measures © Copyright 2010-2014 QuantInsti Quantitative Learning Private Limited 9 i Treynor ratio  
  • 10.
    Strategy Analysis •RAROC (Risk Adjusted Return on Capital) = (expected return) / (Value at Risk) RE = Expected Return VaR = Value at Risk R AROC E R  In any investment, risk is traded off against benefit. RAROC gives us a picture of the returns on several different investments with varying risk levels. Absolute Risk Adjusted Return Measures Relative Return Measures Relative Risk Adjusted Return Measures Tail Risk Measures © Copyright 2010-2014 QuantInsti Quantitative Learning Private Limited 10 VaR
  • 11.
    Trade Sizing •Ad hoc: trade no larger than lets you sleep at night • Margin plus drawdown • Fixed Fractional • Fixed Ratio • Hybrid fixed fractional/fixed ratio © Copyright 2010-2014 QuantInsti Quantitative Learning Private Limited
  • 12.
    Methods that Don’tWork • Martingale methods: increase position size after a loss; decrease it after a win. • Anti-Martingale methods. • Equity curve methods: increase size when your equity curve falls below its moving average (“reversion to mean”), or increase size when you cross above the moving average (“trade the trend in equity curve”). © Copyright 2010-2014 QuantInsti Quantitative Learning Private Limited
  • 13.
    Why They Don’tWork • Martingale and equity curve methods assume dependency between trades. • In most cases, trades are independent of each other. The odds of the next trade being a win are not related to whether the last trade was a win or a loss. • If trades are independent, you can’t determine the likelihood of the next trade being a win or a loss based on the previous trade. © Copyright 2010-2014 QuantInsti Quantitative Learning Private Limited
  • 14.
    Kelly’s Criterion forPortfolio Management It is a formula used to determine the optimal size of a series of bets. Focus : Long Term Capital Growth Kelly % (f) = ((B + 1)*P -1)/B Where, f = optimal fixed fraction P = Winning Probability B = Win/Loss Rate ( Average Gain on +ve Trades/ Average Loss on –ve Trades) © Copyright 2010-2014 QuantInsti Quantitative Learning Private Limited 14 Portfolio Management
  • 15.
    Some Advice! ©Copyright 2010-2014 QuantInsti Quantitative Learning Private Limited
  • 16.
    Thanks! THANK YOU Contact us at: Email: contact@quantinsti.com Phone: +91-22-61691400, +91-9920448877 © Copyright 2010-2014 QuantInsti Quantitative Learning Private Limited