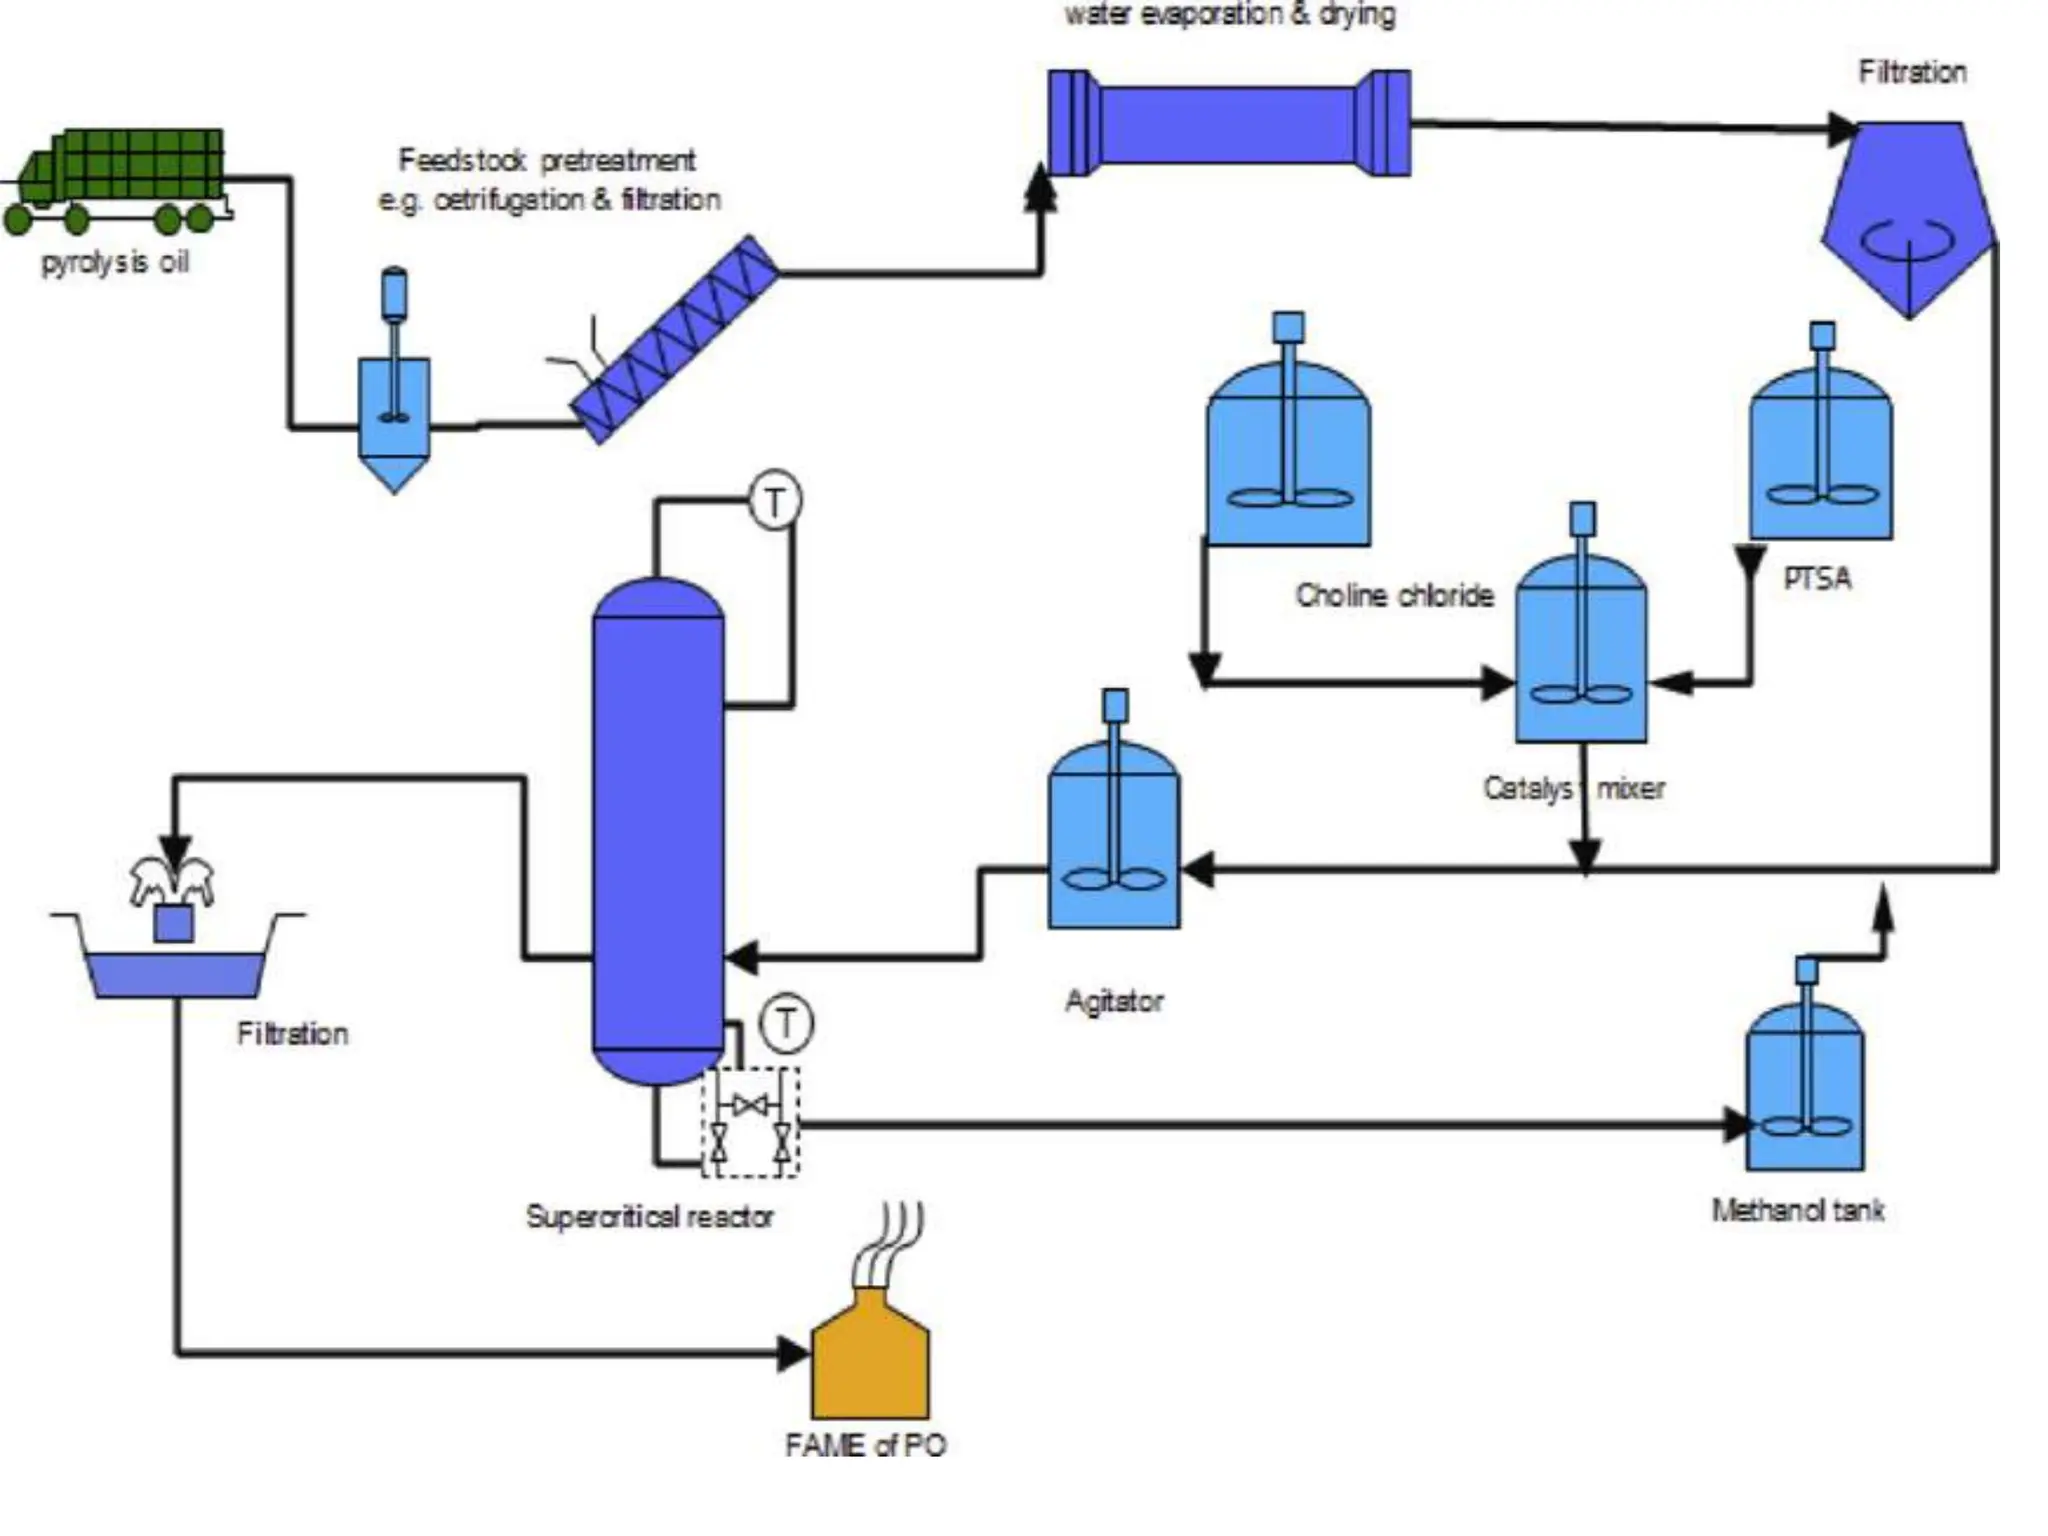
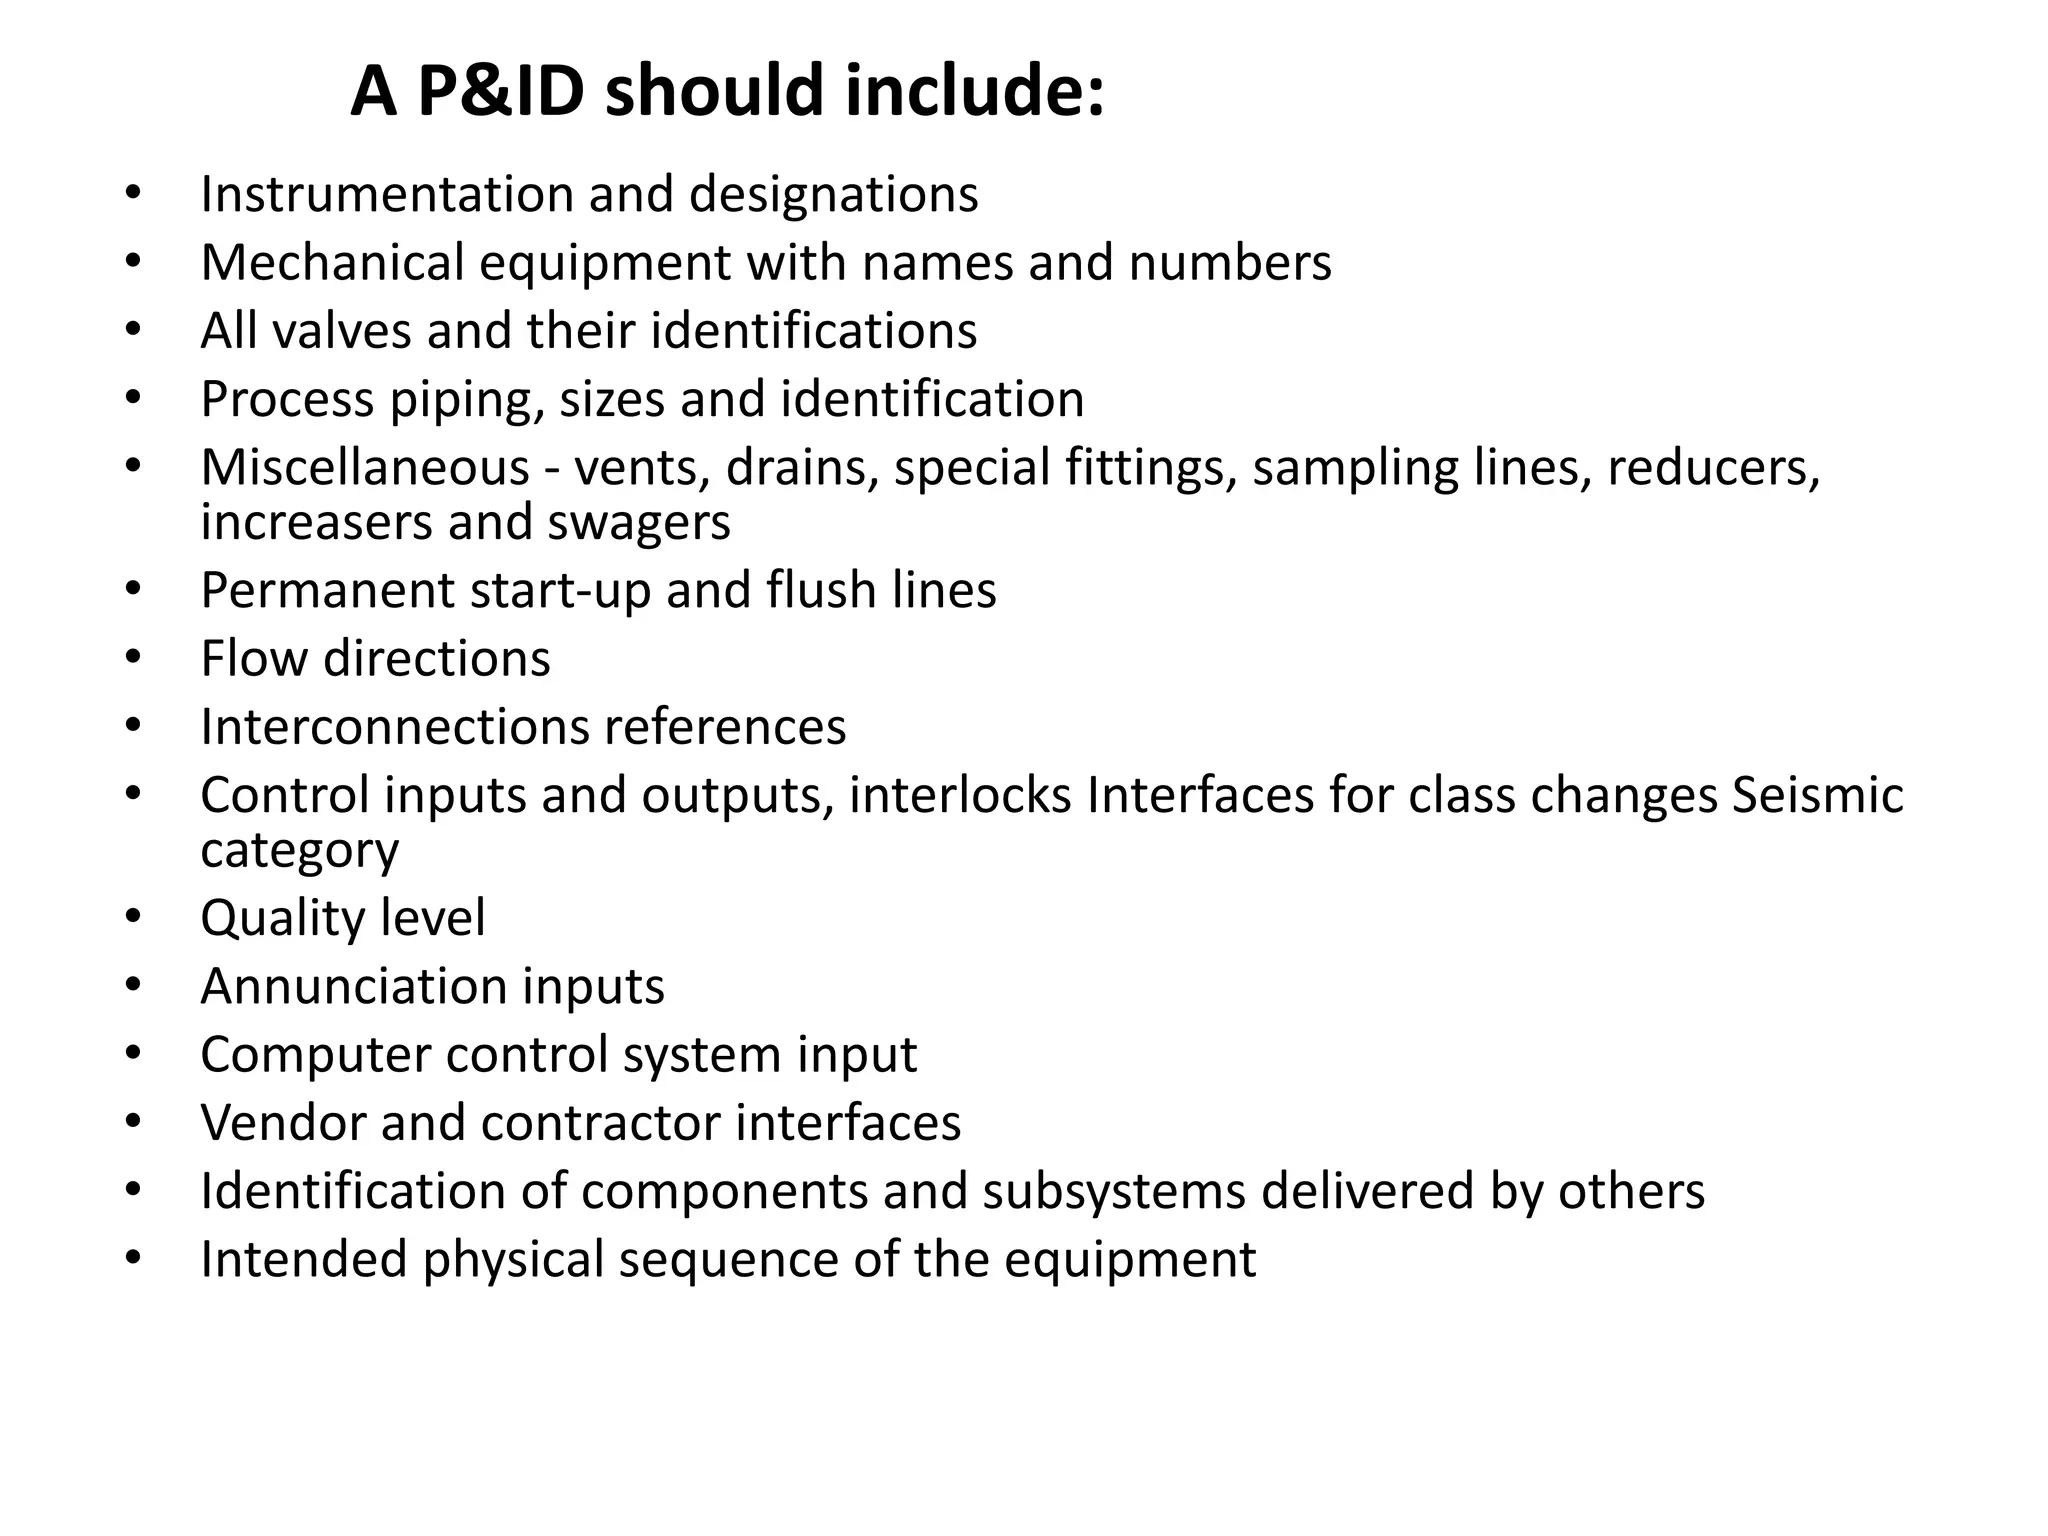
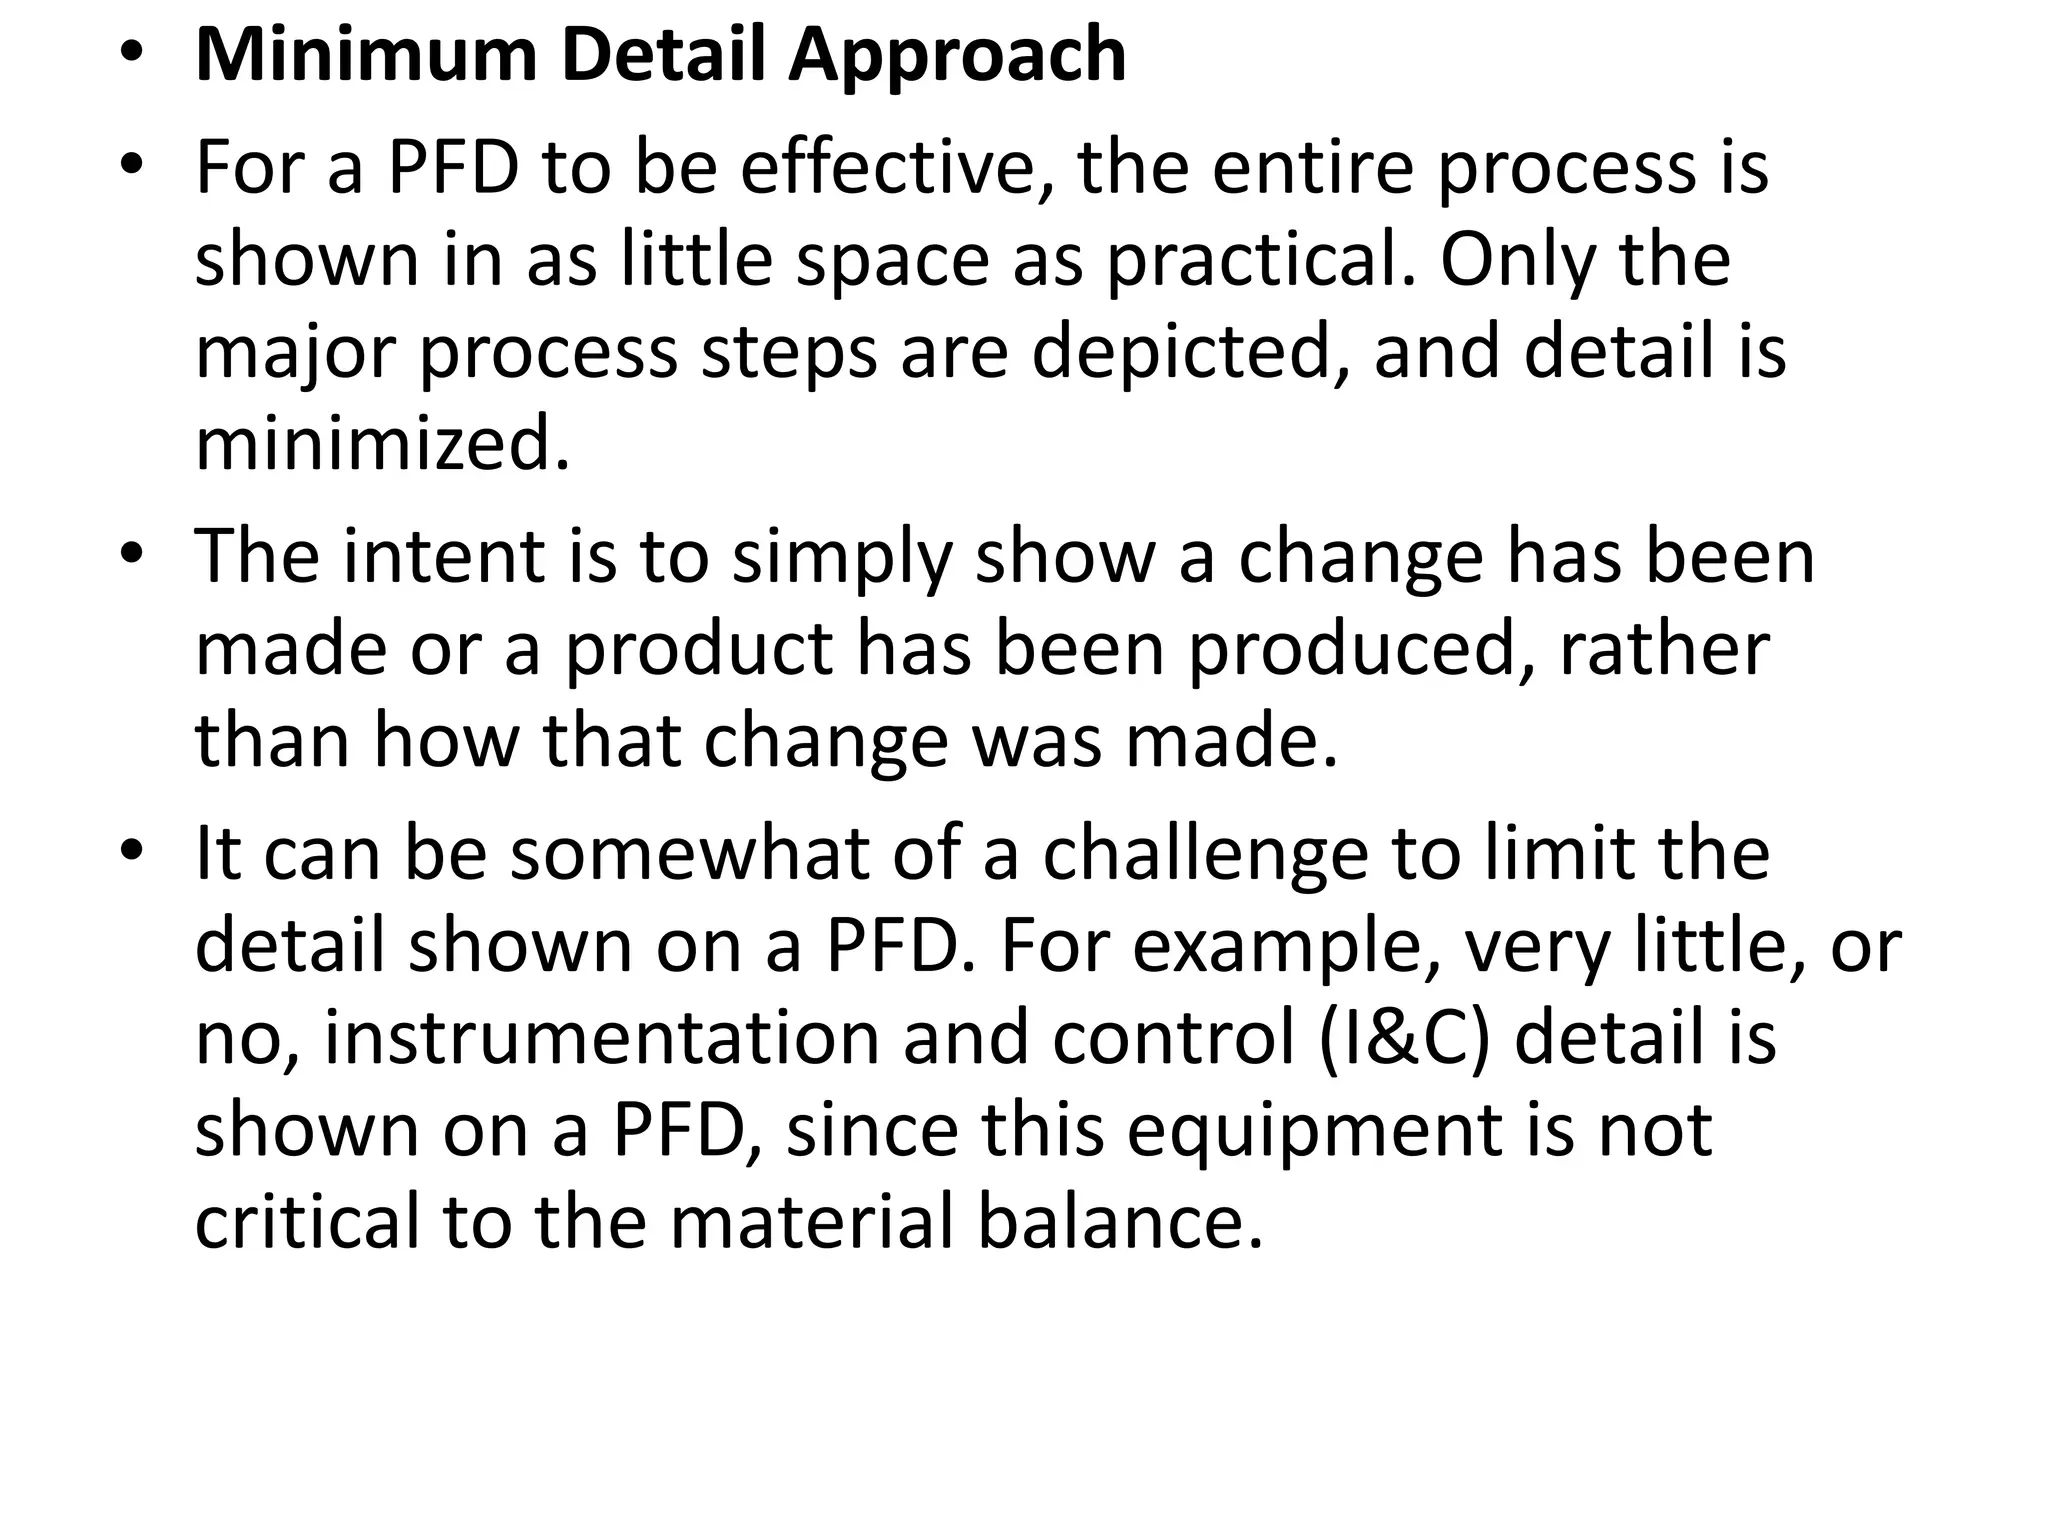
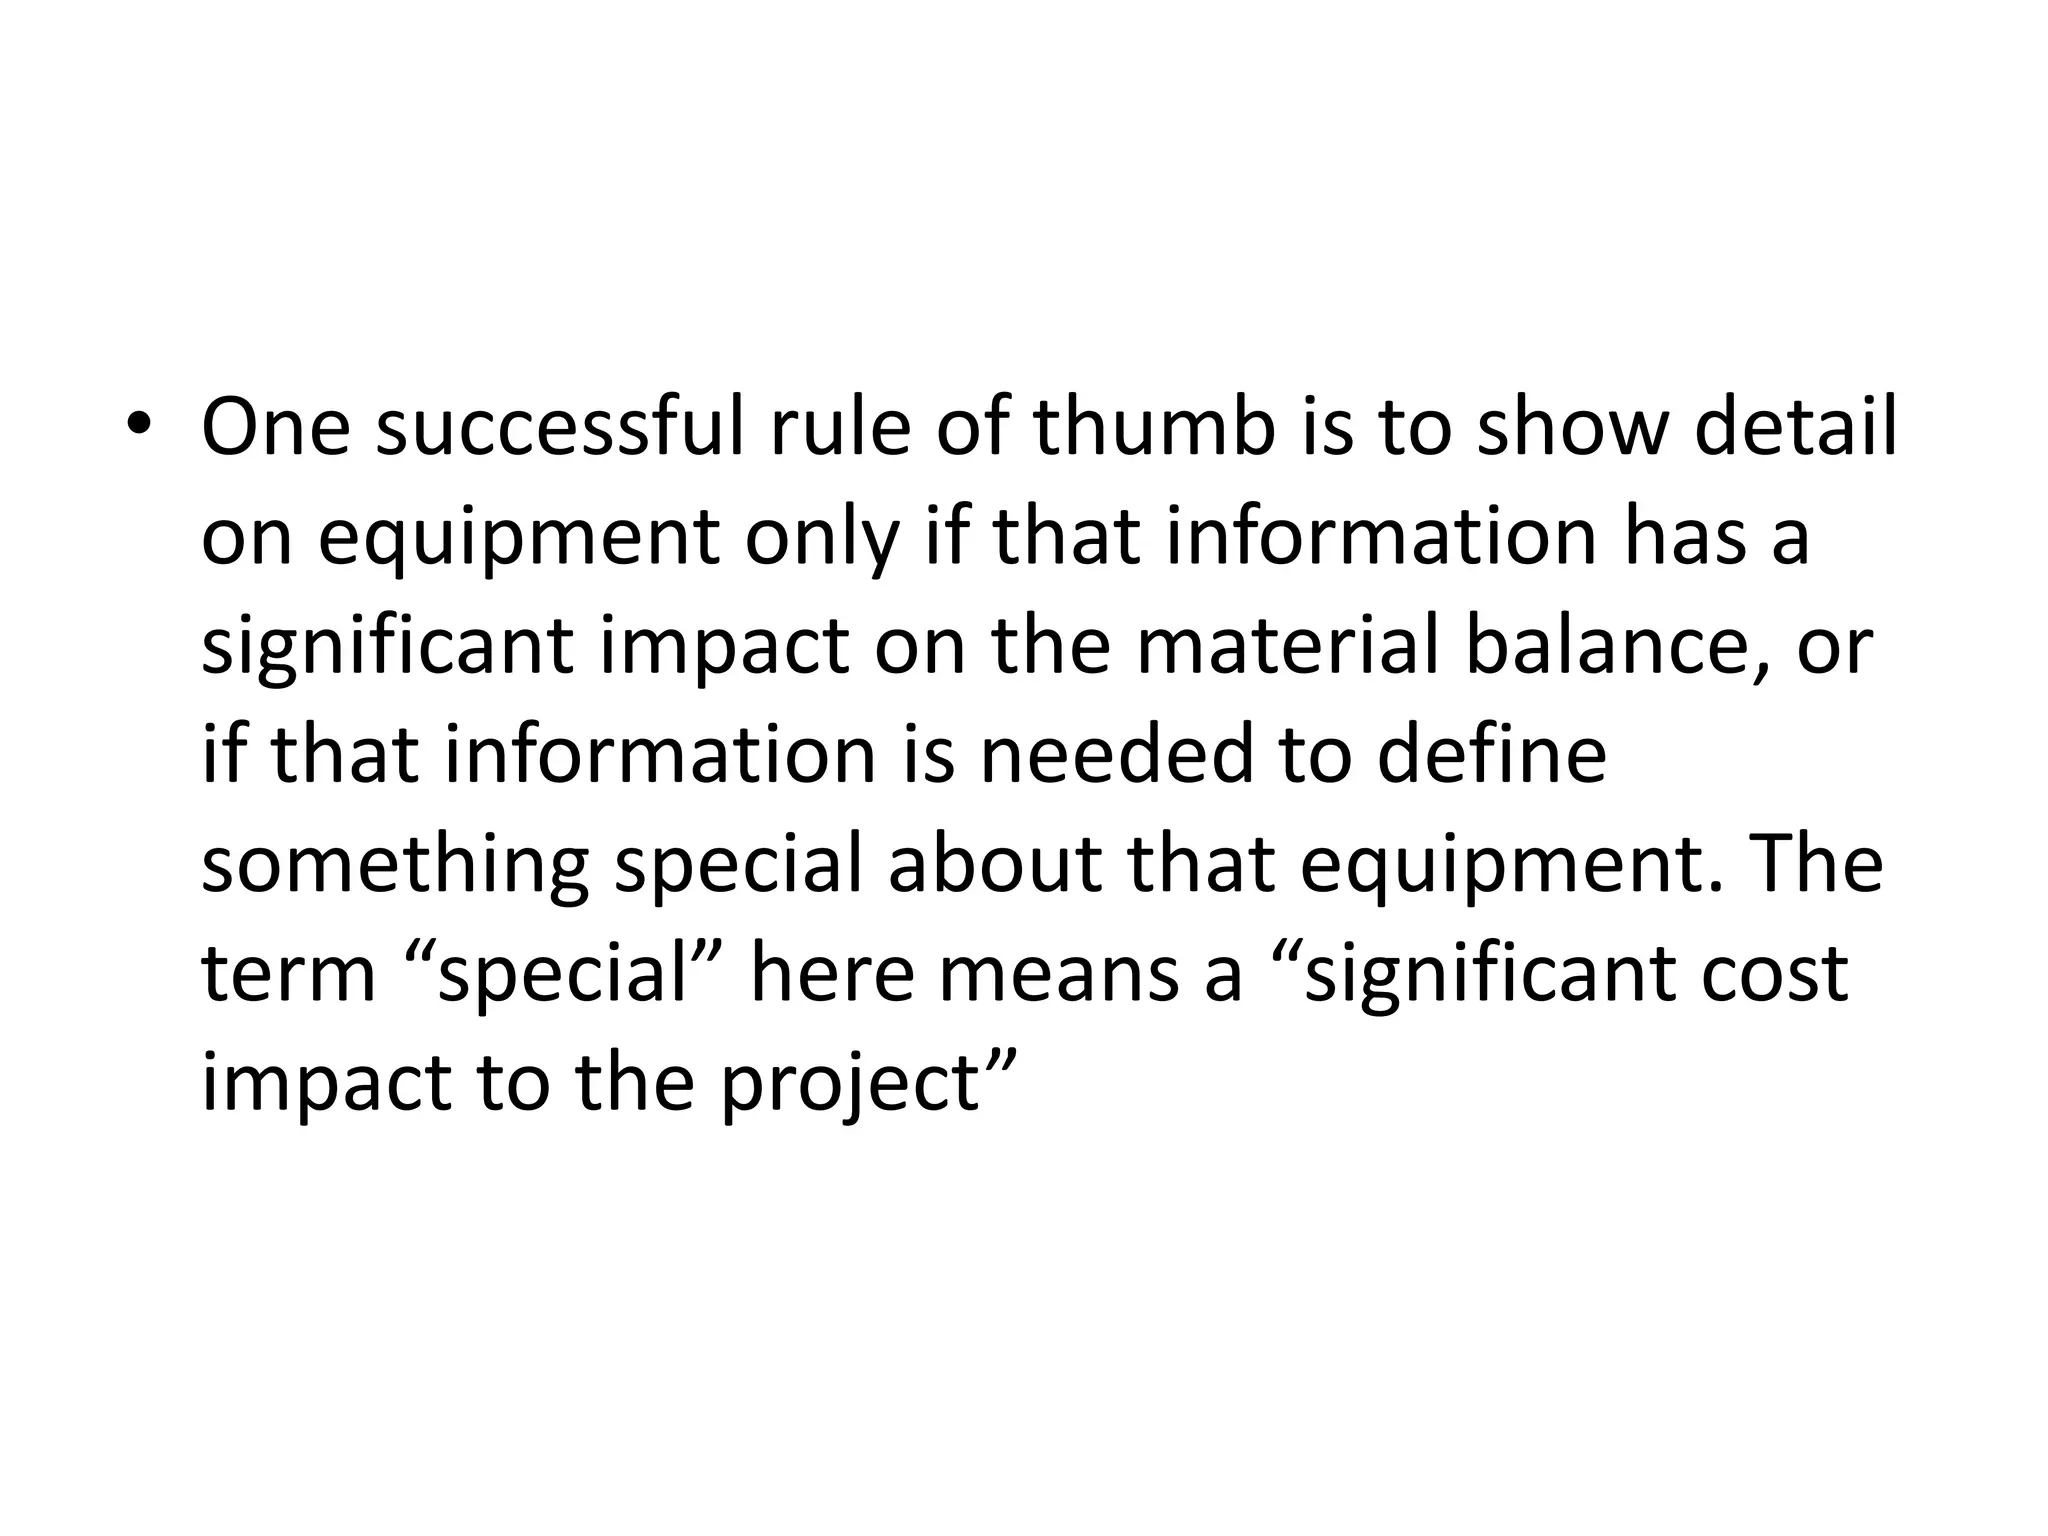
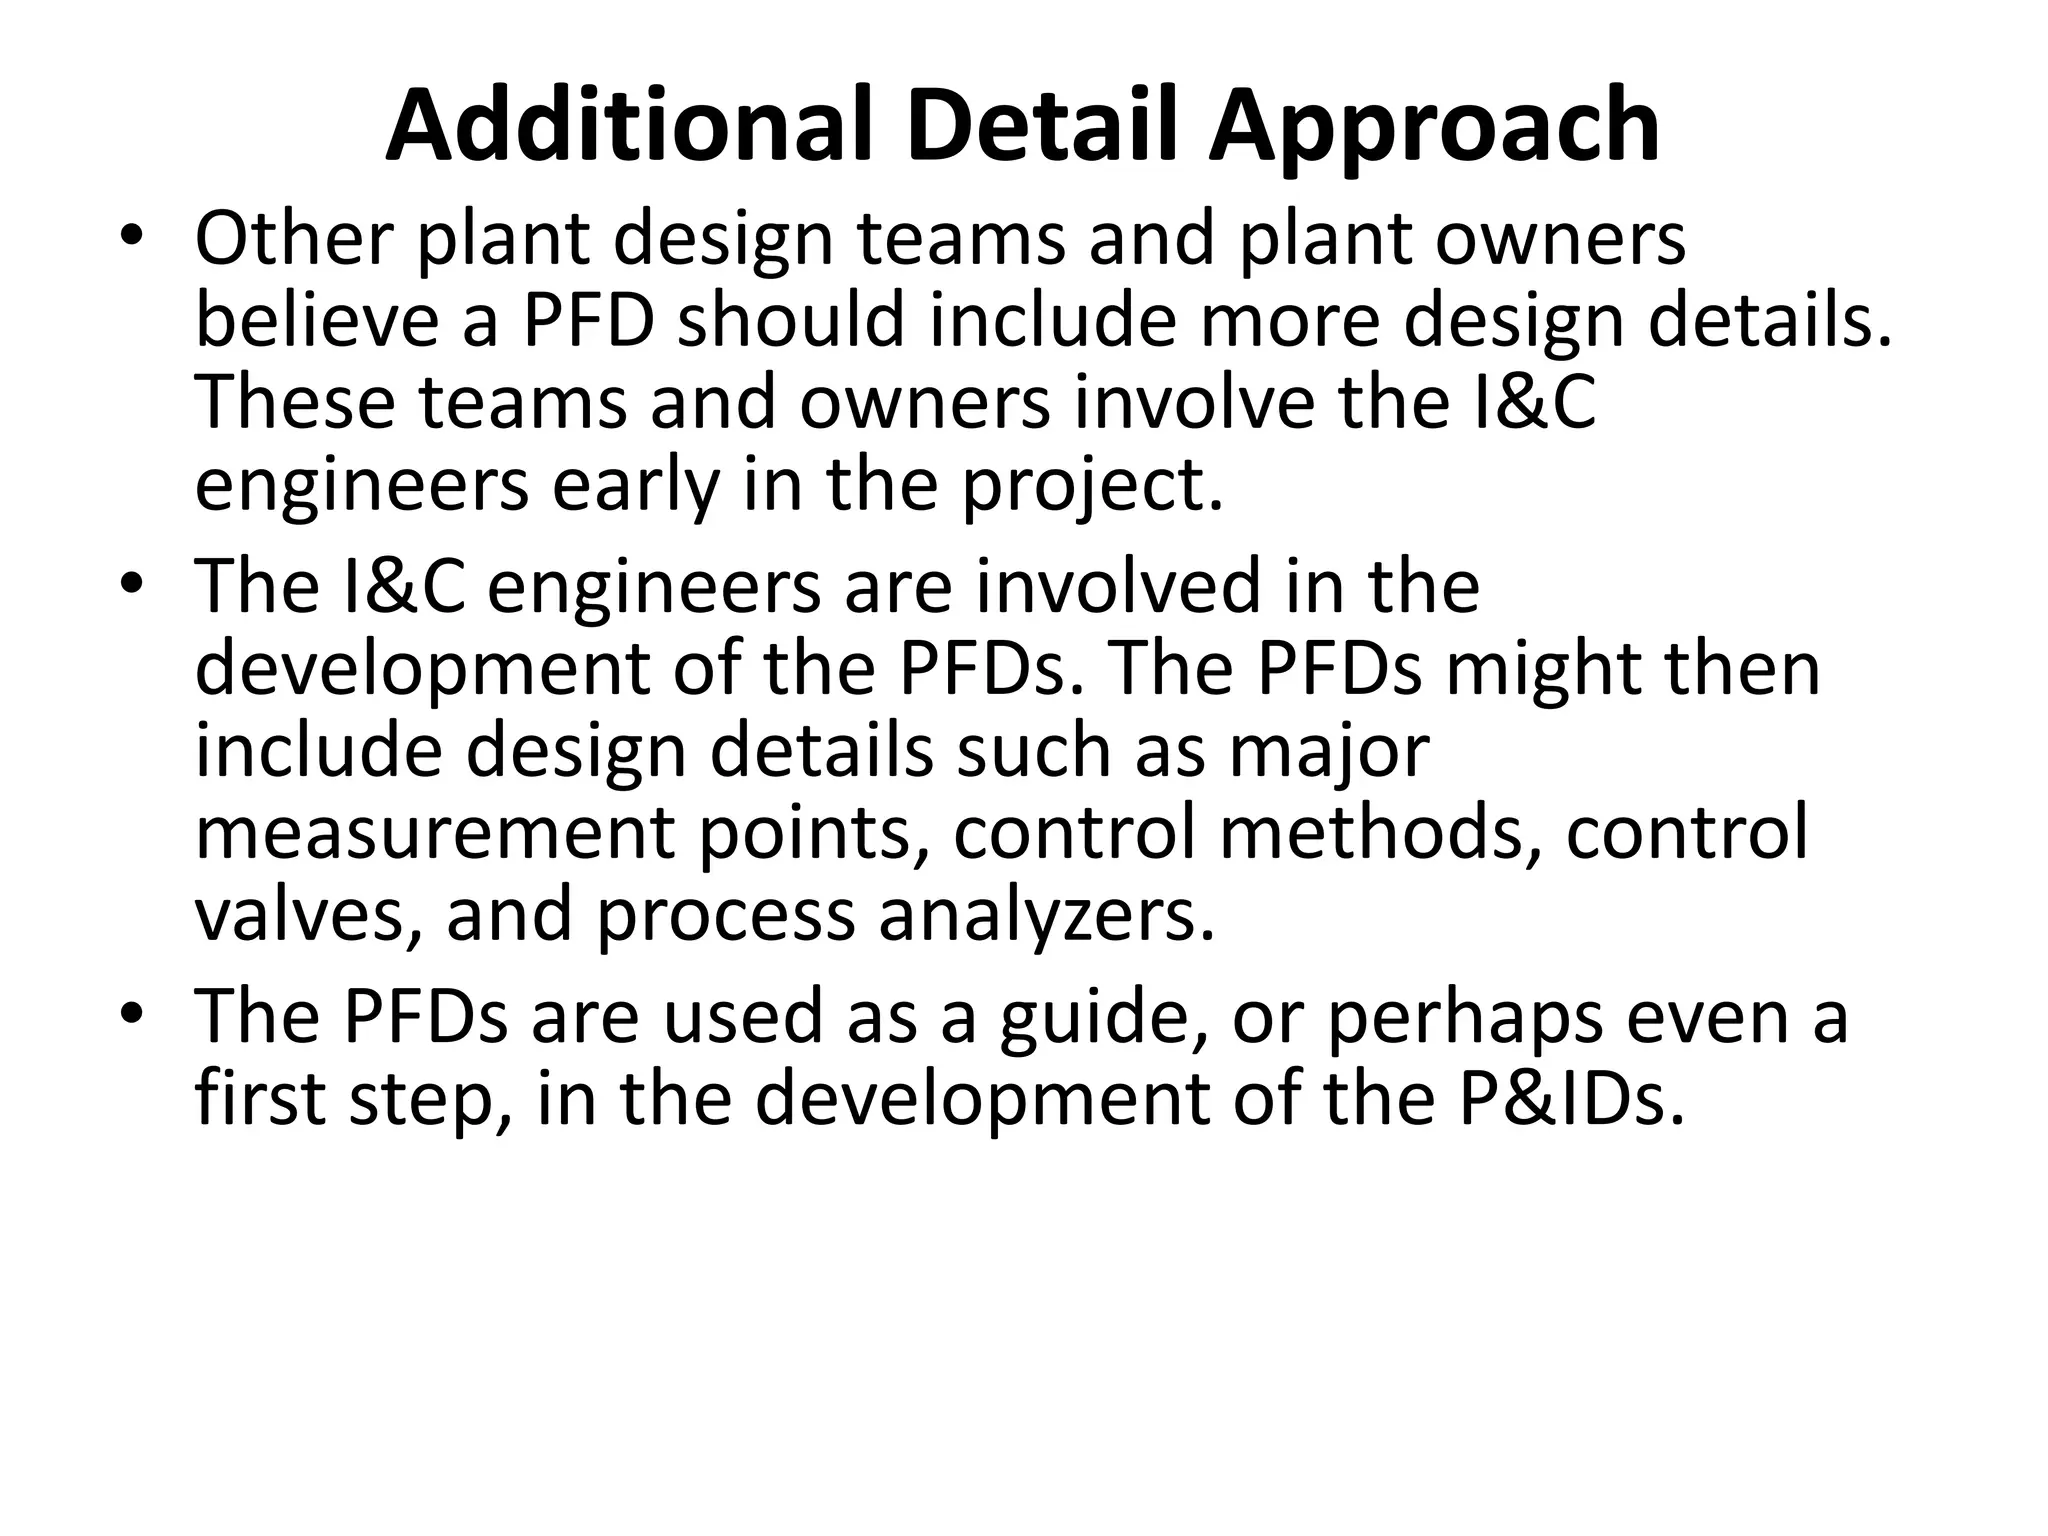
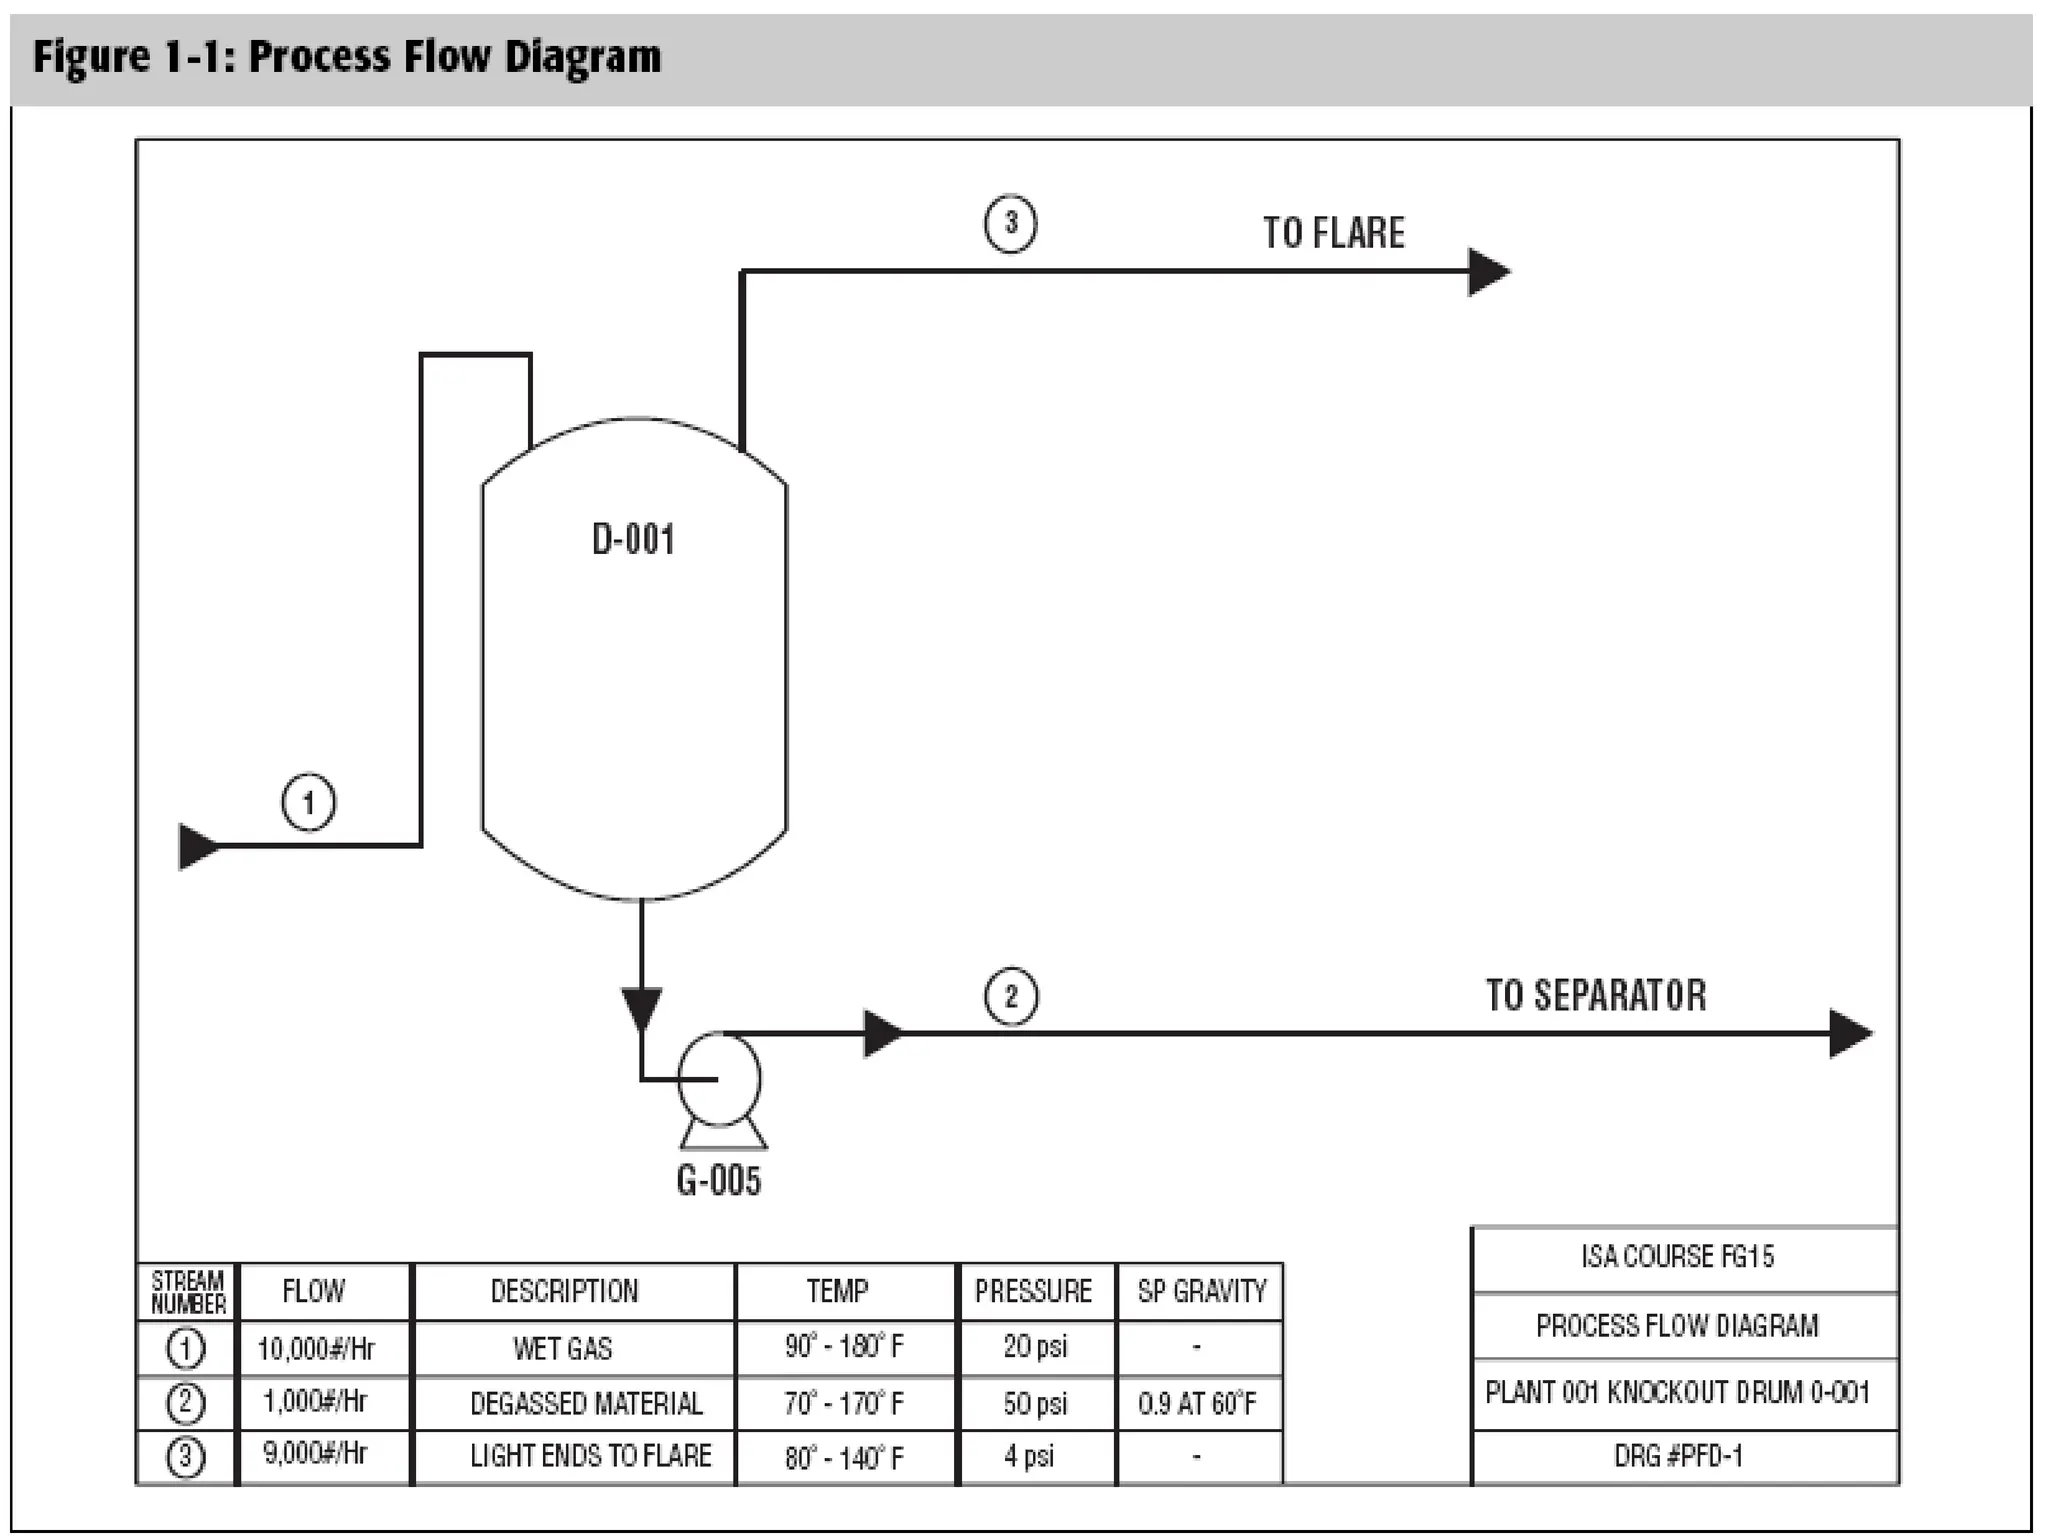
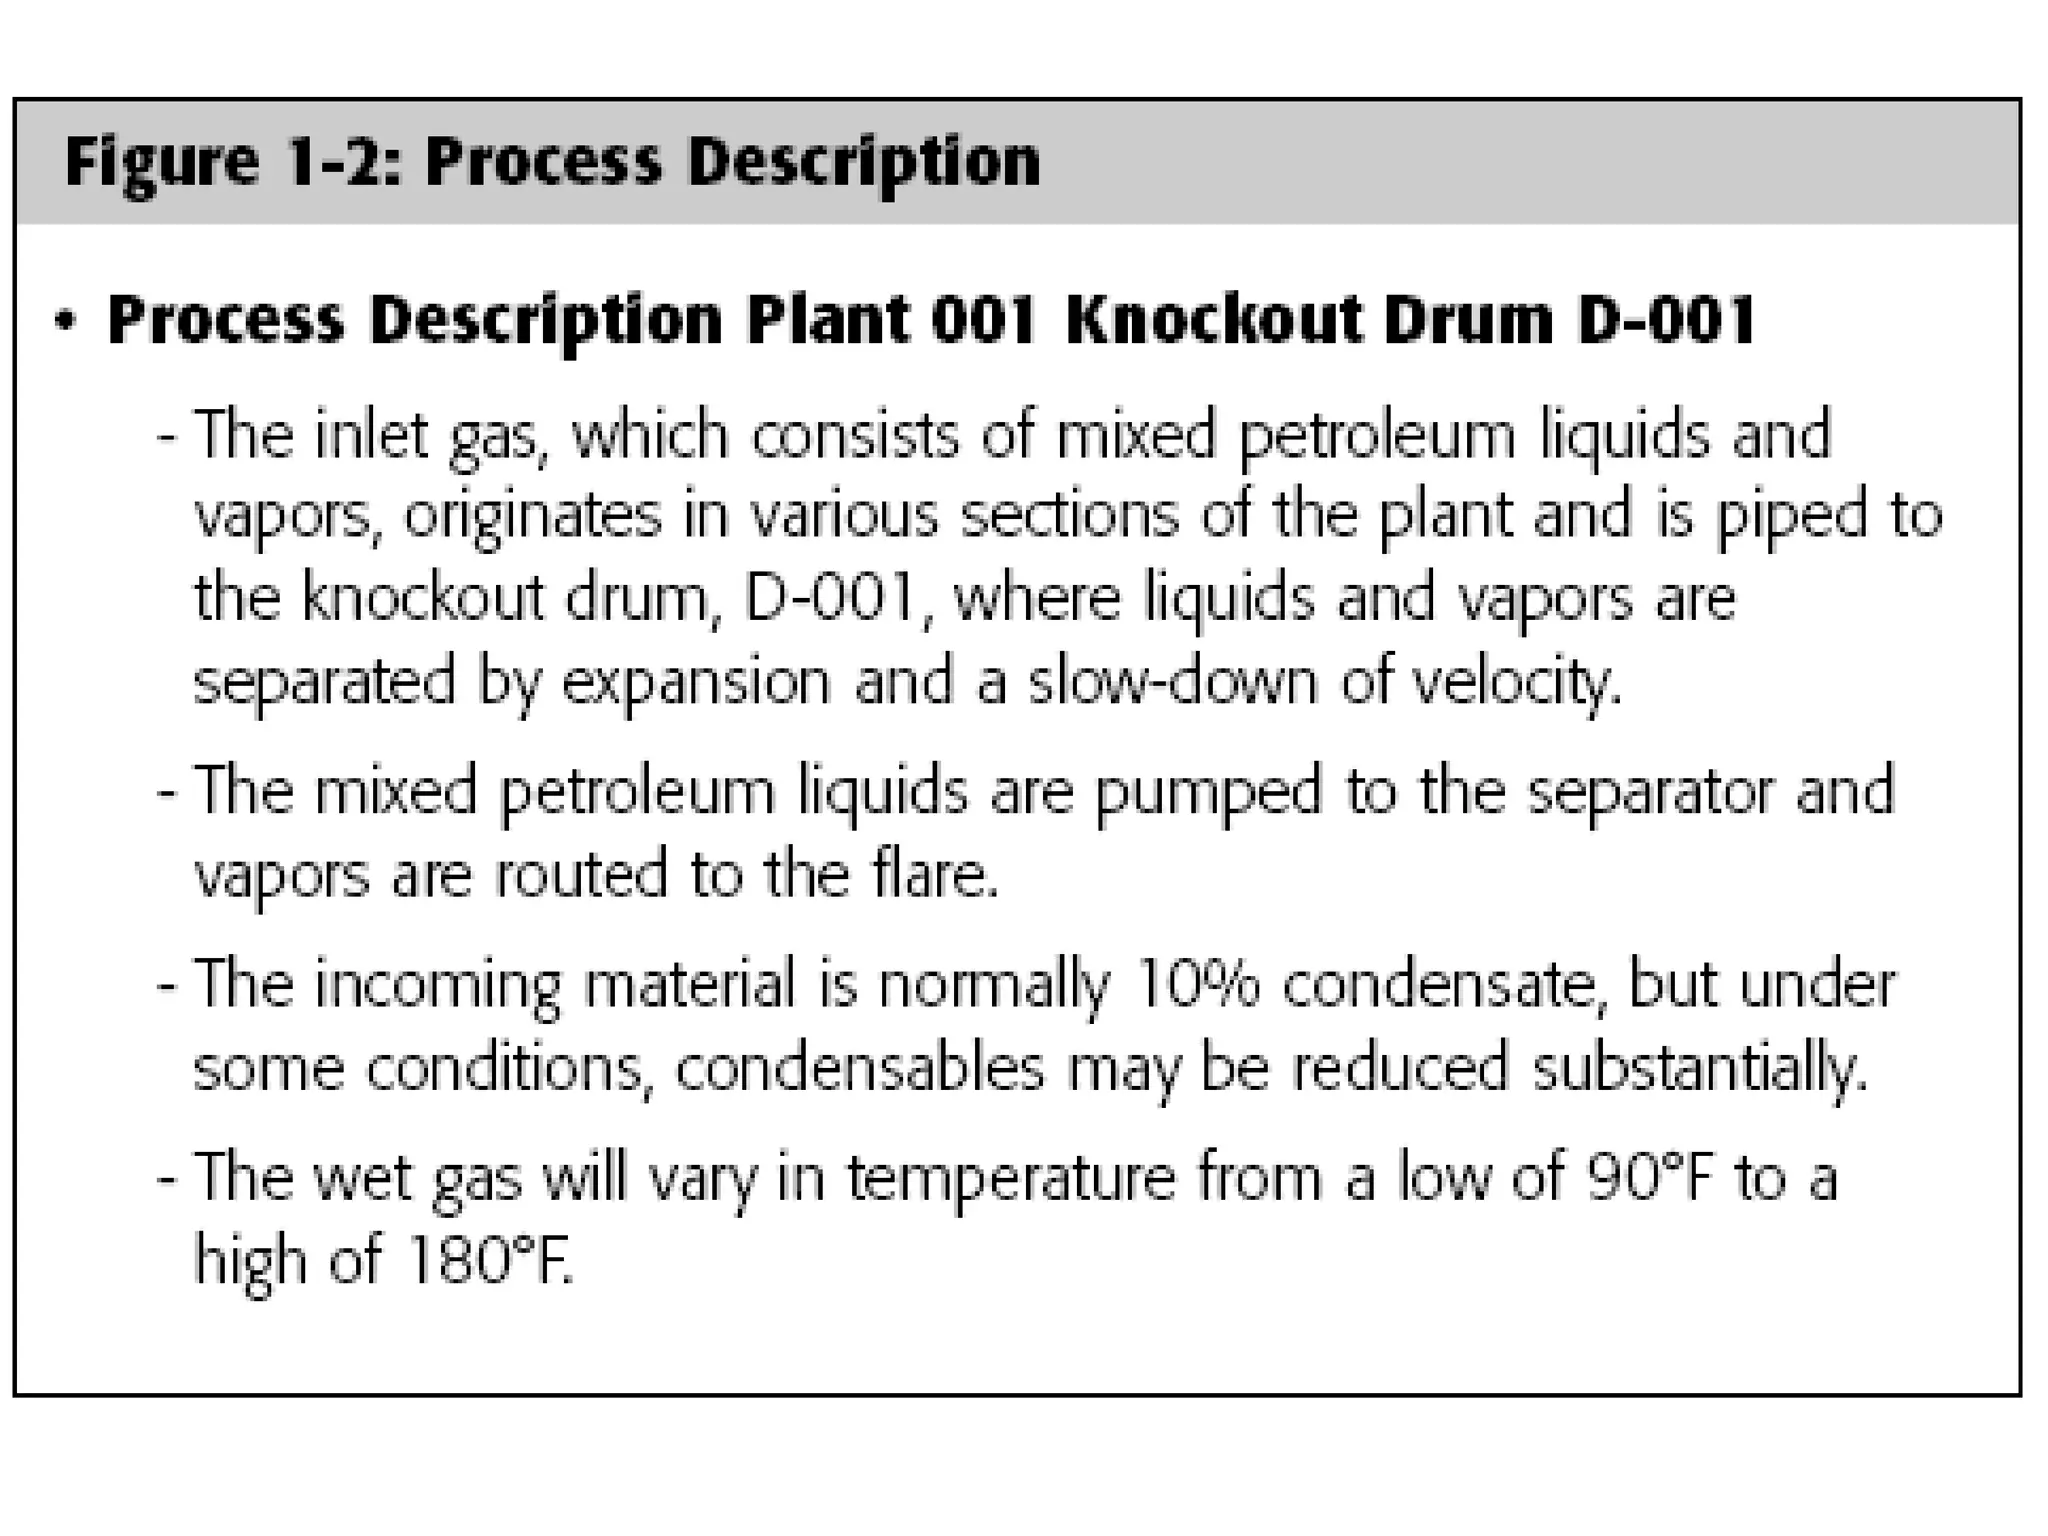
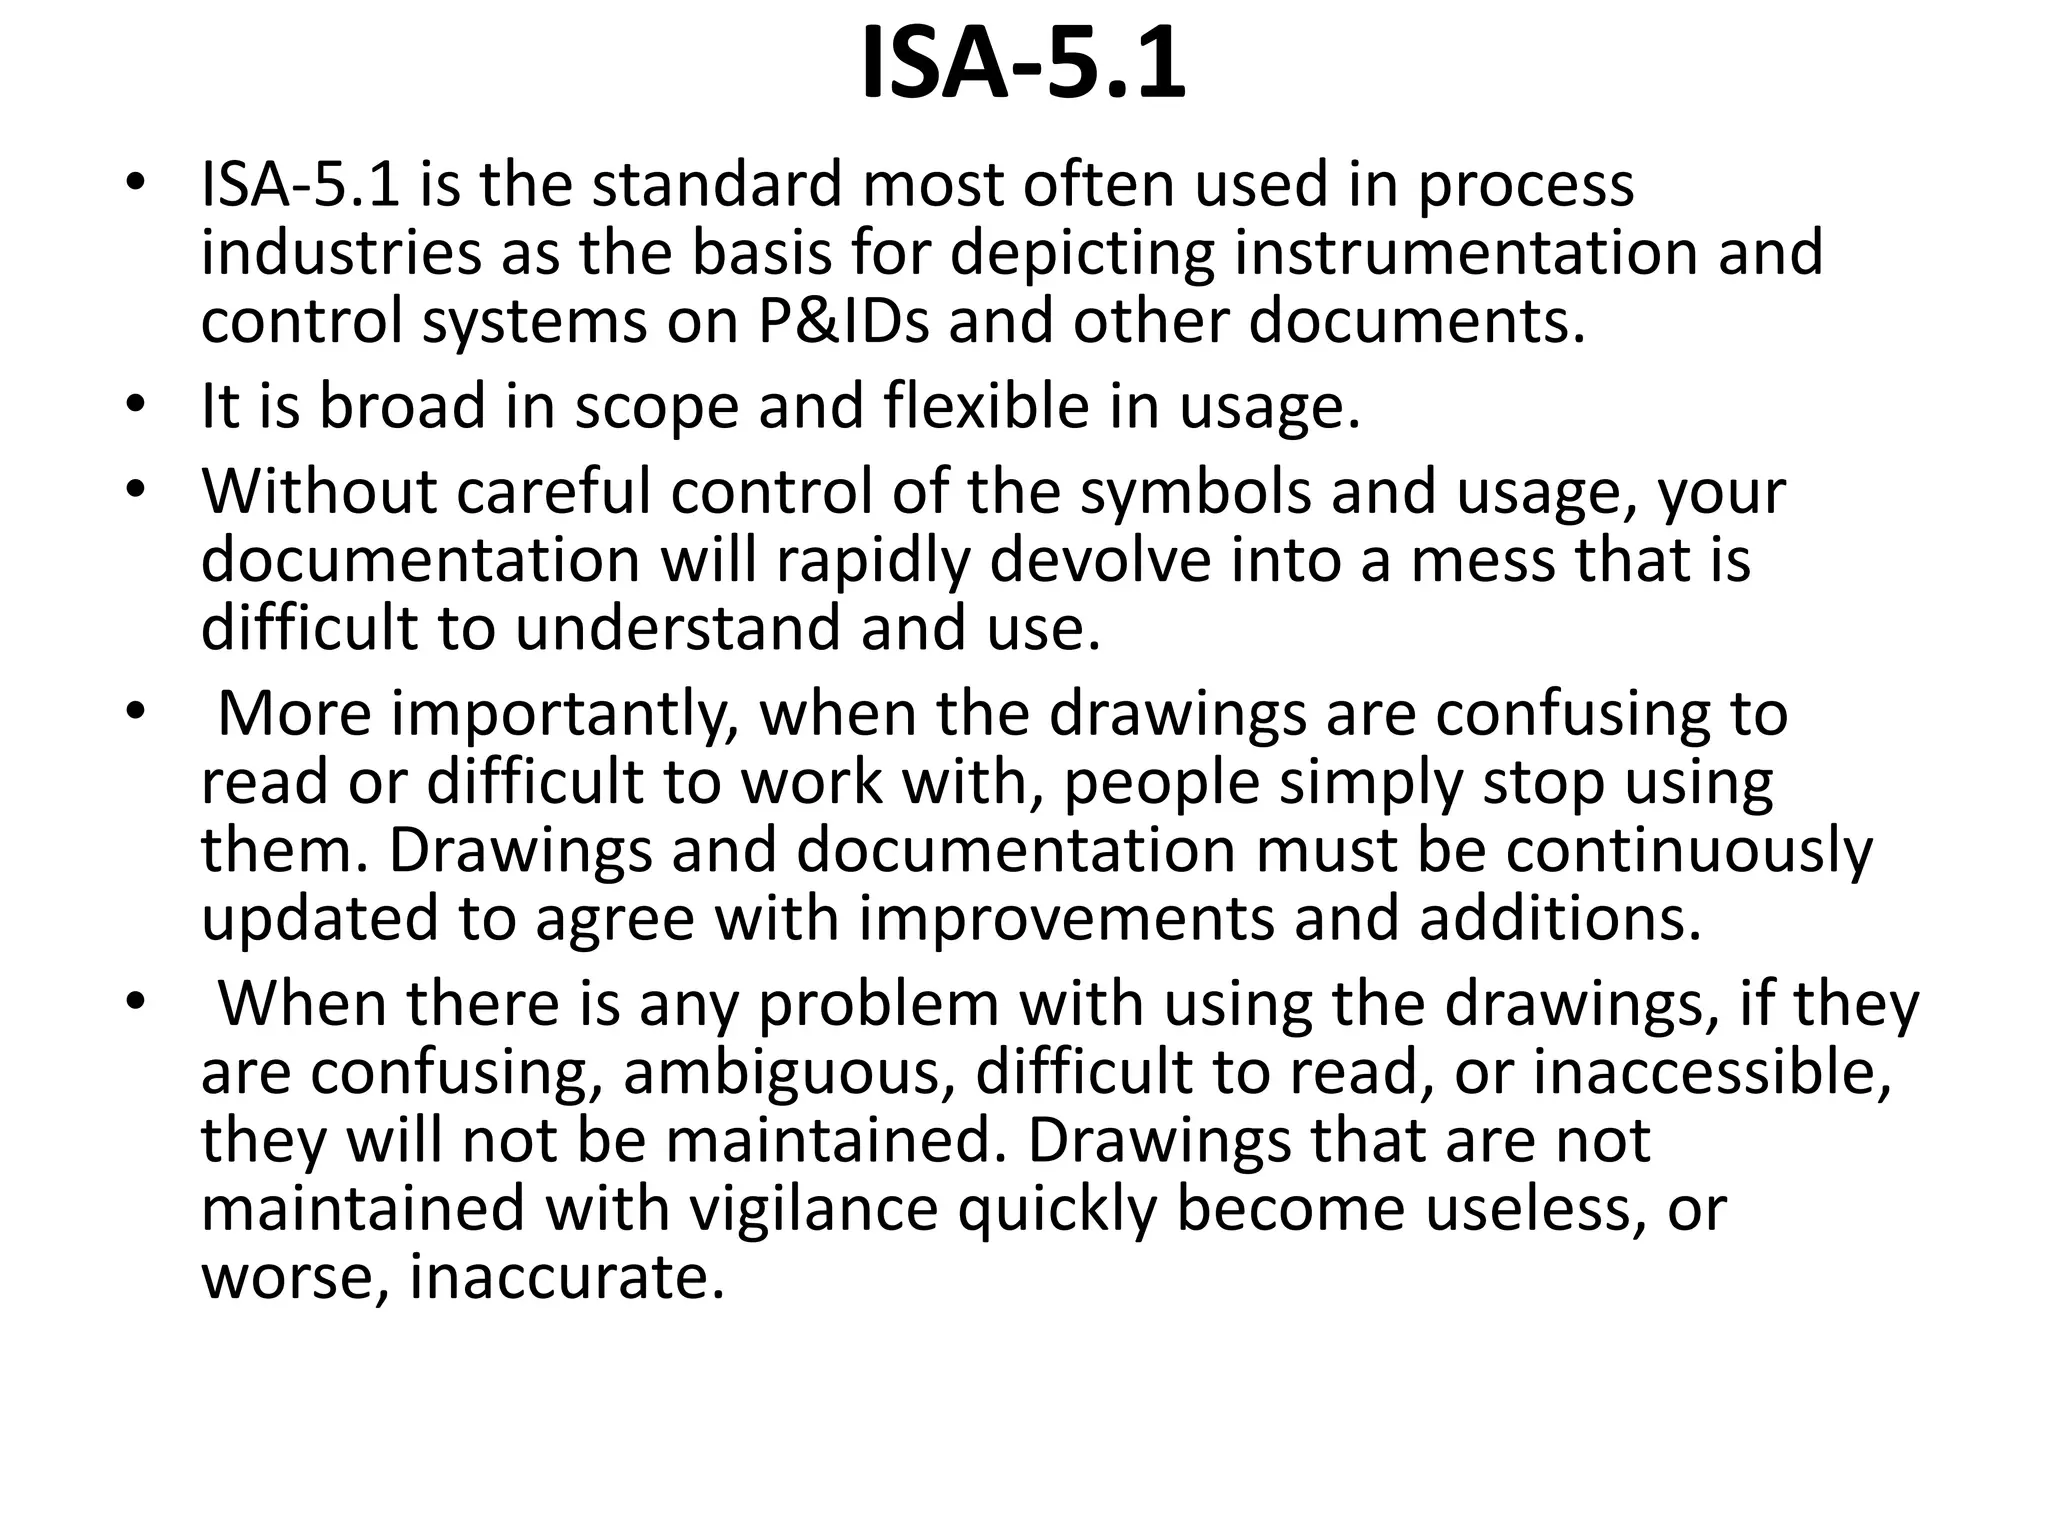
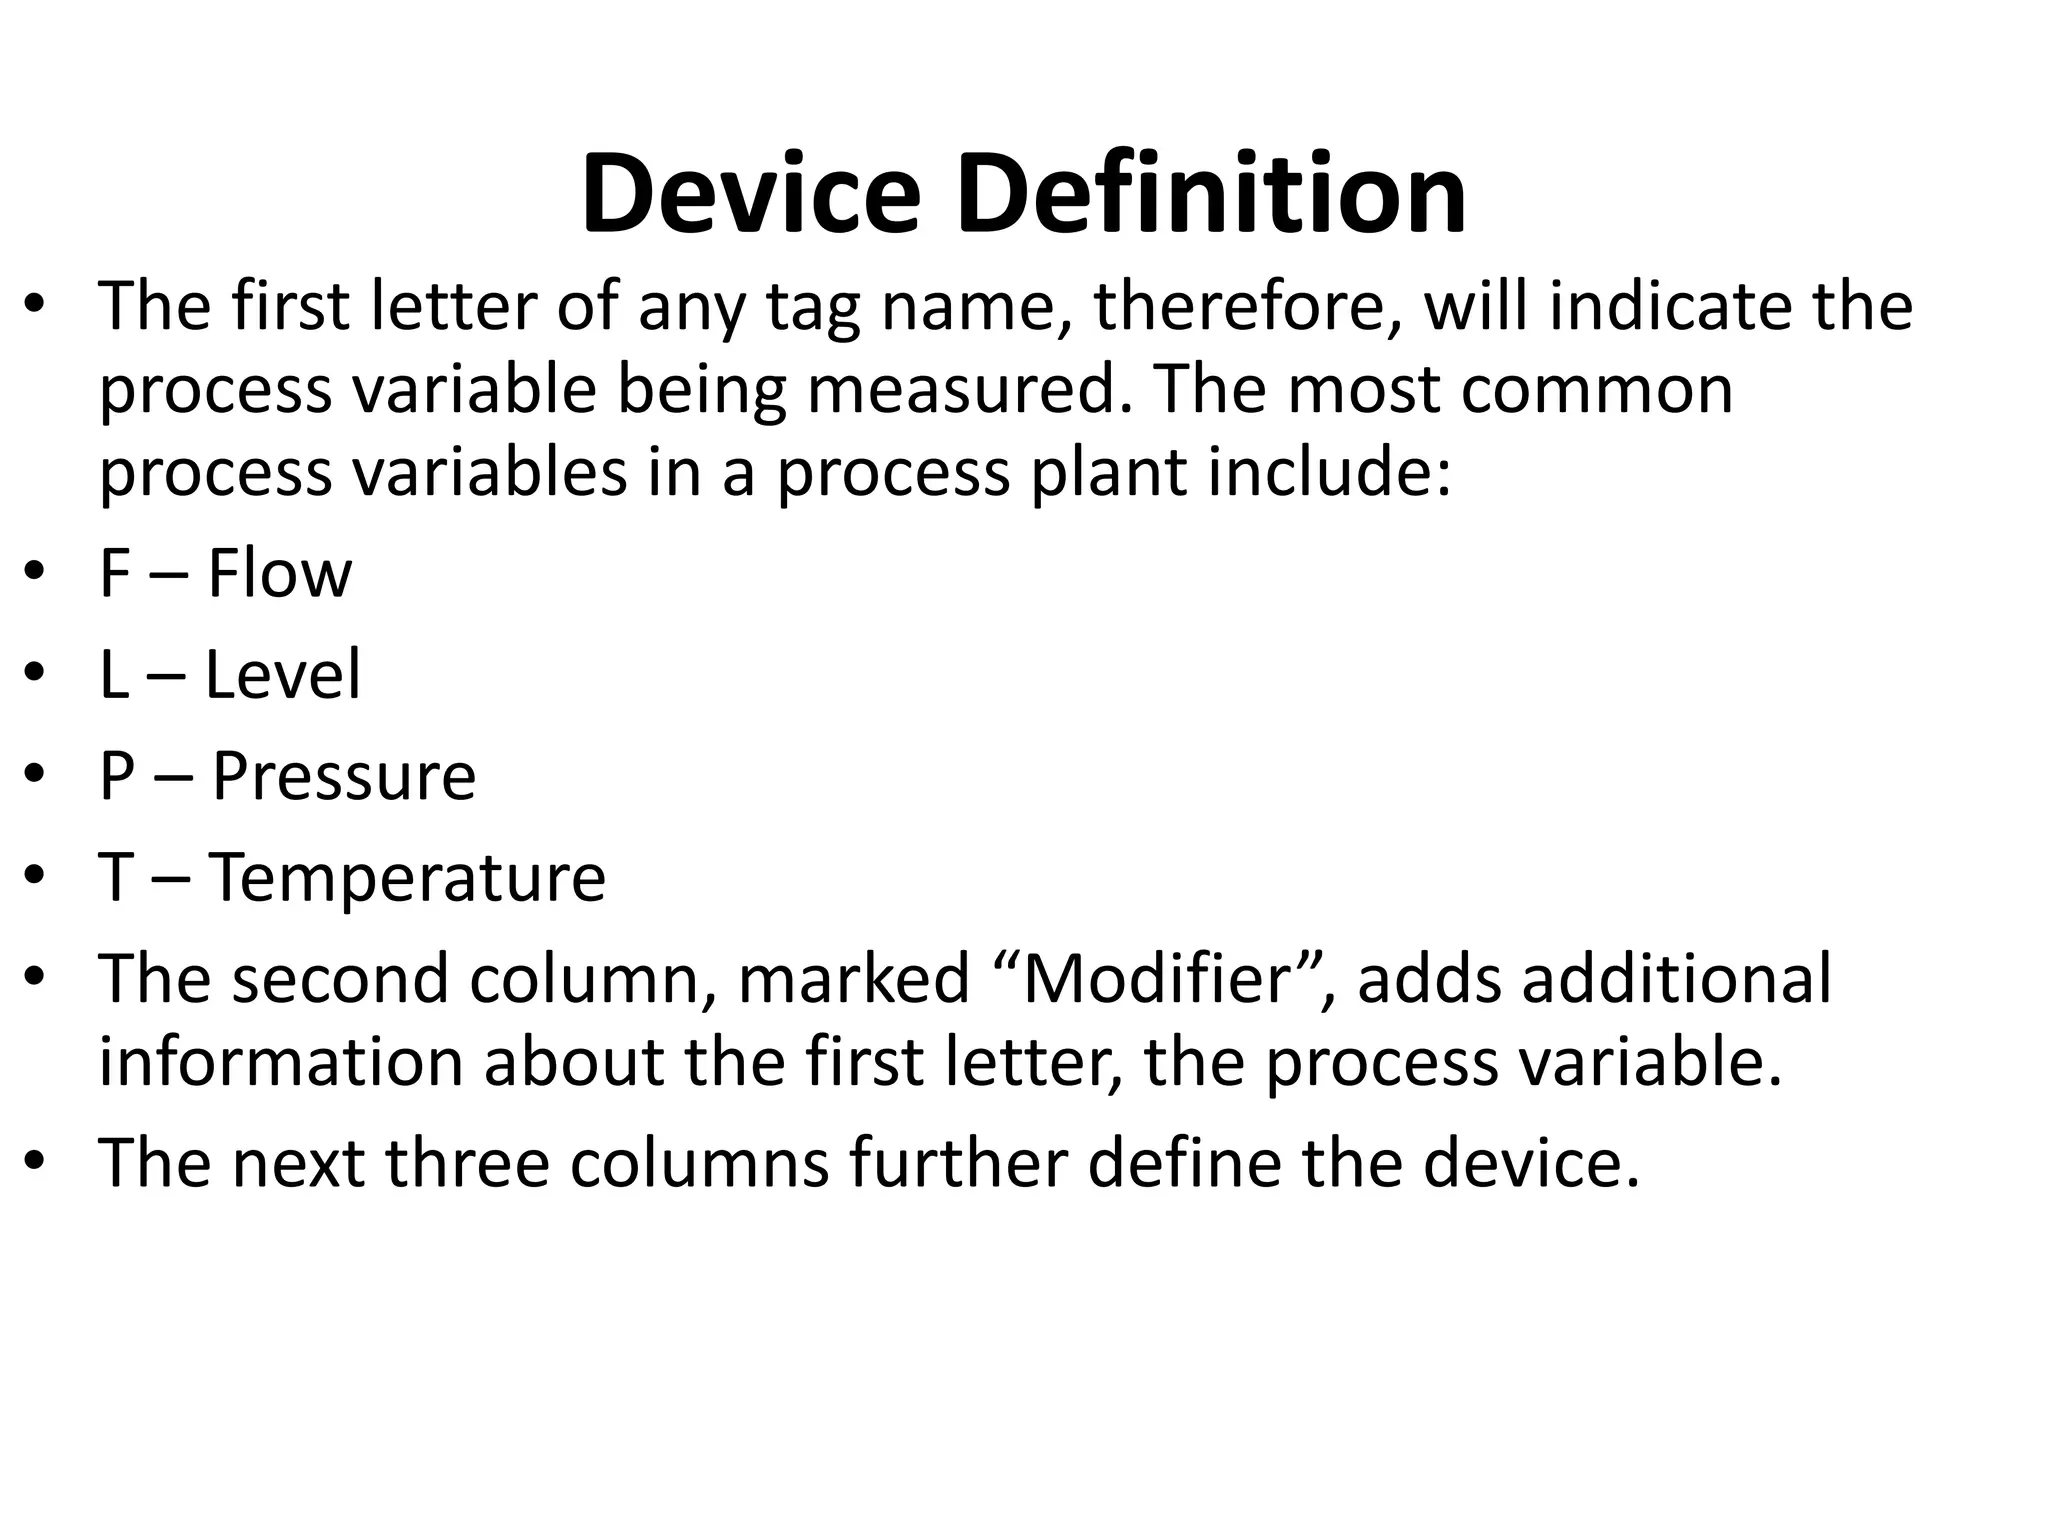
SlideShare a Scribd company logo
1 of 35
PFD and P&I Diagram
The process flow diagram (PFD) is used in chemical and
process engineering. This kind of diagram shows the flow of
chemical materials and the equipment involved in the
process.
In other words, a process flow diagram shows the
relationships between the major components in the system.
Generally, a PFD shows only the major equipment and
doesn't show details. A PFD does not show minor
components, piping systems, piping ratings, and
designations.
PFDs are applied in visitor information and new employee
training.
• A PFD should include:
• Process Piping
• Major equipment symbols, names and identification
numbers
• Control, valves and valves that affect operation of the
system
• Interconnection with other systems
• Major bypass and recirculation lines
• System ratings and operational values as minimum,
normal and maximum flow, temperature and pressure
• Composition of fluids
• A Process and Instrument Drawing (P&ID) includes
more details than a PFD. It consists of both major
and minor flows, control loops, and instrumentation.
• P&ID is sometimes referred to as a Piping and
Instrumentation Drawing. Such diagrams are also
called flowsheets.
• P&IDs are applied by process technicians and
instrument and electrical, mechanical, safety, and
engineering personnel.
A P&ID should include:
• Instrumentation and designations
• Mechanical equipment with names and numbers
• All valves and their identifications
• Process piping, sizes and identification
• Miscellaneous - vents, drains, special fittings, sampling lines, reducers,
increasers and swagers
• Permanent start-up and flush lines
• Flow directions
• Interconnections references
• Control inputs and outputs, interlocks Interfaces for class changes Seismic
category
• Quality level
• Annunciation inputs
• Computer control system input
• Vendor and contractor interfaces
• Identification of components and subsystems delivered by others
• Intended physical sequence of the equipment
• Minimum Detail Approach
• For a PFD to be effective, the entire process is
shown in as little space as practical. Only the
major process steps are depicted, and detail is
minimized.
• The intent is to simply show a change has been
made or a product has been produced, rather
than how that change was made.
• It can be somewhat of a challenge to limit the
detail shown on a PFD. For example, very little, or
no, instrumentation and control (I&C) detail is
shown on a PFD, since this equipment is not
critical to the material balance.
• One successful rule of thumb is to show detail
on equipment only if that information has a
significant impact on the material balance, or
if that information is needed to define
something special about that equipment. The
term “special” here means a “significant cost
impact to the project”
Additional Detail Approach
• Other plant design teams and plant owners
believe a PFD should include more design details.
These teams and owners involve the I&C
engineers early in the project.
• The I&C engineers are involved in the
development of the PFDs. The PFDs might then
include design details such as major
measurement points, control methods, control
valves, and process analyzers.
• The PFDs are used as a guide, or perhaps even a
first step, in the development of the P&IDs.
• A PFD is most likely developed in several steps.
• The plant owner may develop a preliminary PFD, as a first
step, to be used as a “thinking document” which sets down
on paper a proposed process or a process change that is
under consideration.
• The plant owner may elect to use other methods to document
the work, such as a written description to define the process
scope.
• Process Description. In either form, this information is used to
establish the initial design criteria for the plant.
• The PFDs, or other conceptual information, is normally
reviewed by the engineering contractor's process engineers
and planning team before the release to detail design. The
review is to ensure two criteria have been met:
• 1. There is enough information on the PFD to support
development of the P&IDs by all the detail design
disciplines. The decision that “enough” information is
presented is probably best left to the design entity that
will use the PFD.
• 2. Material balance information is present to support,
with the experience of the project design and
purchasing teams, identification and specification of
“long lead” equipment. “Long lead” equipment is the
equipment that requires a long time to procure,
design, fabricate and ship. In other words, it is
equipment that has to be purchased early in the
project.
•A typical preliminary PFD, or process description, will
show the product manufactured by the plant; raw
materials necessary for that product; by-products
produced by the process; waste materials that must be
disposed of; process pressures, temperatures, and flows
needed to produce the product;
• and major equipment needed. The important piping runs
are shown, but piping is not sized on a PFD, and auxiliary
and utility piping are not shown.
• A written description of the process may also be
included, perhaps to emphasize certain critical
characteristics of the process.
• The PFD in Figure 1-1 shows there is a flow in the process line,
stream number (1), of 10,000 pounds/hour of wet gas with a
temperature between 90°F and 180ºF and a pressure of 20
psi. The variation in temperature is caused by process changes
upstream of our PFD.
• Note that only a stream number, (1), (2) or (3) identifies the
pipelines. Not included are line size, material of construction,
or pressure rating (ANSI 150, ANSI 300, etc) for any of the
piping shown on the PFD. Also note that there are no symbols
or data shown for the pump driver. Only its equipment
number, G-005, identifies the pump.
• The wet gas goes into D-001, the Knockout Drum, where the
liquid condenses out of the wet gas stream as the gas expands
and cools. The liquid is pumped to a separator (on another
PFD) where the water and process liquid are separated.
• Stream number (2) shows the pump G-005 has a discharge
pressure of 50 psi. The pumped liquids have a specific gravity
of 0.9 at 60ºF. The pump has a capacity of 1,000 pounds/hour
and the temperature of the degassed material varies between
70ºF and 170ºF. The light ends or gases, 9,000 pounds/hour
and shown as stream number (3), are piped to a flare, which is
shown on another PFD. The pressure needed to move this
quantity of gas to the flare is 4 psi. From this simple simulated
PFD we have enough information to start development of the
P&ID.
• Batch processing plants may contain equipment used
in different ways, in different sequences - often for
many different batches or products at one time, or at
different times.
• The PFD defines a continuous process very efficiently.
Batch processing, however, may require additional
definition. A batch process subjects a fixed quantity of
material (a batch) to one or more process steps in one
or more pieces of equipment.
• The process takes place in a set of equipment defined
in ANSI/ISA-88.01-1995, Batch Control Part 1: Models
and Terminology as a process cell.1
P &I diagram
• The acronym “P&ID” is widely understood within the process
industries as the name for the principal document used to
define a process – the equipment, piping and all monitoring
and control components.
• P&IDs “show the interconnection of process equipment and
the instrumentation used to control the process”
• Sets of symbols are used to depict mechanical equipment,
piping, piping components, valves,equipment drivers and
instrumentation and controls. These symbols are assembled
on the drawing in a manner that clearly defines the process.
The instrumentation and control (I&C) symbols used in P&IDs
are generally based on ISA-5.1-1984-(R1992), Instrumentation
Symbols and Identification.
• Although the P&ID is the overall document used to define the
process, the first document developed in the evolution of a process
design is often the PFD, the Process Flow Diagram Once a PFD is
released for detail design, the project scope has been established
and P&ID development may commence.
• P&IDs develop in steps.
• The key members of the design team – perhaps plant design,
piping, process, and project specialists, all lay out a conceptual pass
at showing vessels, equipment and major piping.
• The instrumentation and controls are typically added next, since
they often require significant additional space on the P&ID.
• Then, the contributions of the specialists in electrical,mechanical
equipment, vessels and other disciplines are added.
• These specialists fill in the information blocks containing equipment
numbers, titles and definitive text reserved for critical information
regarding the equipment: size, rating, throughput, and utility usage
(horsepower).
• The developmental process is an iterative one. Information is added
in steps until the document is complete with all necessary details.
• P&IDs are controlled documents formally issued at various stages.
• Control means changes to the drawings are identified and clearly documented
in some manner and there is verification checking or some other quality
assurance procedure in effect.
• The care needed to control the content of P&IDs can be understood in light of
the fact that P&IDs carry the definitive information from which many design
entities draw their work.
• From the P&ID comes the Instrument List and the specification, acquisition
and installation of all instrumentation and controls. From the P&ID comes the
motor list with horsepower.
• From the P&ID come the piping line list, sizes, service and purpose.
• The drawings even document critical information regarding tanks, vessels and
other equipment – all of which are used to lay out equipment and start the
specification and purchasing efforts. In some states, P&IDs carry professional
engineers’ stamps.
ISA-5.1
• ISA-5.1 is the standard most often used in process
industries as the basis for depicting instrumentation and
control systems on P&IDs and other documents.
• It is broad in scope and flexible in usage.
• Without careful control of the symbols and usage, your
documentation will rapidly devolve into a mess that is
difficult to understand and use.
• More importantly, when the drawings are confusing to
read or difficult to work with, people simply stop using
them. Drawings and documentation must be continuously
updated to agree with improvements and additions.
• When there is any problem with using the drawings, if they
are confusing, ambiguous, difficult to read, or inaccessible,
they will not be maintained. Drawings that are not
maintained with vigilance quickly become useless, or
worse, inaccurate.
Device Definition
• The first letter of any tag name, therefore, will indicate the
process variable being measured. The most common
process variables in a process plant include:
• F – Flow
• L – Level
• P – Pressure
• T – Temperature
• The second column, marked “Modifier”, adds additional
information about the first letter, the process variable.
• The next three columns further define the device.
Instrument Numbering
• In addition to the letters, the instrumentation and
control design group assigns a sequence number
to each function.
• All the devices within that function carry the
same sequential number – in other words, the
loop number.
• A single loop number is used to identify the
devices that accomplish a single specific action –
usually an input and an output for PID control, an
input for indication of a process variable, or a
manual output.
Process Flow Diagram and P&I Diagram.pptx

More Related Content

Similar to Process Flow Diagram and P&I Diagram.pptx

2.-Introduction-to-Process-Plant-Layout-and-Piping-Design.pptx
2.-Introduction-to-Process-Plant-Layout-and-Piping-Design.pptx2.-Introduction-to-Process-Plant-Layout-and-Piping-Design.pptx
2.-Introduction-to-Process-Plant-Layout-and-Piping-Design.pptxKarenGedalanga
 
How to write a plant operating manual
How to write a plant operating manualHow to write a plant operating manual
How to write a plant operating manualJohn Kingsley
 
PIPING & INSTRUMENTATION DIAGRAM.pdf
PIPING & INSTRUMENTATION DIAGRAM.pdfPIPING & INSTRUMENTATION DIAGRAM.pdf
PIPING & INSTRUMENTATION DIAGRAM.pdfMassinissaHamel
 
Session 25 - Documentation
Session 25 - DocumentationSession 25 - Documentation
Session 25 - DocumentationVidyaIA
 
PIPING AND INSTRUMENTATION DIAGRAMS PRESENTATION.pdf
PIPING AND INSTRUMENTATION DIAGRAMS PRESENTATION.pdfPIPING AND INSTRUMENTATION DIAGRAMS PRESENTATION.pdf
PIPING AND INSTRUMENTATION DIAGRAMS PRESENTATION.pdfeldoctol
 
Episode 30 : Project Execution ( Part 1 )
Episode 30 :  Project Execution ( Part 1 ) Episode 30 :  Project Execution ( Part 1 )
Episode 30 : Project Execution ( Part 1 ) SAJJAD KHUDHUR ABBAS
 
Process Engineer Training PID.ppt.pdf
Process Engineer Training PID.ppt.pdfProcess Engineer Training PID.ppt.pdf
Process Engineer Training PID.ppt.pdfFaustoMarceloCaibe
 
Facility Qualification & Consideration of Validation Aspects
Facility Qualification & Consideration of Validation Aspects Facility Qualification & Consideration of Validation Aspects
Facility Qualification & Consideration of Validation Aspects Apoorva Bauskar
 
Process Instrument LC1
Process  Instrument LC1Process  Instrument LC1
Process Instrument LC1marcoReud
 
Design control FDA requirements
Design control FDA requirementsDesign control FDA requirements
Design control FDA requirementsLatvian University
 
Instrumentation Design & Detailed Engineering
Instrumentation Design & Detailed EngineeringInstrumentation Design & Detailed Engineering
Instrumentation Design & Detailed EngineeringGautamVadnere
 

Similar to Process Flow Diagram and P&I Diagram.pptx (20)

2.-Introduction-to-Process-Plant-Layout-and-Piping-Design.pptx
2.-Introduction-to-Process-Plant-Layout-and-Piping-Design.pptx2.-Introduction-to-Process-Plant-Layout-and-Piping-Design.pptx
2.-Introduction-to-Process-Plant-Layout-and-Piping-Design.pptx
 
How to write a plant operating manual
How to write a plant operating manualHow to write a plant operating manual
How to write a plant operating manual
 
PIPING & INSTRUMENTATION DIAGRAM.pdf
PIPING & INSTRUMENTATION DIAGRAM.pdfPIPING & INSTRUMENTATION DIAGRAM.pdf
PIPING & INSTRUMENTATION DIAGRAM.pdf
 
Process Drawings
Process DrawingsProcess Drawings
Process Drawings
 
Documentation
DocumentationDocumentation
Documentation
 
Session 25 - Documentation
Session 25 - DocumentationSession 25 - Documentation
Session 25 - Documentation
 
Piping Design ppt.pdf
Piping Design ppt.pdfPiping Design ppt.pdf
Piping Design ppt.pdf
 
PIPING AND INSTRUMENTATION DIAGRAMS PRESENTATION.pdf
PIPING AND INSTRUMENTATION DIAGRAMS PRESENTATION.pdfPIPING AND INSTRUMENTATION DIAGRAMS PRESENTATION.pdf
PIPING AND INSTRUMENTATION DIAGRAMS PRESENTATION.pdf
 
PEPD MODULE 1.pdf
PEPD MODULE 1.pdfPEPD MODULE 1.pdf
PEPD MODULE 1.pdf
 
PFD_P&ID.pdf
PFD_P&ID.pdfPFD_P&ID.pdf
PFD_P&ID.pdf
 
Process Plant design fundementals
Process Plant design fundementalsProcess Plant design fundementals
Process Plant design fundementals
 
Episode 30 : Project Execution ( Part 1 )
Episode 30 :  Project Execution ( Part 1 ) Episode 30 :  Project Execution ( Part 1 )
Episode 30 : Project Execution ( Part 1 )
 
Process Engineer Training PID.ppt.pdf
Process Engineer Training PID.ppt.pdfProcess Engineer Training PID.ppt.pdf
Process Engineer Training PID.ppt.pdf
 
00 introduction
00 introduction00 introduction
00 introduction
 
Facility Qualification & Consideration of Validation Aspects
Facility Qualification & Consideration of Validation Aspects Facility Qualification & Consideration of Validation Aspects
Facility Qualification & Consideration of Validation Aspects
 
Process Instrument LC1
Process  Instrument LC1Process  Instrument LC1
Process Instrument LC1
 
Maintainability engineering
Maintainability engineeringMaintainability engineering
Maintainability engineering
 
Design control FDA requirements
Design control FDA requirementsDesign control FDA requirements
Design control FDA requirements
 
Ppaptr
PpaptrPpaptr
Ppaptr
 
Instrumentation Design & Detailed Engineering
Instrumentation Design & Detailed EngineeringInstrumentation Design & Detailed Engineering
Instrumentation Design & Detailed Engineering
 

More from DrAyyarKandasamy

Supply systems for Electric Traction.ppt
Supply systems for Electric Traction.pptSupply systems for Electric Traction.ppt
Supply systems for Electric Traction.pptDrAyyarKandasamy
 
Electric Traction Current Collection System.ppt
Electric Traction Current Collection System.pptElectric Traction Current Collection System.ppt
Electric Traction Current Collection System.pptDrAyyarKandasamy
 
TRACTION MOTORS in Electric Traction.ppt
TRACTION MOTORS in Electric Traction.pptTRACTION MOTORS in Electric Traction.ppt
TRACTION MOTORS in Electric Traction.pptDrAyyarKandasamy
 
Power Plant Instrumentation FBC BOILERS.pptx
Power Plant Instrumentation FBC BOILERS.pptxPower Plant Instrumentation FBC BOILERS.pptx
Power Plant Instrumentation FBC BOILERS.pptxDrAyyarKandasamy
 
Biomedical Instrumentation auto analyser.pptx
Biomedical Instrumentation auto analyser.pptxBiomedical Instrumentation auto analyser.pptx
Biomedical Instrumentation auto analyser.pptxDrAyyarKandasamy
 
UNIT III - SIGNAL CONDITIONING CIRCUITS.pptx
UNIT III - SIGNAL CONDITIONING CIRCUITS.pptxUNIT III - SIGNAL CONDITIONING CIRCUITS.pptx
UNIT III - SIGNAL CONDITIONING CIRCUITS.pptxDrAyyarKandasamy
 
PLC Structured Text (ST) Programming.pptx
PLC Structured Text (ST) Programming.pptxPLC Structured Text (ST) Programming.pptx
PLC Structured Text (ST) Programming.pptxDrAyyarKandasamy
 
Logic and Distributed Control Systems (PLC timer and counter).pptx
Logic and Distributed Control Systems (PLC timer and counter).pptxLogic and Distributed Control Systems (PLC timer and counter).pptx
Logic and Distributed Control Systems (PLC timer and counter).pptxDrAyyarKandasamy
 
Remote Terminal Unit (RTU) in SCADA.pptx
Remote Terminal Unit (RTU) in SCADA.pptxRemote Terminal Unit (RTU) in SCADA.pptx
Remote Terminal Unit (RTU) in SCADA.pptxDrAyyarKandasamy
 
UNIT – III – AGREEMENTS AND LEGISLATIONS.pptx
UNIT – III – AGREEMENTS AND LEGISLATIONS.pptxUNIT – III – AGREEMENTS AND LEGISLATIONS.pptx
UNIT – III – AGREEMENTS AND LEGISLATIONS.pptxDrAyyarKandasamy
 
UNIVERSAL VALUES AND ETHICS (UHVE)-II.pptx
UNIVERSAL VALUES AND ETHICS (UHVE)-II.pptxUNIVERSAL VALUES AND ETHICS (UHVE)-II.pptx
UNIVERSAL VALUES AND ETHICS (UHVE)-II.pptxDrAyyarKandasamy
 
Cyclone Furnace in power plant instrumentation.pptx
Cyclone Furnace in power plant instrumentation.pptxCyclone Furnace in power plant instrumentation.pptx
Cyclone Furnace in power plant instrumentation.pptxDrAyyarKandasamy
 
parametric methods System Identification.pptx
parametric methods System Identification.pptxparametric methods System Identification.pptx
parametric methods System Identification.pptxDrAyyarKandasamy
 
Three Phase Transformer Connections.pptx
Three Phase Transformer Connections.pptxThree Phase Transformer Connections.pptx
Three Phase Transformer Connections.pptxDrAyyarKandasamy
 

More from DrAyyarKandasamy (15)

Supply systems for Electric Traction.ppt
Supply systems for Electric Traction.pptSupply systems for Electric Traction.ppt
Supply systems for Electric Traction.ppt
 
Electric Traction Current Collection System.ppt
Electric Traction Current Collection System.pptElectric Traction Current Collection System.ppt
Electric Traction Current Collection System.ppt
 
TRACTION MOTORS in Electric Traction.ppt
TRACTION MOTORS in Electric Traction.pptTRACTION MOTORS in Electric Traction.ppt
TRACTION MOTORS in Electric Traction.ppt
 
Power Plant Instrumentation FBC BOILERS.pptx
Power Plant Instrumentation FBC BOILERS.pptxPower Plant Instrumentation FBC BOILERS.pptx
Power Plant Instrumentation FBC BOILERS.pptx
 
Biomedical Instrumentation auto analyser.pptx
Biomedical Instrumentation auto analyser.pptxBiomedical Instrumentation auto analyser.pptx
Biomedical Instrumentation auto analyser.pptx
 
UNIT III - SIGNAL CONDITIONING CIRCUITS.pptx
UNIT III - SIGNAL CONDITIONING CIRCUITS.pptxUNIT III - SIGNAL CONDITIONING CIRCUITS.pptx
UNIT III - SIGNAL CONDITIONING CIRCUITS.pptx
 
PLC Structured Text (ST) Programming.pptx
PLC Structured Text (ST) Programming.pptxPLC Structured Text (ST) Programming.pptx
PLC Structured Text (ST) Programming.pptx
 
Logic and Distributed Control Systems (PLC timer and counter).pptx
Logic and Distributed Control Systems (PLC timer and counter).pptxLogic and Distributed Control Systems (PLC timer and counter).pptx
Logic and Distributed Control Systems (PLC timer and counter).pptx
 
Remote Terminal Unit (RTU) in SCADA.pptx
Remote Terminal Unit (RTU) in SCADA.pptxRemote Terminal Unit (RTU) in SCADA.pptx
Remote Terminal Unit (RTU) in SCADA.pptx
 
UNIT – III – AGREEMENTS AND LEGISLATIONS.pptx
UNIT – III – AGREEMENTS AND LEGISLATIONS.pptxUNIT – III – AGREEMENTS AND LEGISLATIONS.pptx
UNIT – III – AGREEMENTS AND LEGISLATIONS.pptx
 
UNIVERSAL VALUES AND ETHICS (UHVE)-II.pptx
UNIVERSAL VALUES AND ETHICS (UHVE)-II.pptxUNIVERSAL VALUES AND ETHICS (UHVE)-II.pptx
UNIVERSAL VALUES AND ETHICS (UHVE)-II.pptx
 
Cyclone Furnace in power plant instrumentation.pptx
Cyclone Furnace in power plant instrumentation.pptxCyclone Furnace in power plant instrumentation.pptx
Cyclone Furnace in power plant instrumentation.pptx
 
parametric methods System Identification.pptx
parametric methods System Identification.pptxparametric methods System Identification.pptx
parametric methods System Identification.pptx
 
Three Phase Transformer Connections.pptx
Three Phase Transformer Connections.pptxThree Phase Transformer Connections.pptx
Three Phase Transformer Connections.pptx
 
RGA.pptx
RGA.pptxRGA.pptx
RGA.pptx
 

Recently uploaded

social pharmacy d-pharm 1st year by Pragati K. Mahajan
social pharmacy d-pharm 1st year by Pragati K. Mahajansocial pharmacy d-pharm 1st year by Pragati K. Mahajan
social pharmacy d-pharm 1st year by Pragati K. Mahajanpragatimahajan3
 
Sanyam Choudhary Chemistry practical.pdf
Sanyam Choudhary Chemistry practical.pdfSanyam Choudhary Chemistry practical.pdf
Sanyam Choudhary Chemistry practical.pdfsanyamsingh5019
 
Measures of Dispersion and Variability: Range, QD, AD and SD
Measures of Dispersion and Variability: Range, QD, AD and SDMeasures of Dispersion and Variability: Range, QD, AD and SD
Measures of Dispersion and Variability: Range, QD, AD and SDThiyagu K
 
Introduction to Nonprofit Accounting: The Basics
Introduction to Nonprofit Accounting: The BasicsIntroduction to Nonprofit Accounting: The Basics
Introduction to Nonprofit Accounting: The BasicsTechSoup
 
Interactive Powerpoint_How to Master effective communication
Interactive Powerpoint_How to Master effective communicationInteractive Powerpoint_How to Master effective communication
Interactive Powerpoint_How to Master effective communicationnomboosow
 
Software Engineering Methodologies (overview)
Software Engineering Methodologies (overview)Software Engineering Methodologies (overview)
Software Engineering Methodologies (overview)eniolaolutunde
 
IGNOU MSCCFT and PGDCFT Exam Question Pattern: MCFT003 Counselling and Family...
IGNOU MSCCFT and PGDCFT Exam Question Pattern: MCFT003 Counselling and Family...IGNOU MSCCFT and PGDCFT Exam Question Pattern: MCFT003 Counselling and Family...
IGNOU MSCCFT and PGDCFT Exam Question Pattern: MCFT003 Counselling and Family...PsychoTech Services
 
Nutritional Needs Presentation - HLTH 104
Nutritional Needs Presentation - HLTH 104Nutritional Needs Presentation - HLTH 104
Nutritional Needs Presentation - HLTH 104misteraugie
 
The basics of sentences session 2pptx copy.pptx
The basics of sentences session 2pptx copy.pptxThe basics of sentences session 2pptx copy.pptx
The basics of sentences session 2pptx copy.pptxheathfieldcps1
 
Kisan Call Centre - To harness potential of ICT in Agriculture by answer farm...
Kisan Call Centre - To harness potential of ICT in Agriculture by answer farm...Kisan Call Centre - To harness potential of ICT in Agriculture by answer farm...
Kisan Call Centre - To harness potential of ICT in Agriculture by answer farm...Krashi Coaching
 
9548086042 for call girls in Indira Nagar with room service
9548086042  for call girls in Indira Nagar  with room service9548086042  for call girls in Indira Nagar  with room service
9548086042 for call girls in Indira Nagar with room servicediscovermytutordmt
 
SOCIAL AND HISTORICAL CONTEXT - LFTVD.pptx
SOCIAL AND HISTORICAL CONTEXT - LFTVD.pptxSOCIAL AND HISTORICAL CONTEXT - LFTVD.pptx
SOCIAL AND HISTORICAL CONTEXT - LFTVD.pptxiammrhaywood
 
Sports & Fitness Value Added Course FY..
Sports & Fitness Value Added Course FY..Sports & Fitness Value Added Course FY..
Sports & Fitness Value Added Course FY..Disha Kariya
 
Russian Escort Service in Delhi 11k Hotel Foreigner Russian Call Girls in Delhi
Russian Escort Service in Delhi 11k Hotel Foreigner Russian Call Girls in DelhiRussian Escort Service in Delhi 11k Hotel Foreigner Russian Call Girls in Delhi
Russian Escort Service in Delhi 11k Hotel Foreigner Russian Call Girls in Delhikauryashika82
 
Student login on Anyboli platform.helpin
Student login on Anyboli platform.helpinStudent login on Anyboli platform.helpin
Student login on Anyboli platform.helpinRaunakKeshri1
 
BASLIQ CURRENT LOOKBOOK LOOKBOOK(1) (1).pdf
BASLIQ CURRENT LOOKBOOK  LOOKBOOK(1) (1).pdfBASLIQ CURRENT LOOKBOOK  LOOKBOOK(1) (1).pdf
BASLIQ CURRENT LOOKBOOK LOOKBOOK(1) (1).pdfSoniaTolstoy
 
APM Welcome, APM North West Network Conference, Synergies Across Sectors
APM Welcome, APM North West Network Conference, Synergies Across SectorsAPM Welcome, APM North West Network Conference, Synergies Across Sectors
APM Welcome, APM North West Network Conference, Synergies Across SectorsAssociation for Project Management
 

Recently uploaded (20)

social pharmacy d-pharm 1st year by Pragati K. Mahajan
social pharmacy d-pharm 1st year by Pragati K. Mahajansocial pharmacy d-pharm 1st year by Pragati K. Mahajan
social pharmacy d-pharm 1st year by Pragati K. Mahajan
 
Sanyam Choudhary Chemistry practical.pdf
Sanyam Choudhary Chemistry practical.pdfSanyam Choudhary Chemistry practical.pdf
Sanyam Choudhary Chemistry practical.pdf
 
Measures of Dispersion and Variability: Range, QD, AD and SD
Measures of Dispersion and Variability: Range, QD, AD and SDMeasures of Dispersion and Variability: Range, QD, AD and SD
Measures of Dispersion and Variability: Range, QD, AD and SD
 
Introduction to Nonprofit Accounting: The Basics
Introduction to Nonprofit Accounting: The BasicsIntroduction to Nonprofit Accounting: The Basics
Introduction to Nonprofit Accounting: The Basics
 
Interactive Powerpoint_How to Master effective communication
Interactive Powerpoint_How to Master effective communicationInteractive Powerpoint_How to Master effective communication
Interactive Powerpoint_How to Master effective communication
 
Software Engineering Methodologies (overview)
Software Engineering Methodologies (overview)Software Engineering Methodologies (overview)
Software Engineering Methodologies (overview)
 
IGNOU MSCCFT and PGDCFT Exam Question Pattern: MCFT003 Counselling and Family...
IGNOU MSCCFT and PGDCFT Exam Question Pattern: MCFT003 Counselling and Family...IGNOU MSCCFT and PGDCFT Exam Question Pattern: MCFT003 Counselling and Family...
IGNOU MSCCFT and PGDCFT Exam Question Pattern: MCFT003 Counselling and Family...
 
Nutritional Needs Presentation - HLTH 104
Nutritional Needs Presentation - HLTH 104Nutritional Needs Presentation - HLTH 104
Nutritional Needs Presentation - HLTH 104
 
Mattingly "AI & Prompt Design: Structured Data, Assistants, & RAG"
Mattingly "AI & Prompt Design: Structured Data, Assistants, & RAG"Mattingly "AI & Prompt Design: Structured Data, Assistants, & RAG"
Mattingly "AI & Prompt Design: Structured Data, Assistants, & RAG"
 
The basics of sentences session 2pptx copy.pptx
The basics of sentences session 2pptx copy.pptxThe basics of sentences session 2pptx copy.pptx
The basics of sentences session 2pptx copy.pptx
 
Kisan Call Centre - To harness potential of ICT in Agriculture by answer farm...
Kisan Call Centre - To harness potential of ICT in Agriculture by answer farm...Kisan Call Centre - To harness potential of ICT in Agriculture by answer farm...
Kisan Call Centre - To harness potential of ICT in Agriculture by answer farm...
 
9548086042 for call girls in Indira Nagar with room service
9548086042  for call girls in Indira Nagar  with room service9548086042  for call girls in Indira Nagar  with room service
9548086042 for call girls in Indira Nagar with room service
 
SOCIAL AND HISTORICAL CONTEXT - LFTVD.pptx
SOCIAL AND HISTORICAL CONTEXT - LFTVD.pptxSOCIAL AND HISTORICAL CONTEXT - LFTVD.pptx
SOCIAL AND HISTORICAL CONTEXT - LFTVD.pptx
 
INDIA QUIZ 2024 RLAC DELHI UNIVERSITY.pptx
INDIA QUIZ 2024 RLAC DELHI UNIVERSITY.pptxINDIA QUIZ 2024 RLAC DELHI UNIVERSITY.pptx
INDIA QUIZ 2024 RLAC DELHI UNIVERSITY.pptx
 
Sports & Fitness Value Added Course FY..
Sports & Fitness Value Added Course FY..Sports & Fitness Value Added Course FY..
Sports & Fitness Value Added Course FY..
 
Russian Escort Service in Delhi 11k Hotel Foreigner Russian Call Girls in Delhi
Russian Escort Service in Delhi 11k Hotel Foreigner Russian Call Girls in DelhiRussian Escort Service in Delhi 11k Hotel Foreigner Russian Call Girls in Delhi
Russian Escort Service in Delhi 11k Hotel Foreigner Russian Call Girls in Delhi
 
Student login on Anyboli platform.helpin
Student login on Anyboli platform.helpinStudent login on Anyboli platform.helpin
Student login on Anyboli platform.helpin
 
Código Creativo y Arte de Software | Unidad 1
Código Creativo y Arte de Software | Unidad 1Código Creativo y Arte de Software | Unidad 1
Código Creativo y Arte de Software | Unidad 1
 
BASLIQ CURRENT LOOKBOOK LOOKBOOK(1) (1).pdf
BASLIQ CURRENT LOOKBOOK  LOOKBOOK(1) (1).pdfBASLIQ CURRENT LOOKBOOK  LOOKBOOK(1) (1).pdf
BASLIQ CURRENT LOOKBOOK LOOKBOOK(1) (1).pdf
 
APM Welcome, APM North West Network Conference, Synergies Across Sectors
APM Welcome, APM North West Network Conference, Synergies Across SectorsAPM Welcome, APM North West Network Conference, Synergies Across Sectors
APM Welcome, APM North West Network Conference, Synergies Across Sectors
 

Process Flow Diagram and P&I Diagram.pptx

  • 1. PFD and P&I Diagram The process flow diagram (PFD) is used in chemical and process engineering. This kind of diagram shows the flow of chemical materials and the equipment involved in the process. In other words, a process flow diagram shows the relationships between the major components in the system. Generally, a PFD shows only the major equipment and doesn't show details. A PFD does not show minor components, piping systems, piping ratings, and designations. PFDs are applied in visitor information and new employee training.
  • 2. • A PFD should include: • Process Piping • Major equipment symbols, names and identification numbers • Control, valves and valves that affect operation of the system • Interconnection with other systems • Major bypass and recirculation lines • System ratings and operational values as minimum, normal and maximum flow, temperature and pressure • Composition of fluids
  • 3.
  • 4. • A Process and Instrument Drawing (P&ID) includes more details than a PFD. It consists of both major and minor flows, control loops, and instrumentation. • P&ID is sometimes referred to as a Piping and Instrumentation Drawing. Such diagrams are also called flowsheets. • P&IDs are applied by process technicians and instrument and electrical, mechanical, safety, and engineering personnel.
  • 5. A P&ID should include: • Instrumentation and designations • Mechanical equipment with names and numbers • All valves and their identifications • Process piping, sizes and identification • Miscellaneous - vents, drains, special fittings, sampling lines, reducers, increasers and swagers • Permanent start-up and flush lines • Flow directions • Interconnections references • Control inputs and outputs, interlocks Interfaces for class changes Seismic category • Quality level • Annunciation inputs • Computer control system input • Vendor and contractor interfaces • Identification of components and subsystems delivered by others • Intended physical sequence of the equipment
  • 6. • Minimum Detail Approach • For a PFD to be effective, the entire process is shown in as little space as practical. Only the major process steps are depicted, and detail is minimized. • The intent is to simply show a change has been made or a product has been produced, rather than how that change was made. • It can be somewhat of a challenge to limit the detail shown on a PFD. For example, very little, or no, instrumentation and control (I&C) detail is shown on a PFD, since this equipment is not critical to the material balance.
  • 7. • One successful rule of thumb is to show detail on equipment only if that information has a significant impact on the material balance, or if that information is needed to define something special about that equipment. The term “special” here means a “significant cost impact to the project”
  • 8. Additional Detail Approach • Other plant design teams and plant owners believe a PFD should include more design details. These teams and owners involve the I&C engineers early in the project. • The I&C engineers are involved in the development of the PFDs. The PFDs might then include design details such as major measurement points, control methods, control valves, and process analyzers. • The PFDs are used as a guide, or perhaps even a first step, in the development of the P&IDs.
  • 9.
  • 10. • A PFD is most likely developed in several steps. • The plant owner may develop a preliminary PFD, as a first step, to be used as a “thinking document” which sets down on paper a proposed process or a process change that is under consideration. • The plant owner may elect to use other methods to document the work, such as a written description to define the process scope. • Process Description. In either form, this information is used to establish the initial design criteria for the plant. • The PFDs, or other conceptual information, is normally reviewed by the engineering contractor's process engineers and planning team before the release to detail design. The review is to ensure two criteria have been met:
  • 11. • 1. There is enough information on the PFD to support development of the P&IDs by all the detail design disciplines. The decision that “enough” information is presented is probably best left to the design entity that will use the PFD. • 2. Material balance information is present to support, with the experience of the project design and purchasing teams, identification and specification of “long lead” equipment. “Long lead” equipment is the equipment that requires a long time to procure, design, fabricate and ship. In other words, it is equipment that has to be purchased early in the project.
  • 12.
  • 13. •A typical preliminary PFD, or process description, will show the product manufactured by the plant; raw materials necessary for that product; by-products produced by the process; waste materials that must be disposed of; process pressures, temperatures, and flows needed to produce the product; • and major equipment needed. The important piping runs are shown, but piping is not sized on a PFD, and auxiliary and utility piping are not shown. • A written description of the process may also be included, perhaps to emphasize certain critical characteristics of the process.
  • 14. • The PFD in Figure 1-1 shows there is a flow in the process line, stream number (1), of 10,000 pounds/hour of wet gas with a temperature between 90°F and 180ºF and a pressure of 20 psi. The variation in temperature is caused by process changes upstream of our PFD. • Note that only a stream number, (1), (2) or (3) identifies the pipelines. Not included are line size, material of construction, or pressure rating (ANSI 150, ANSI 300, etc) for any of the piping shown on the PFD. Also note that there are no symbols or data shown for the pump driver. Only its equipment number, G-005, identifies the pump. • The wet gas goes into D-001, the Knockout Drum, where the liquid condenses out of the wet gas stream as the gas expands and cools. The liquid is pumped to a separator (on another PFD) where the water and process liquid are separated.
  • 15. • Stream number (2) shows the pump G-005 has a discharge pressure of 50 psi. The pumped liquids have a specific gravity of 0.9 at 60ºF. The pump has a capacity of 1,000 pounds/hour and the temperature of the degassed material varies between 70ºF and 170ºF. The light ends or gases, 9,000 pounds/hour and shown as stream number (3), are piped to a flare, which is shown on another PFD. The pressure needed to move this quantity of gas to the flare is 4 psi. From this simple simulated PFD we have enough information to start development of the P&ID.
  • 16.
  • 17. • Batch processing plants may contain equipment used in different ways, in different sequences - often for many different batches or products at one time, or at different times. • The PFD defines a continuous process very efficiently. Batch processing, however, may require additional definition. A batch process subjects a fixed quantity of material (a batch) to one or more process steps in one or more pieces of equipment. • The process takes place in a set of equipment defined in ANSI/ISA-88.01-1995, Batch Control Part 1: Models and Terminology as a process cell.1
  • 18. P &I diagram • The acronym “P&ID” is widely understood within the process industries as the name for the principal document used to define a process – the equipment, piping and all monitoring and control components. • P&IDs “show the interconnection of process equipment and the instrumentation used to control the process” • Sets of symbols are used to depict mechanical equipment, piping, piping components, valves,equipment drivers and instrumentation and controls. These symbols are assembled on the drawing in a manner that clearly defines the process. The instrumentation and control (I&C) symbols used in P&IDs are generally based on ISA-5.1-1984-(R1992), Instrumentation Symbols and Identification.
  • 19. • Although the P&ID is the overall document used to define the process, the first document developed in the evolution of a process design is often the PFD, the Process Flow Diagram Once a PFD is released for detail design, the project scope has been established and P&ID development may commence. • P&IDs develop in steps. • The key members of the design team – perhaps plant design, piping, process, and project specialists, all lay out a conceptual pass at showing vessels, equipment and major piping. • The instrumentation and controls are typically added next, since they often require significant additional space on the P&ID. • Then, the contributions of the specialists in electrical,mechanical equipment, vessels and other disciplines are added. • These specialists fill in the information blocks containing equipment numbers, titles and definitive text reserved for critical information regarding the equipment: size, rating, throughput, and utility usage (horsepower). • The developmental process is an iterative one. Information is added in steps until the document is complete with all necessary details.
  • 20. • P&IDs are controlled documents formally issued at various stages. • Control means changes to the drawings are identified and clearly documented in some manner and there is verification checking or some other quality assurance procedure in effect. • The care needed to control the content of P&IDs can be understood in light of the fact that P&IDs carry the definitive information from which many design entities draw their work. • From the P&ID comes the Instrument List and the specification, acquisition and installation of all instrumentation and controls. From the P&ID comes the motor list with horsepower. • From the P&ID come the piping line list, sizes, service and purpose. • The drawings even document critical information regarding tanks, vessels and other equipment – all of which are used to lay out equipment and start the specification and purchasing efforts. In some states, P&IDs carry professional engineers’ stamps.
  • 21.
  • 22.
  • 23.
  • 24.
  • 25.
  • 26.
  • 27. ISA-5.1 • ISA-5.1 is the standard most often used in process industries as the basis for depicting instrumentation and control systems on P&IDs and other documents. • It is broad in scope and flexible in usage. • Without careful control of the symbols and usage, your documentation will rapidly devolve into a mess that is difficult to understand and use. • More importantly, when the drawings are confusing to read or difficult to work with, people simply stop using them. Drawings and documentation must be continuously updated to agree with improvements and additions. • When there is any problem with using the drawings, if they are confusing, ambiguous, difficult to read, or inaccessible, they will not be maintained. Drawings that are not maintained with vigilance quickly become useless, or worse, inaccurate.
  • 28. Device Definition • The first letter of any tag name, therefore, will indicate the process variable being measured. The most common process variables in a process plant include: • F – Flow • L – Level • P – Pressure • T – Temperature • The second column, marked “Modifier”, adds additional information about the first letter, the process variable. • The next three columns further define the device.
  • 29.
  • 30. Instrument Numbering • In addition to the letters, the instrumentation and control design group assigns a sequence number to each function. • All the devices within that function carry the same sequential number – in other words, the loop number. • A single loop number is used to identify the devices that accomplish a single specific action – usually an input and an output for PID control, an input for indication of a process variable, or a manual output.