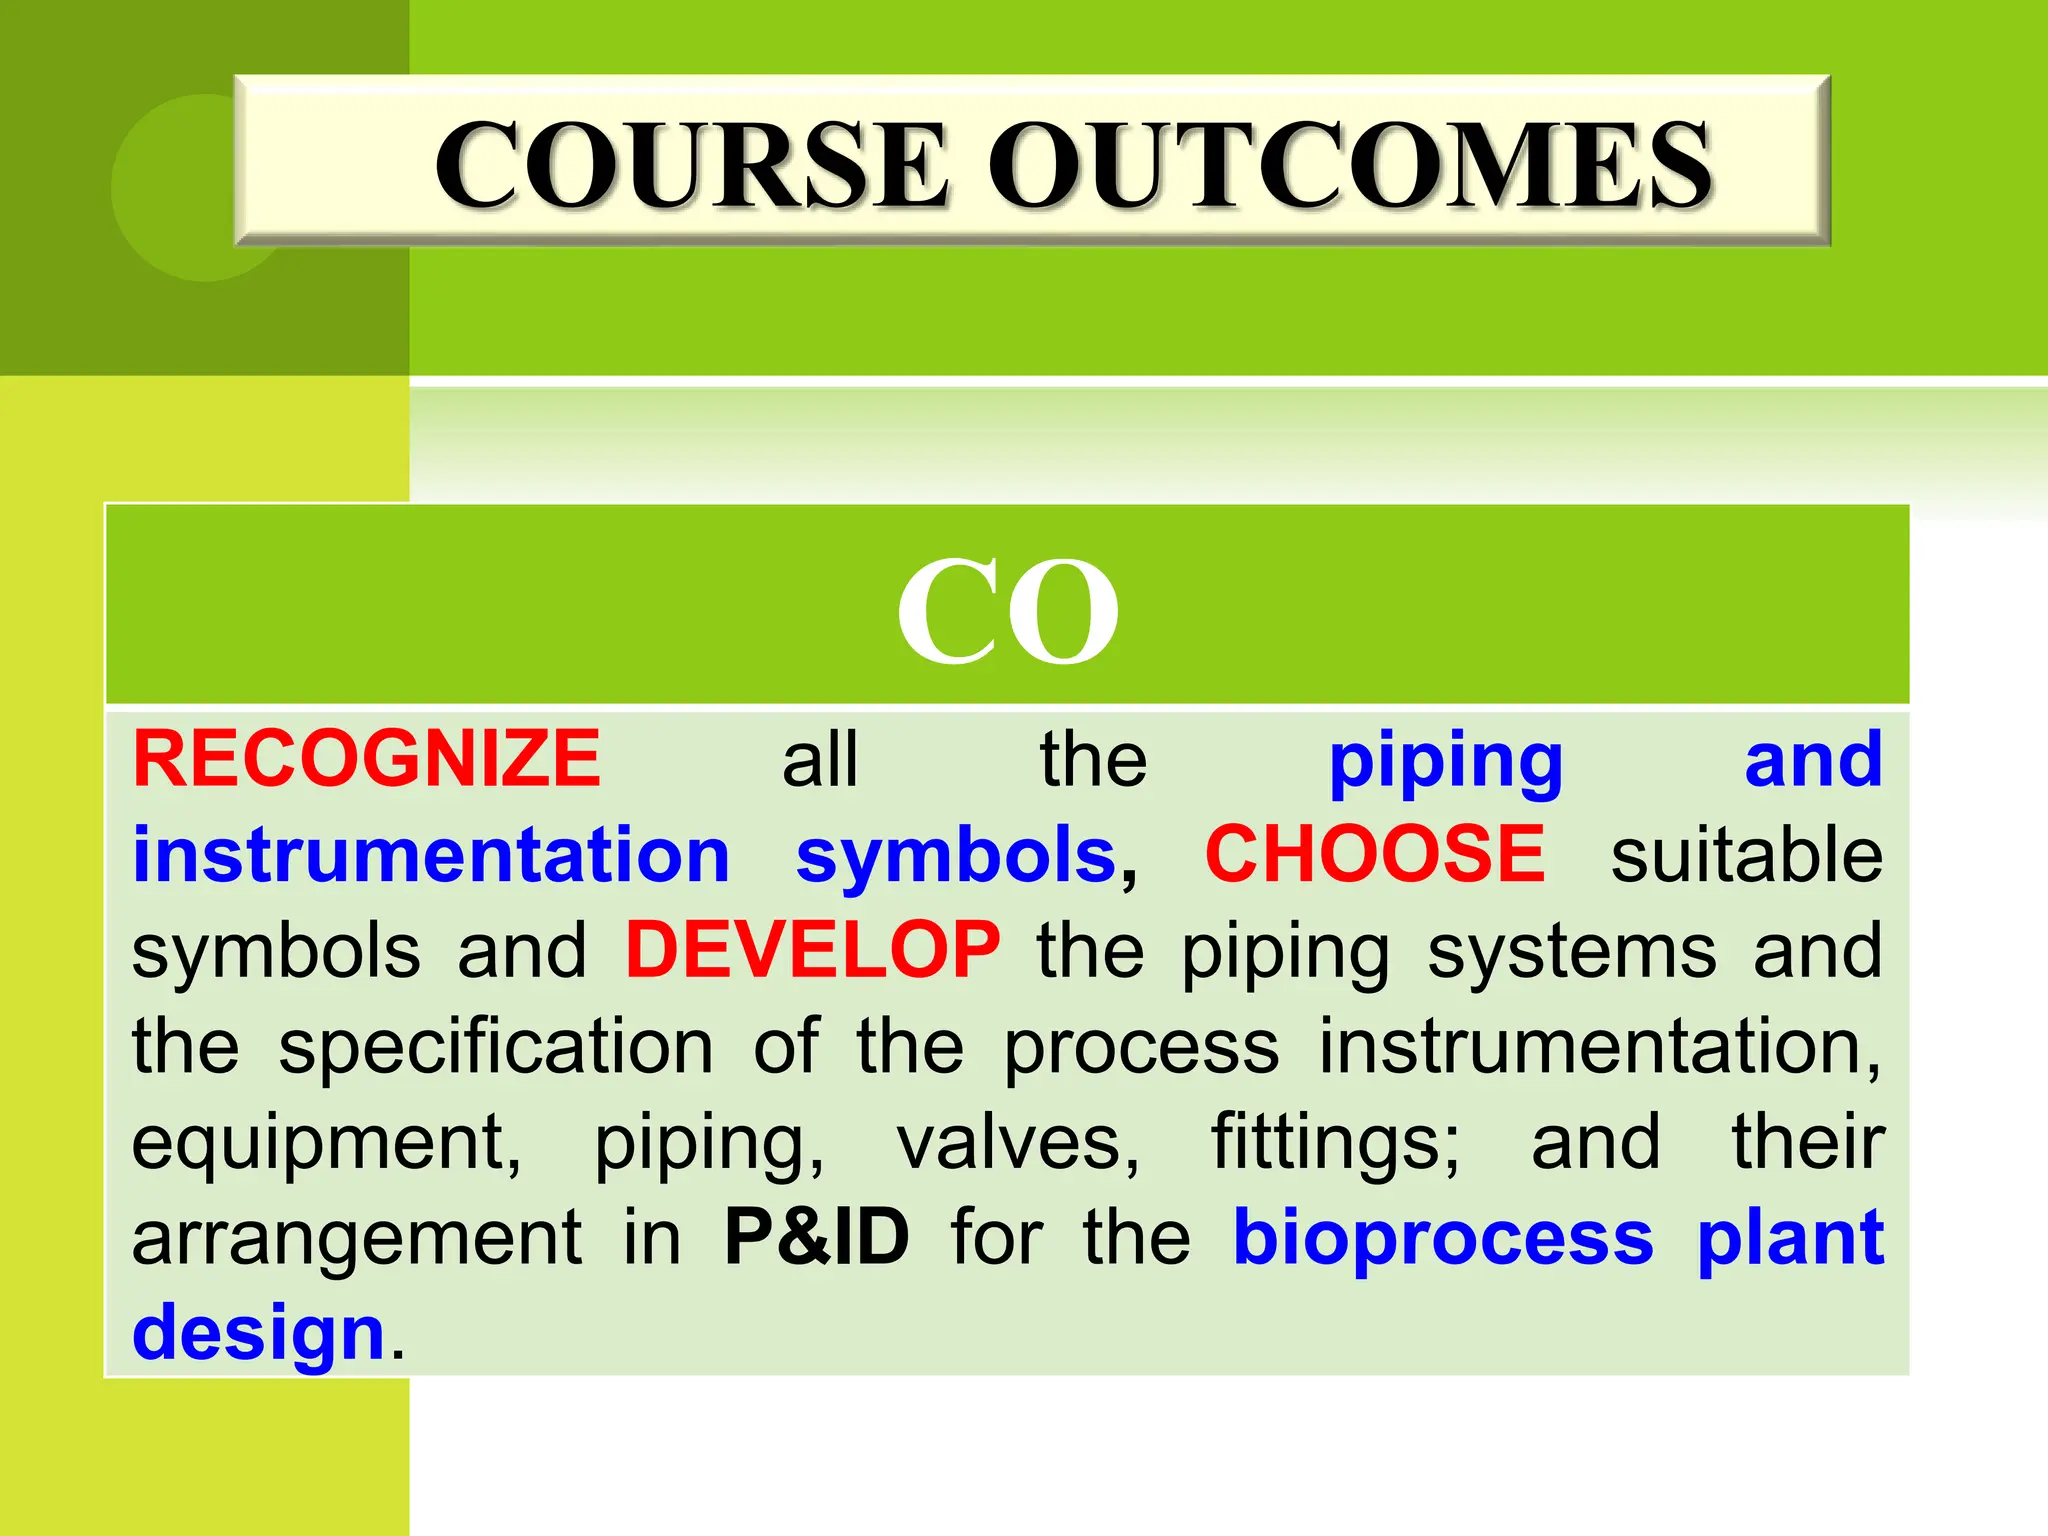
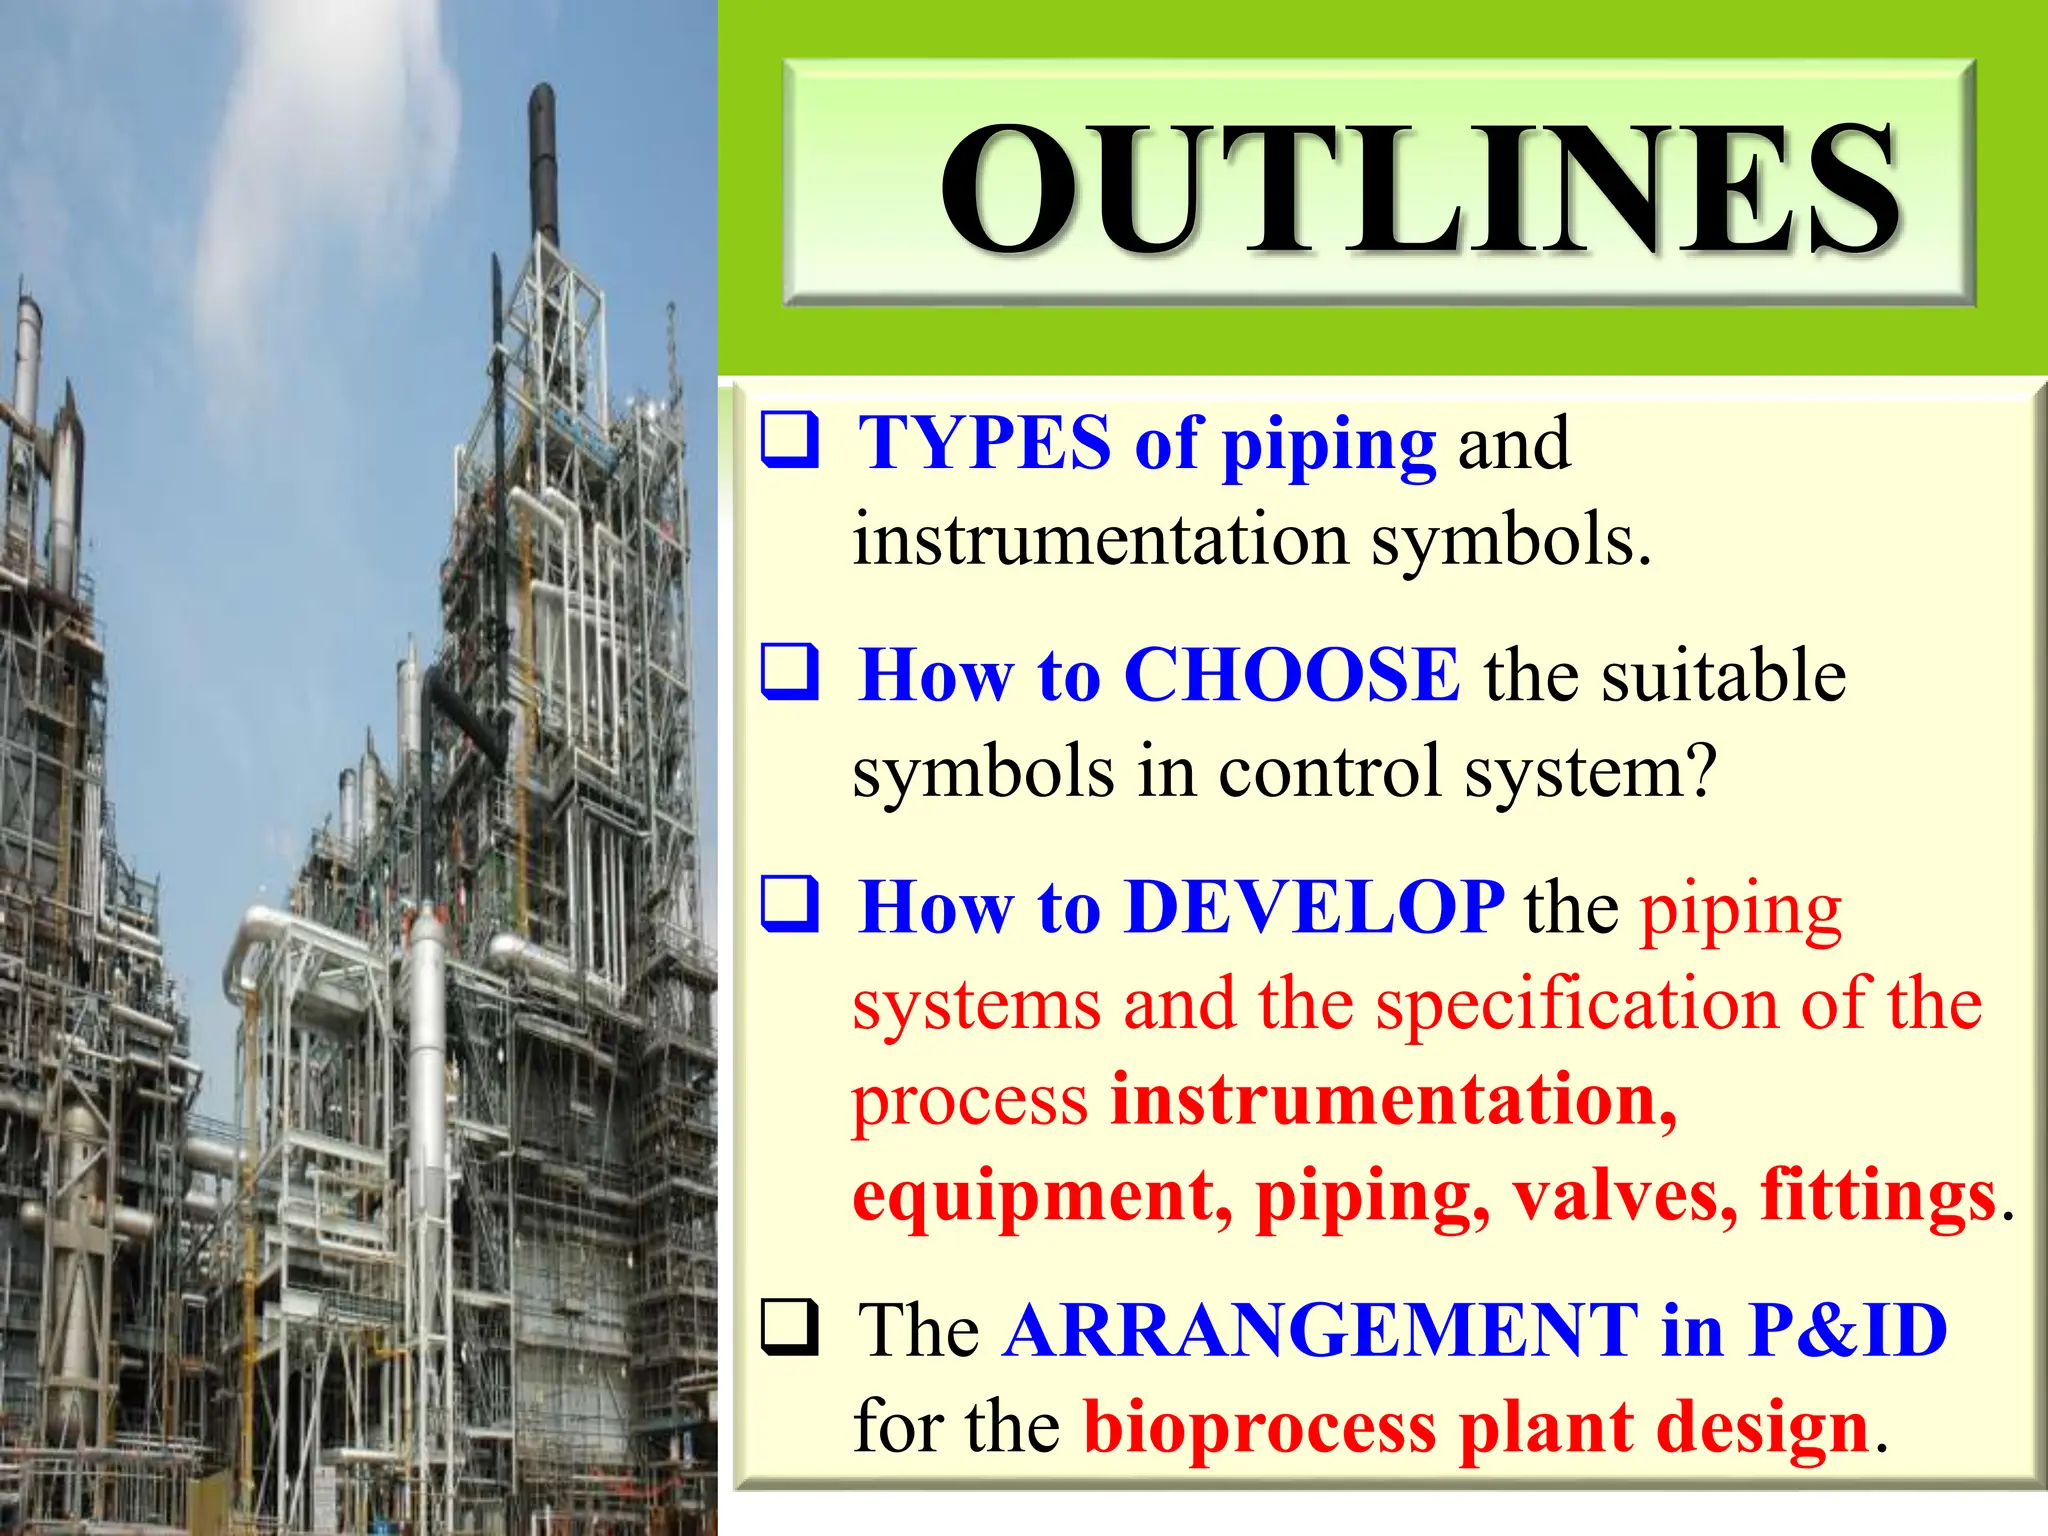
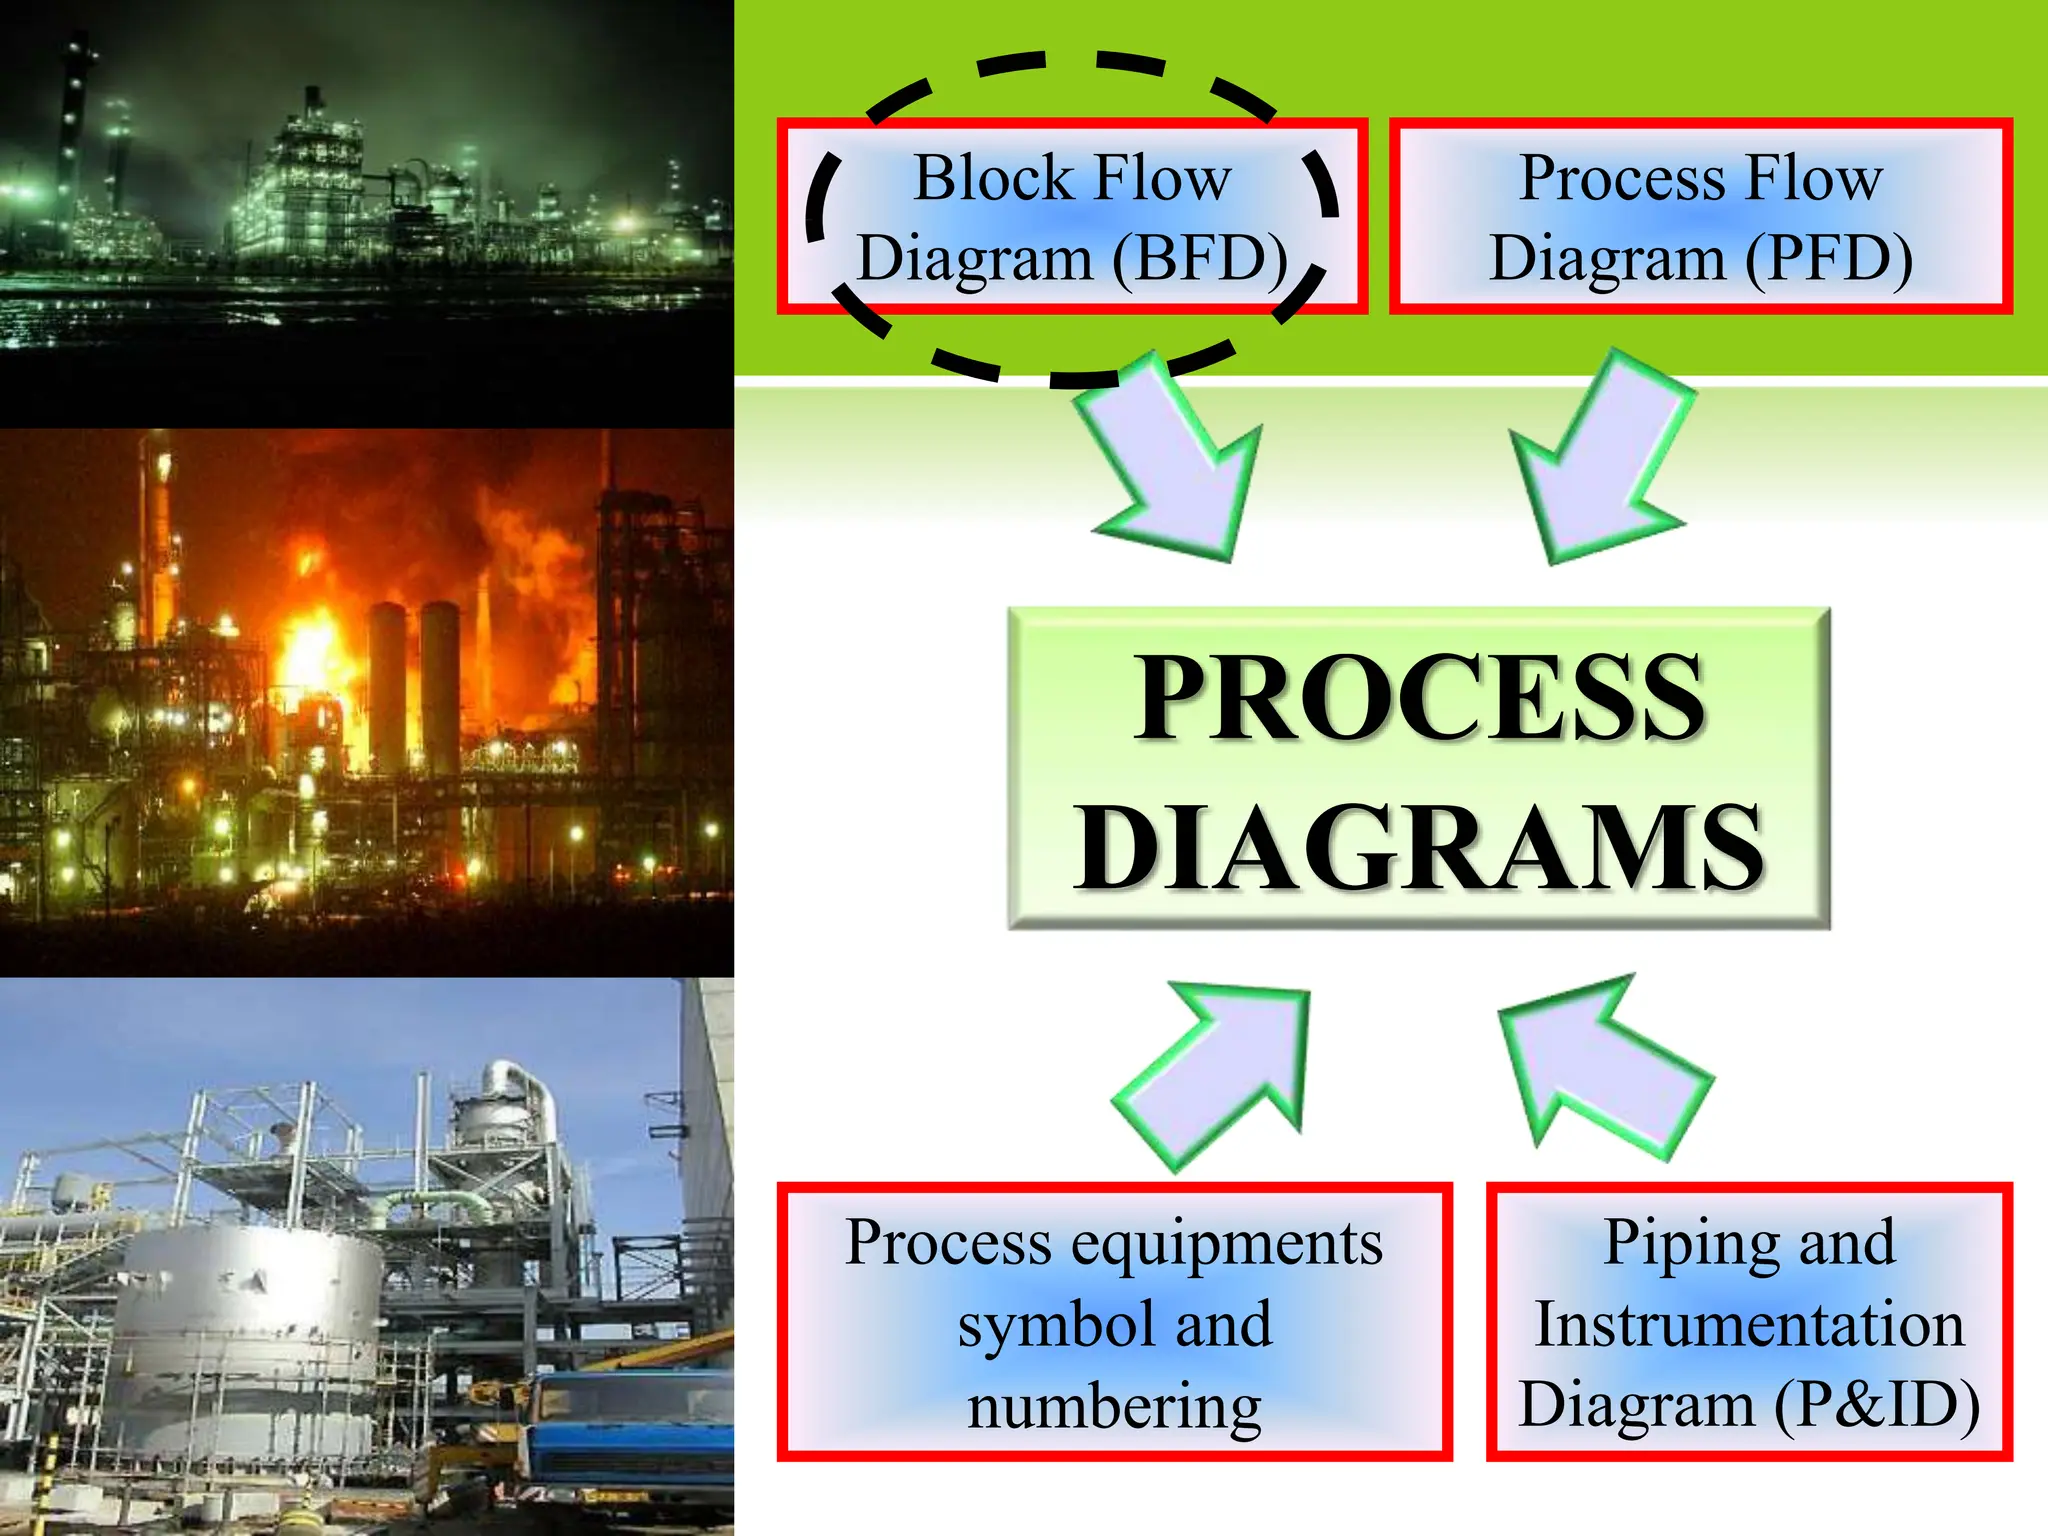
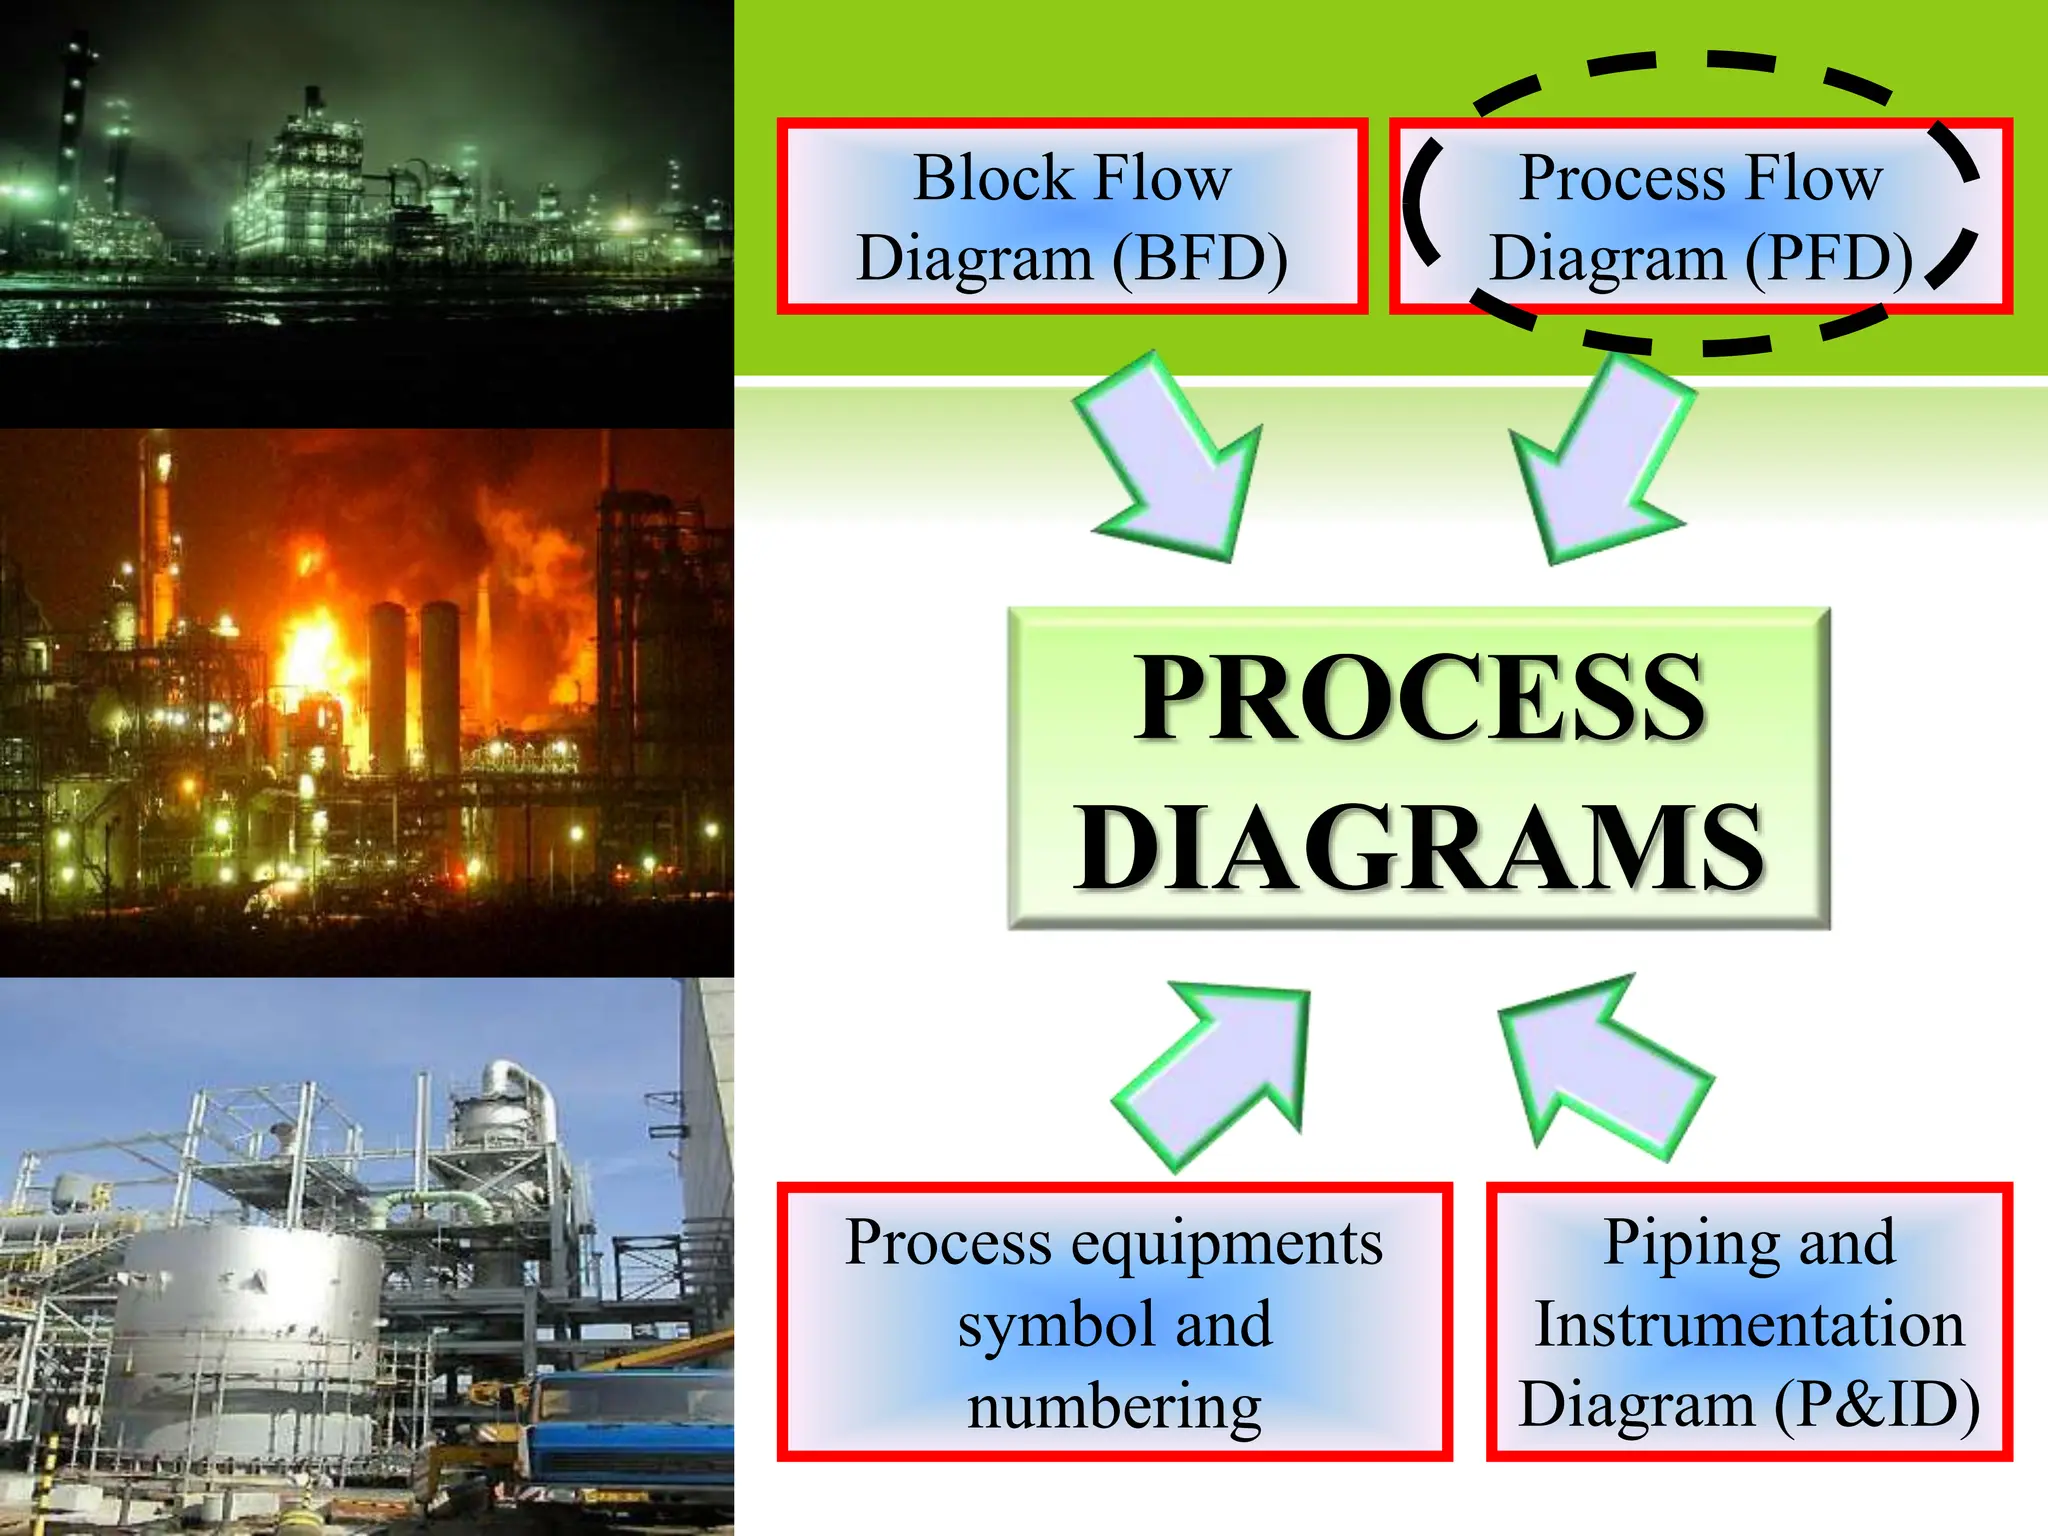
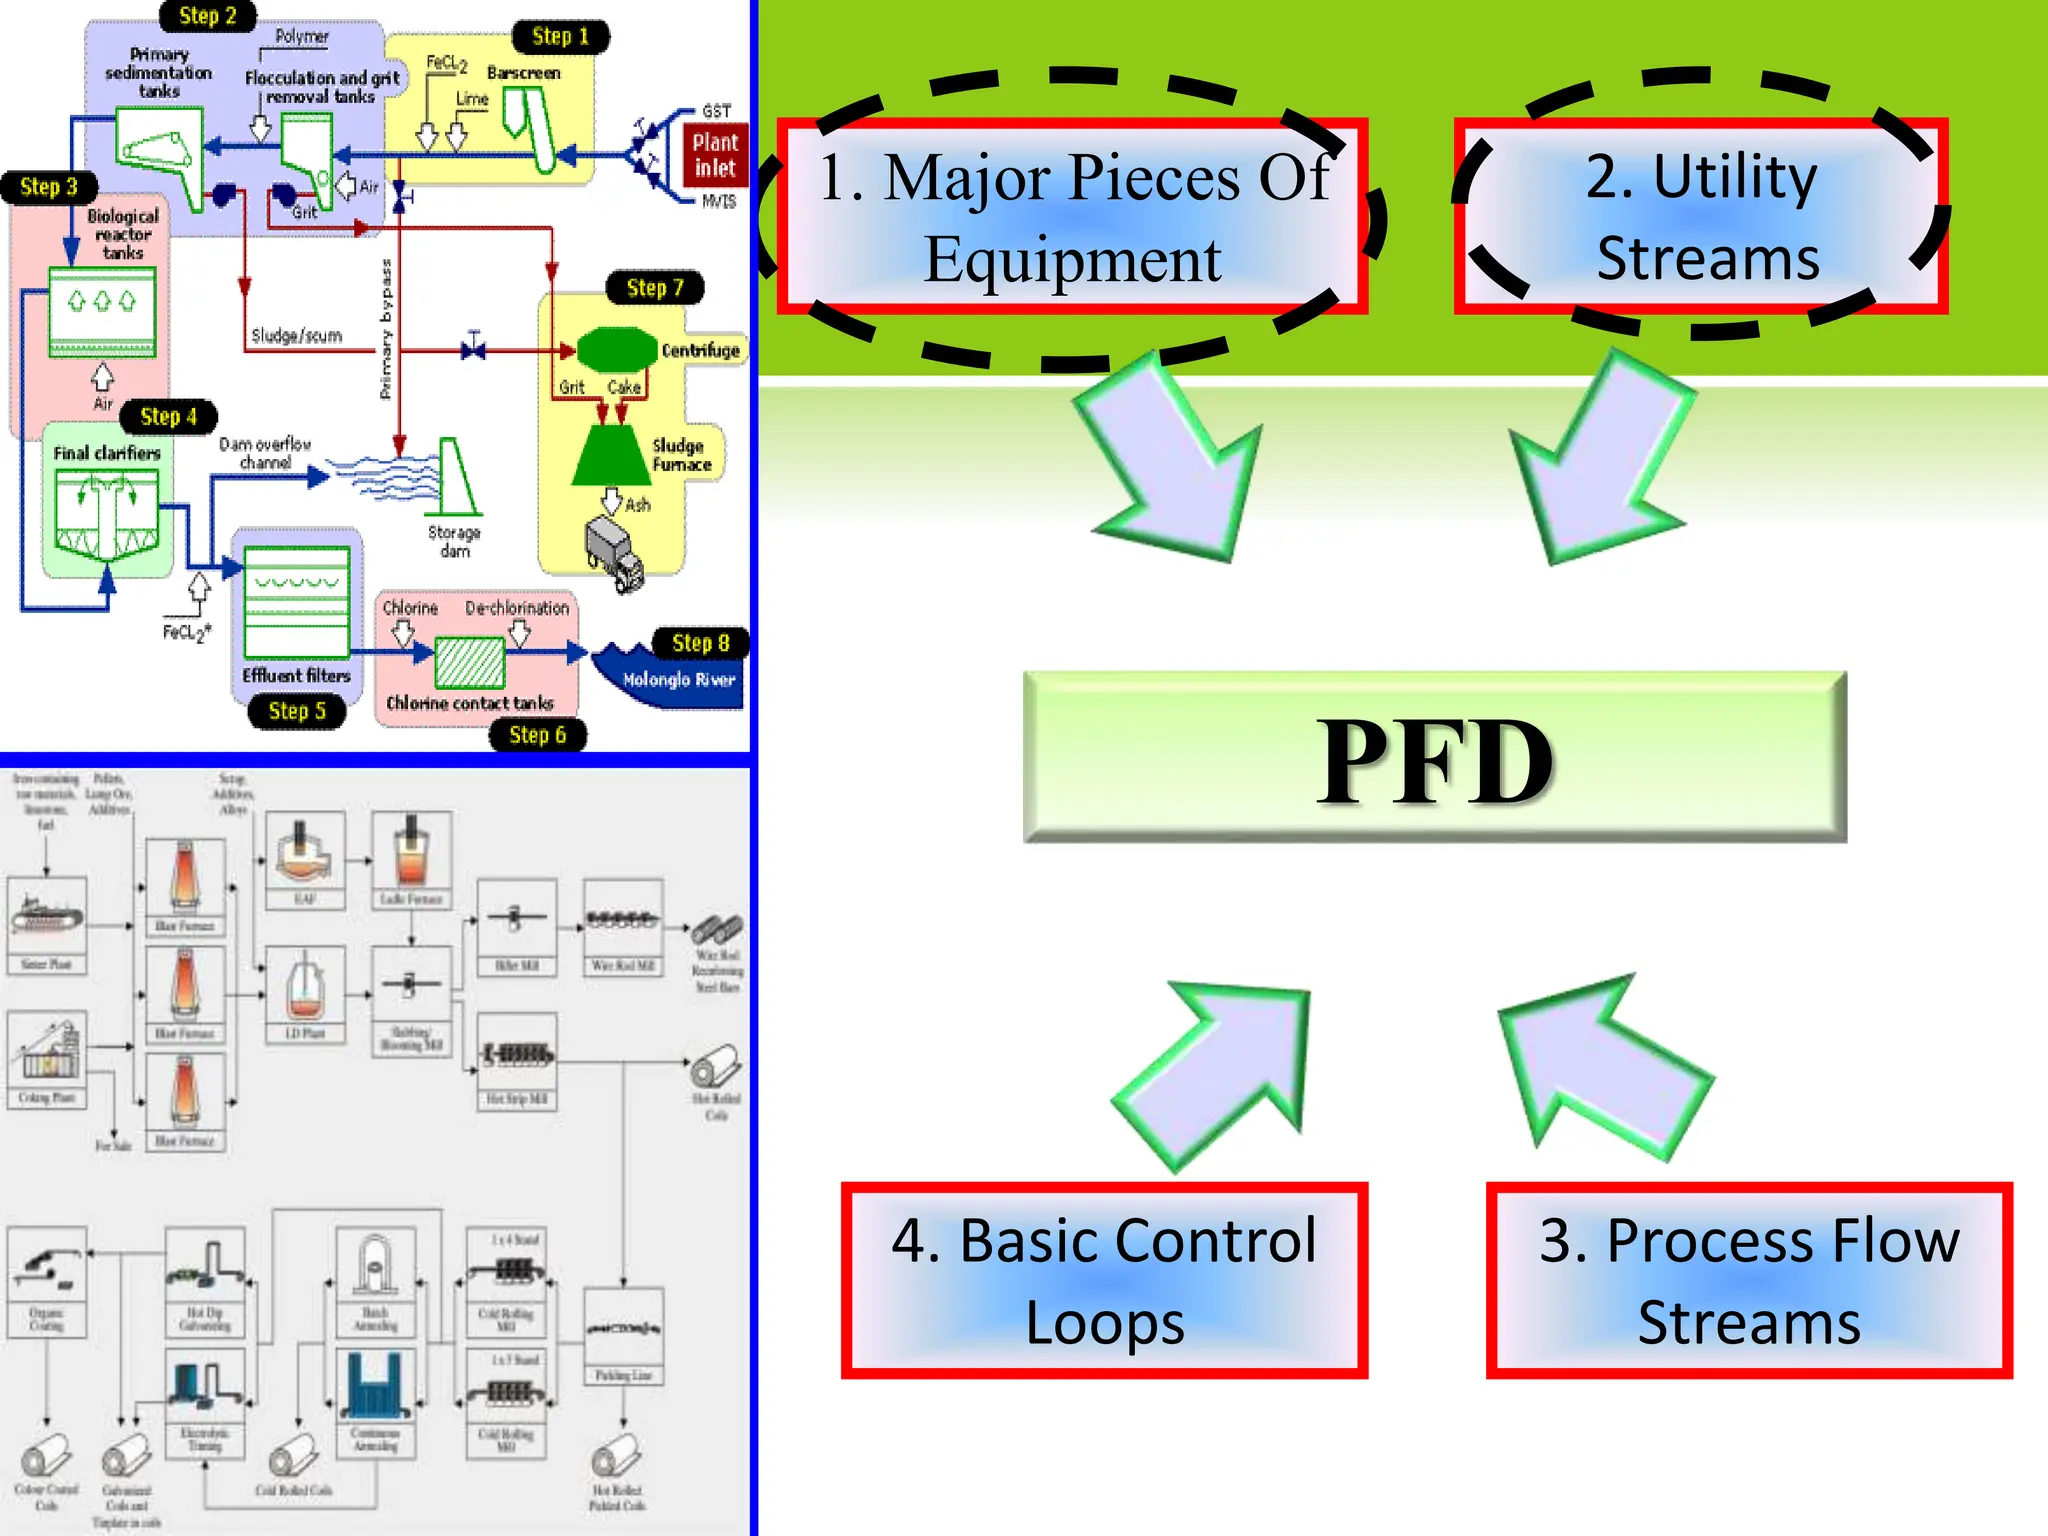
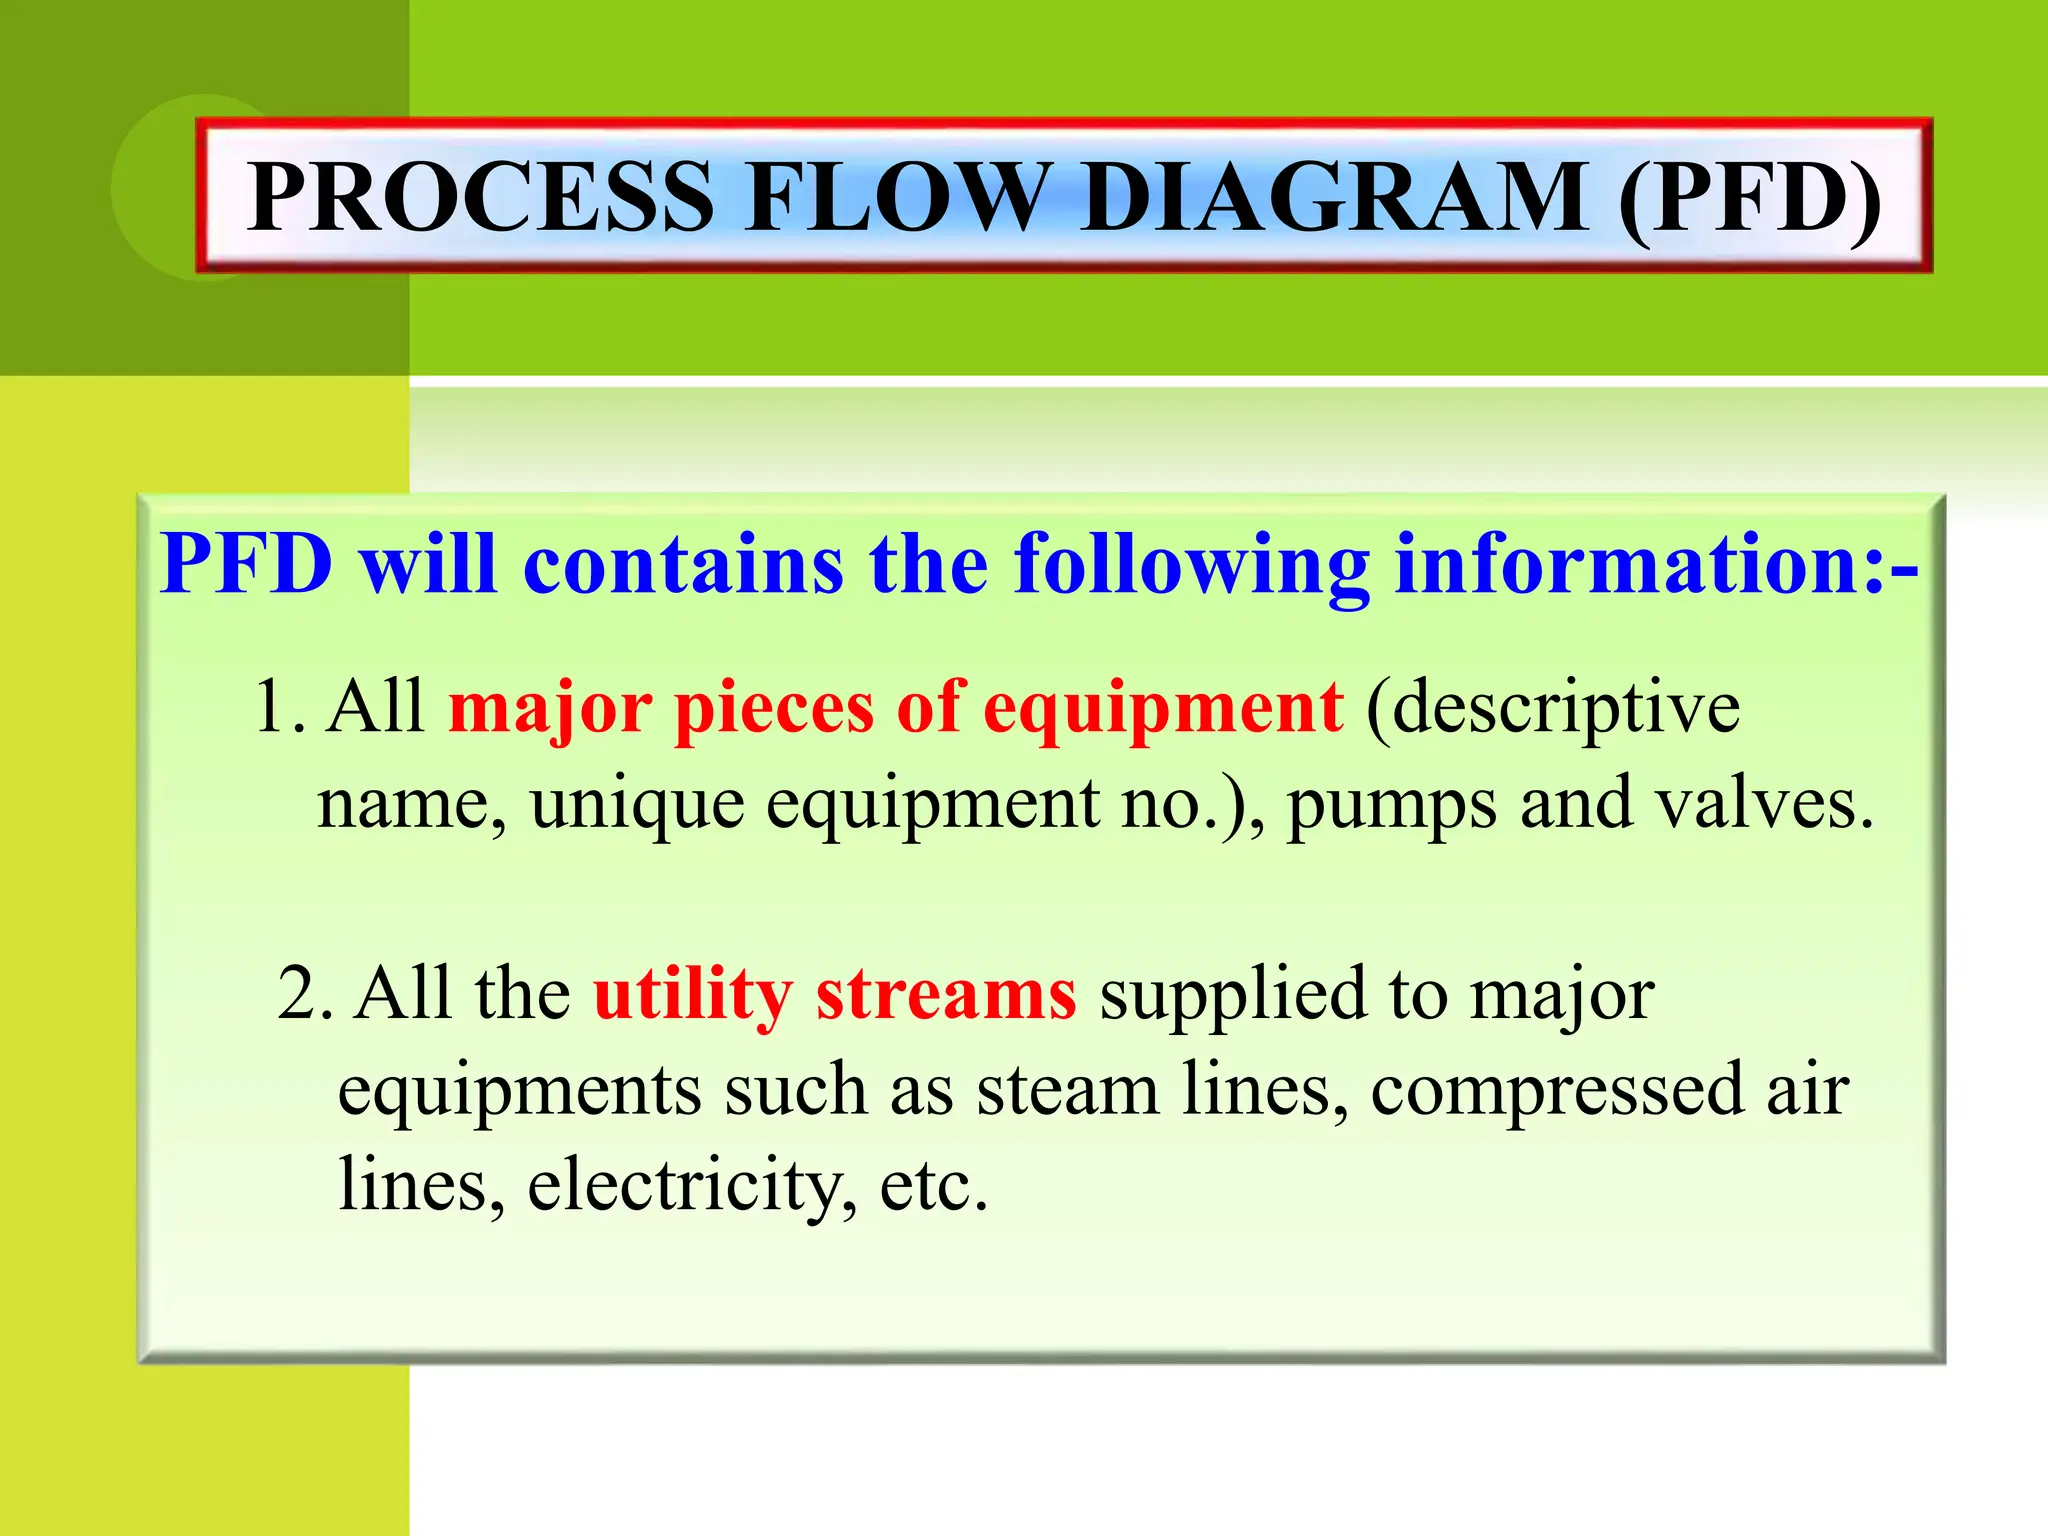
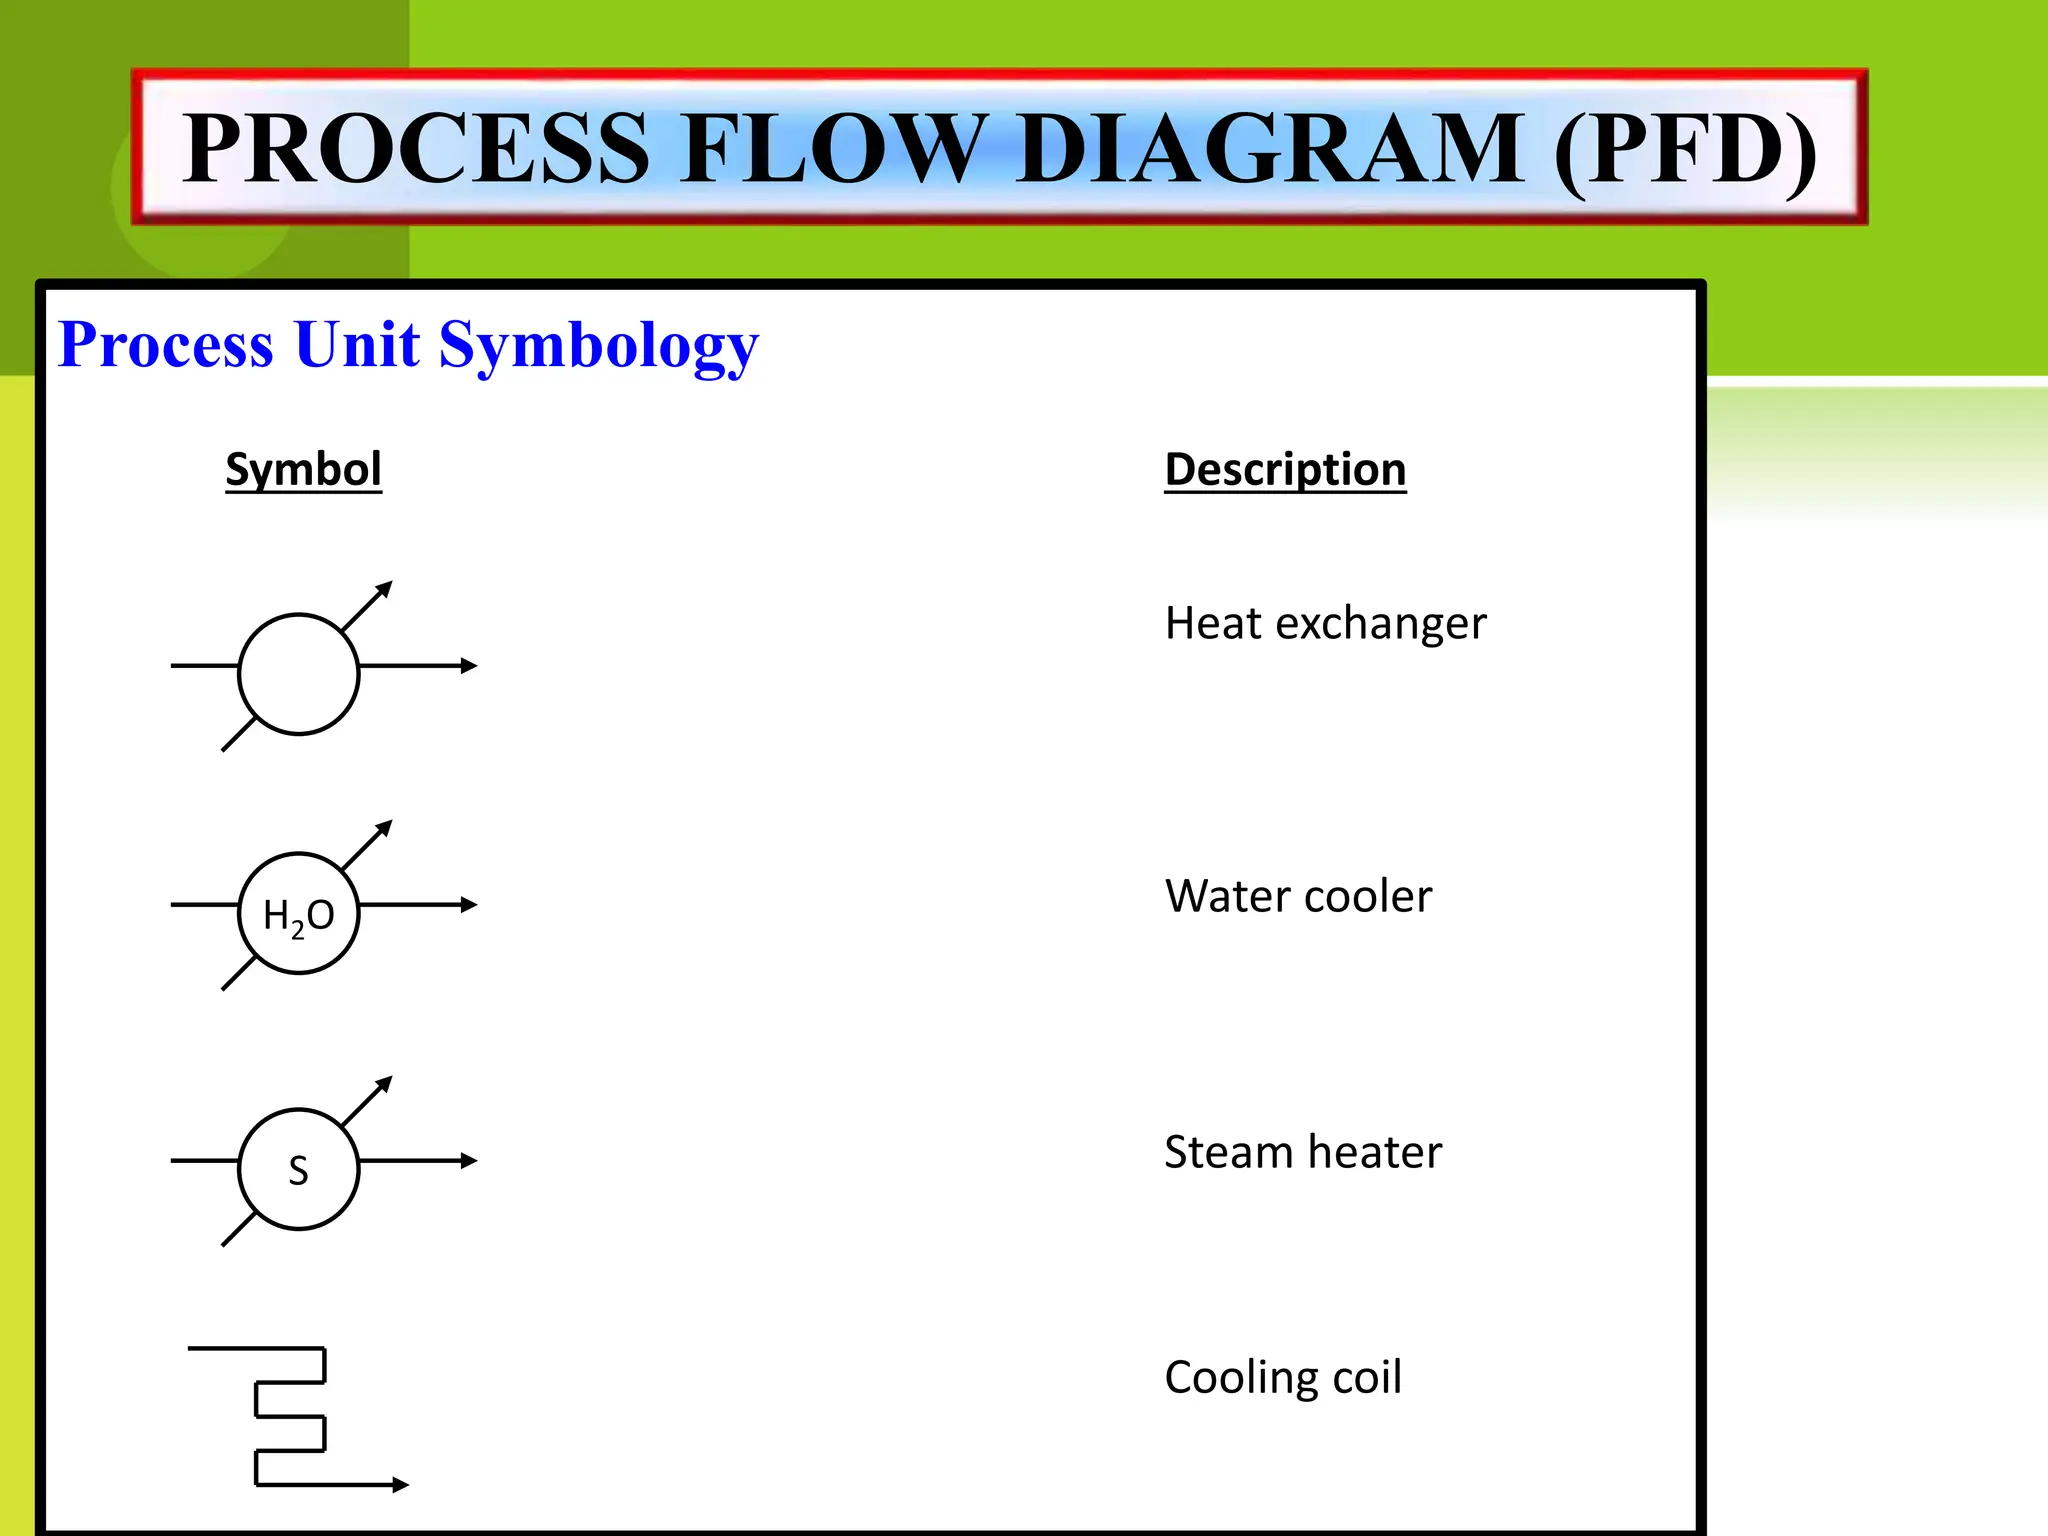
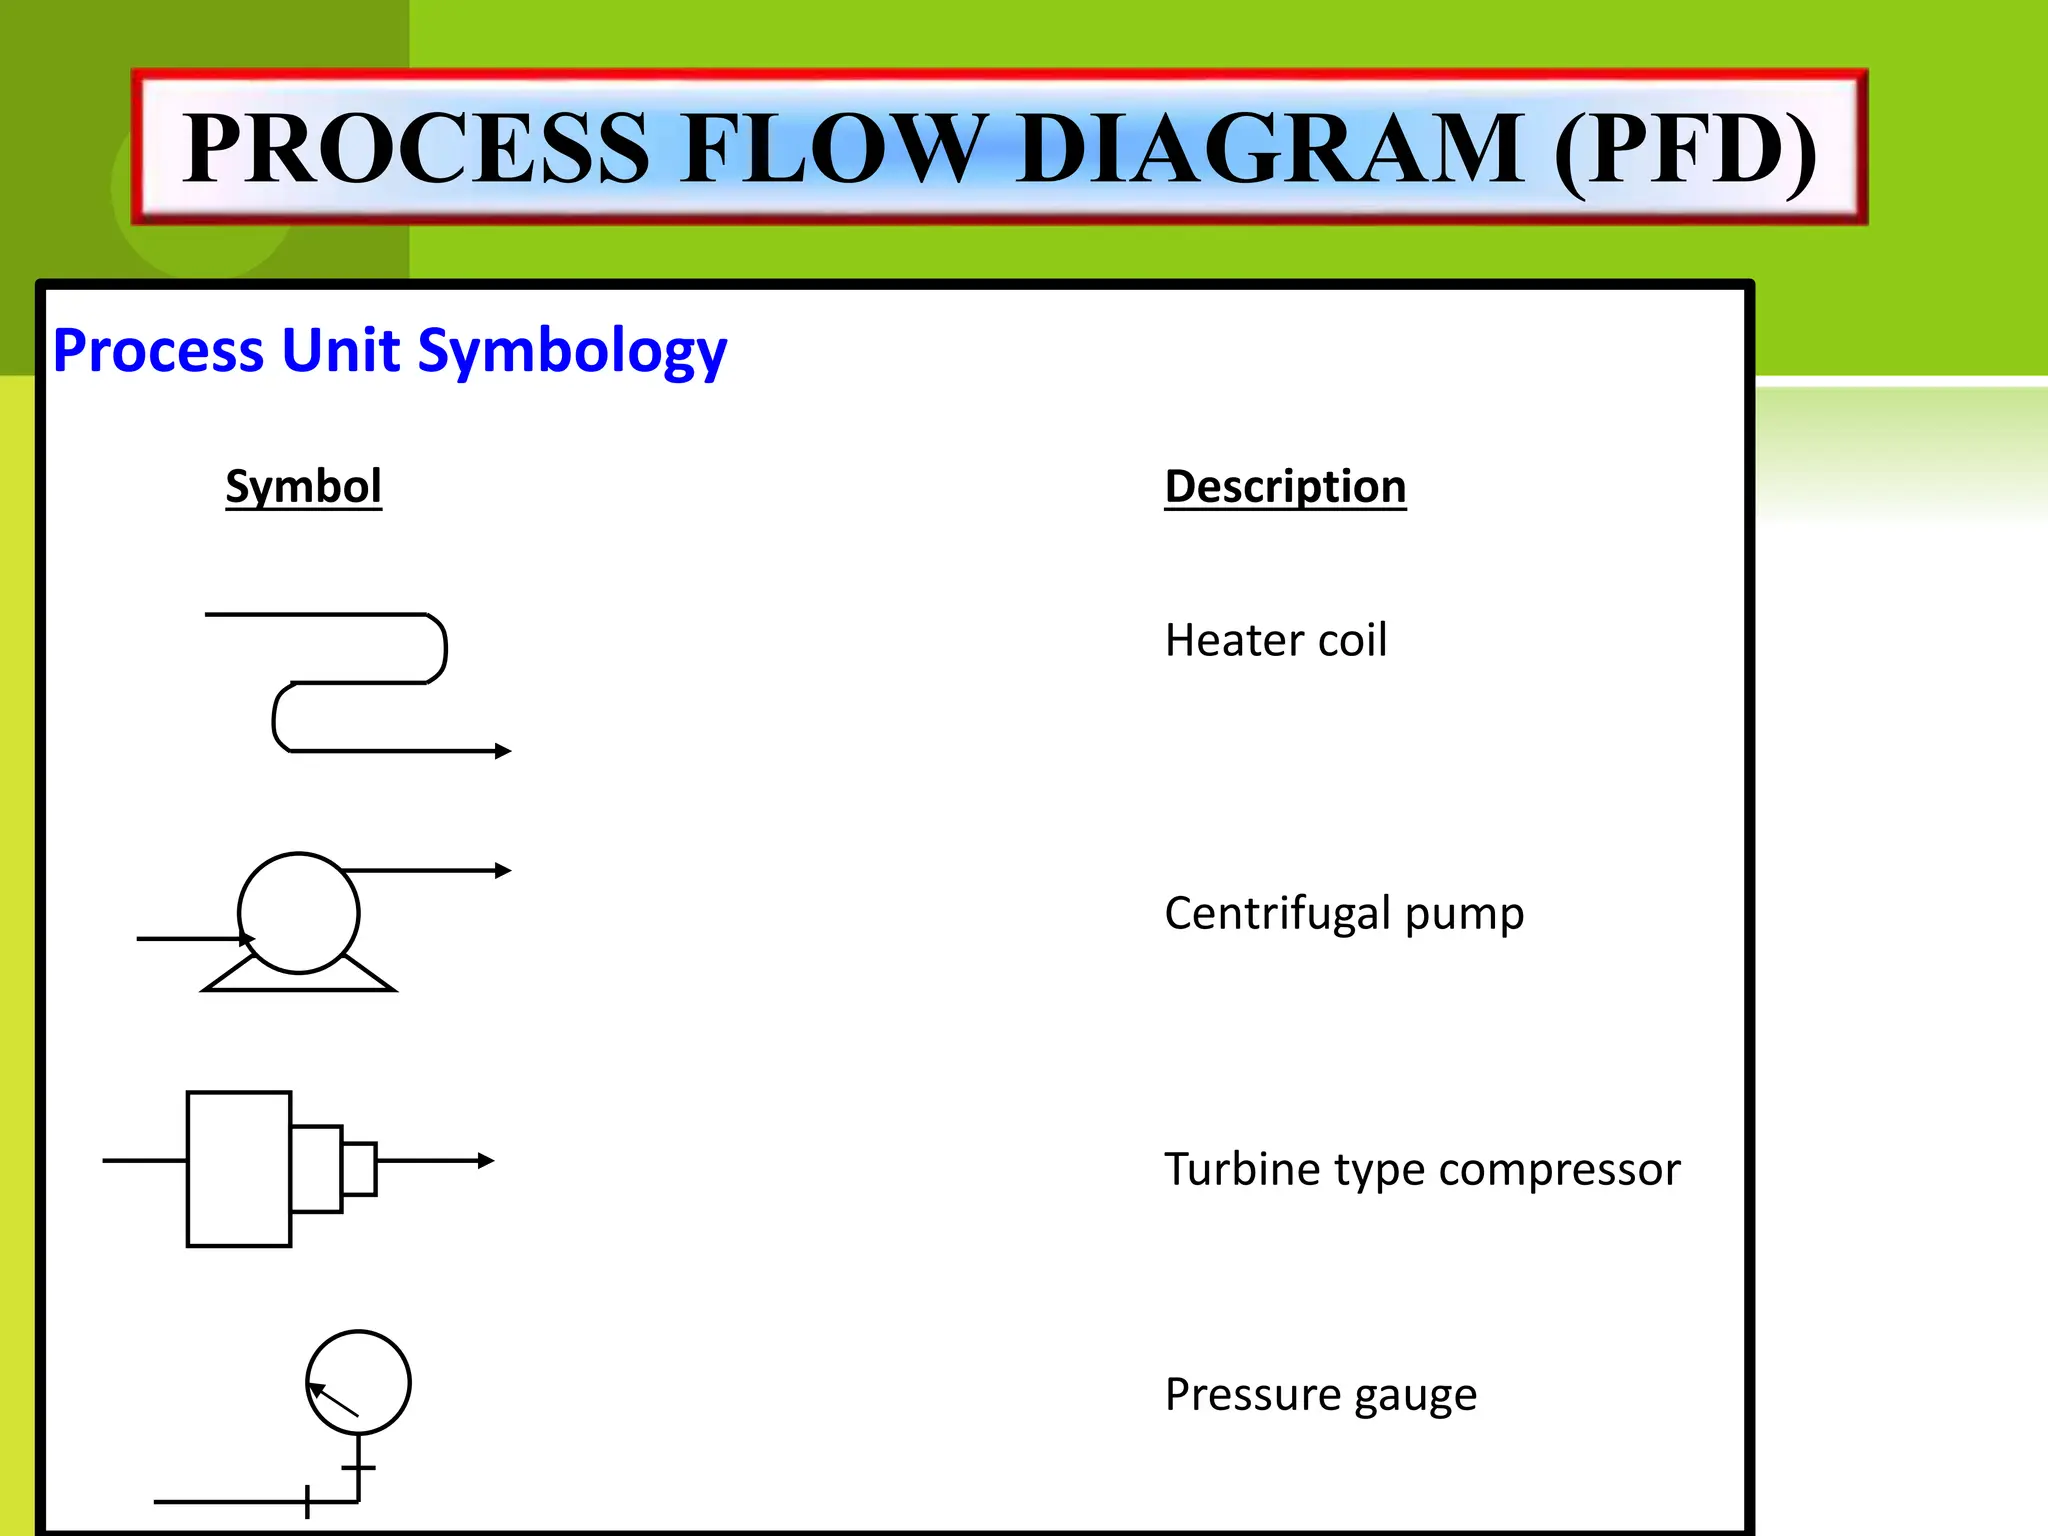
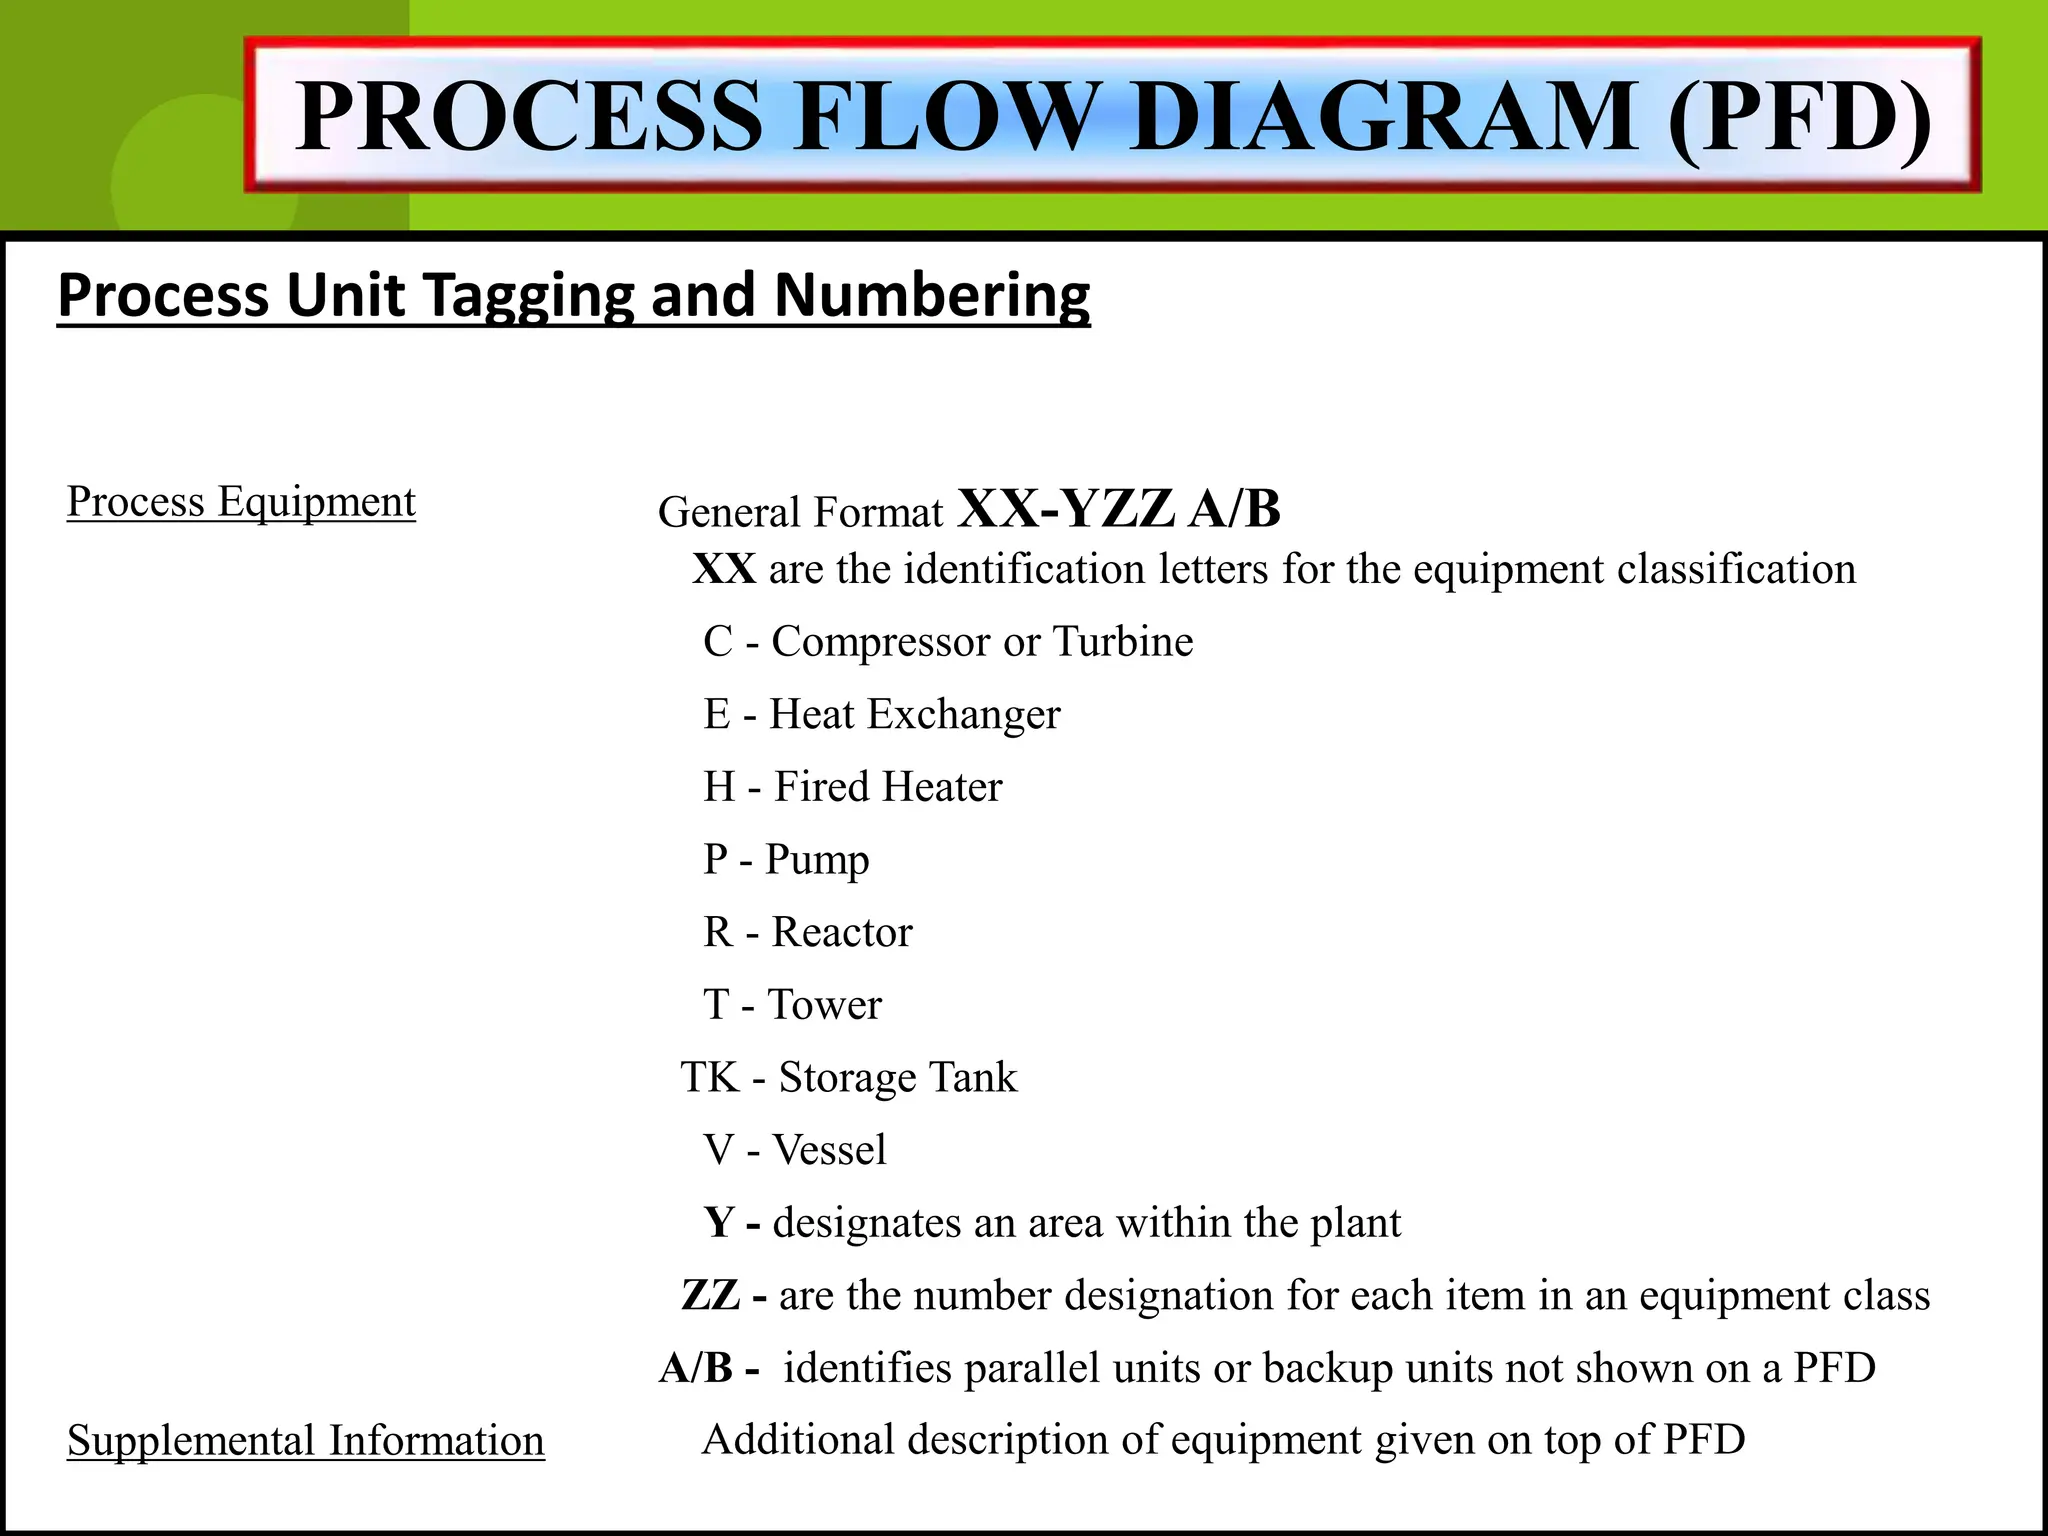
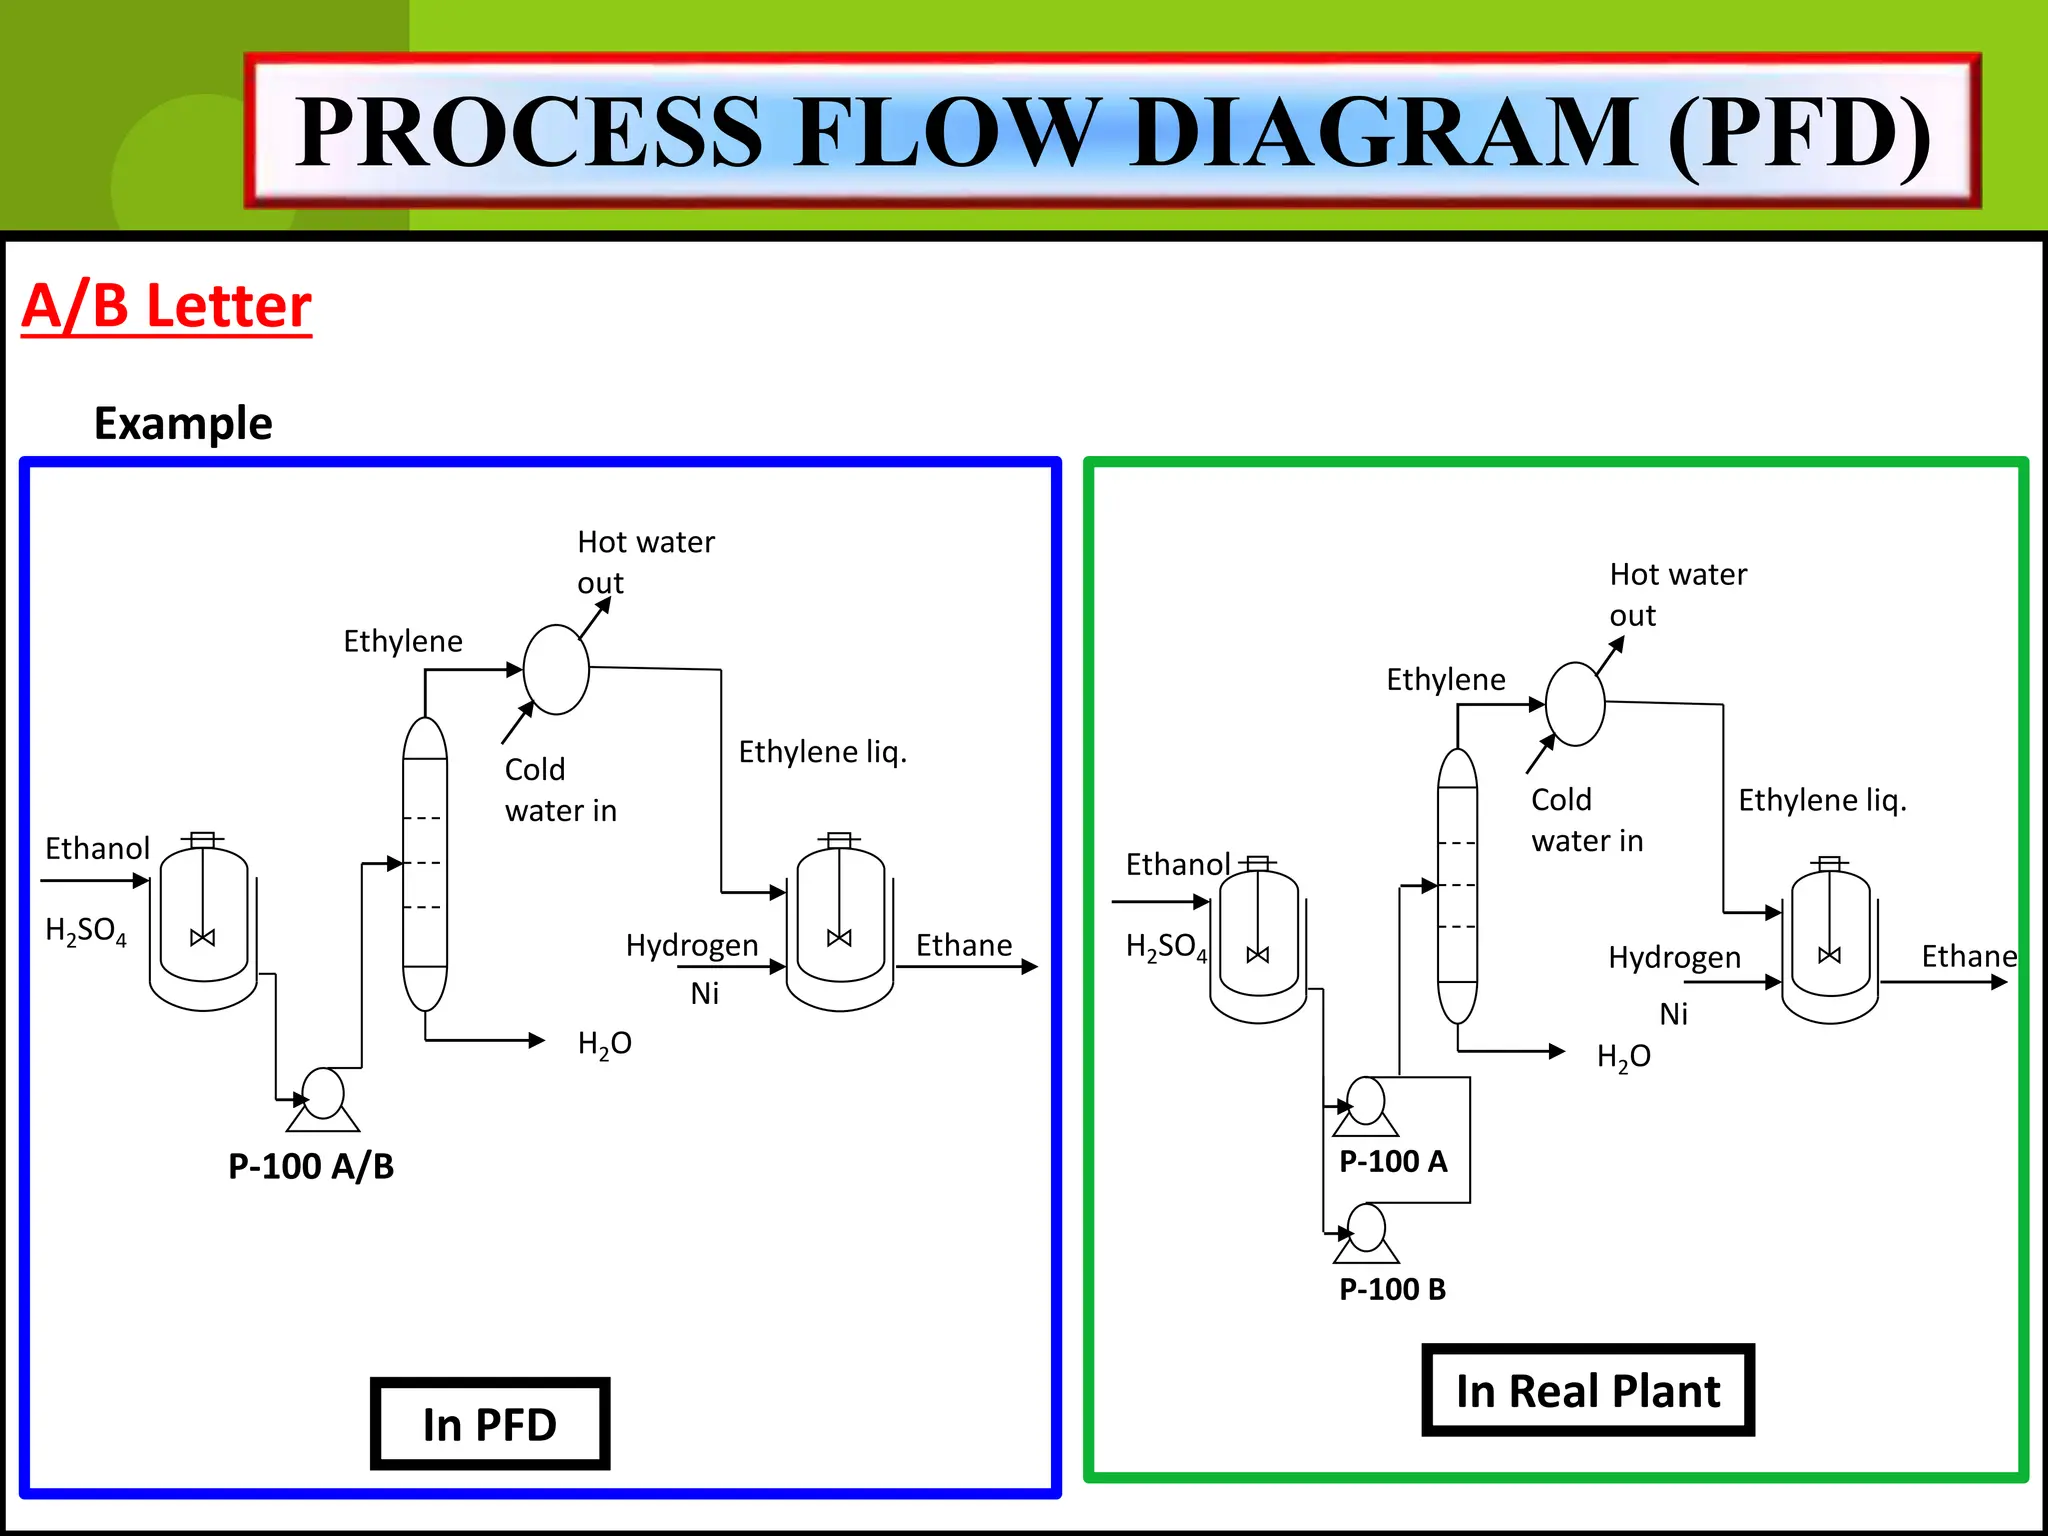
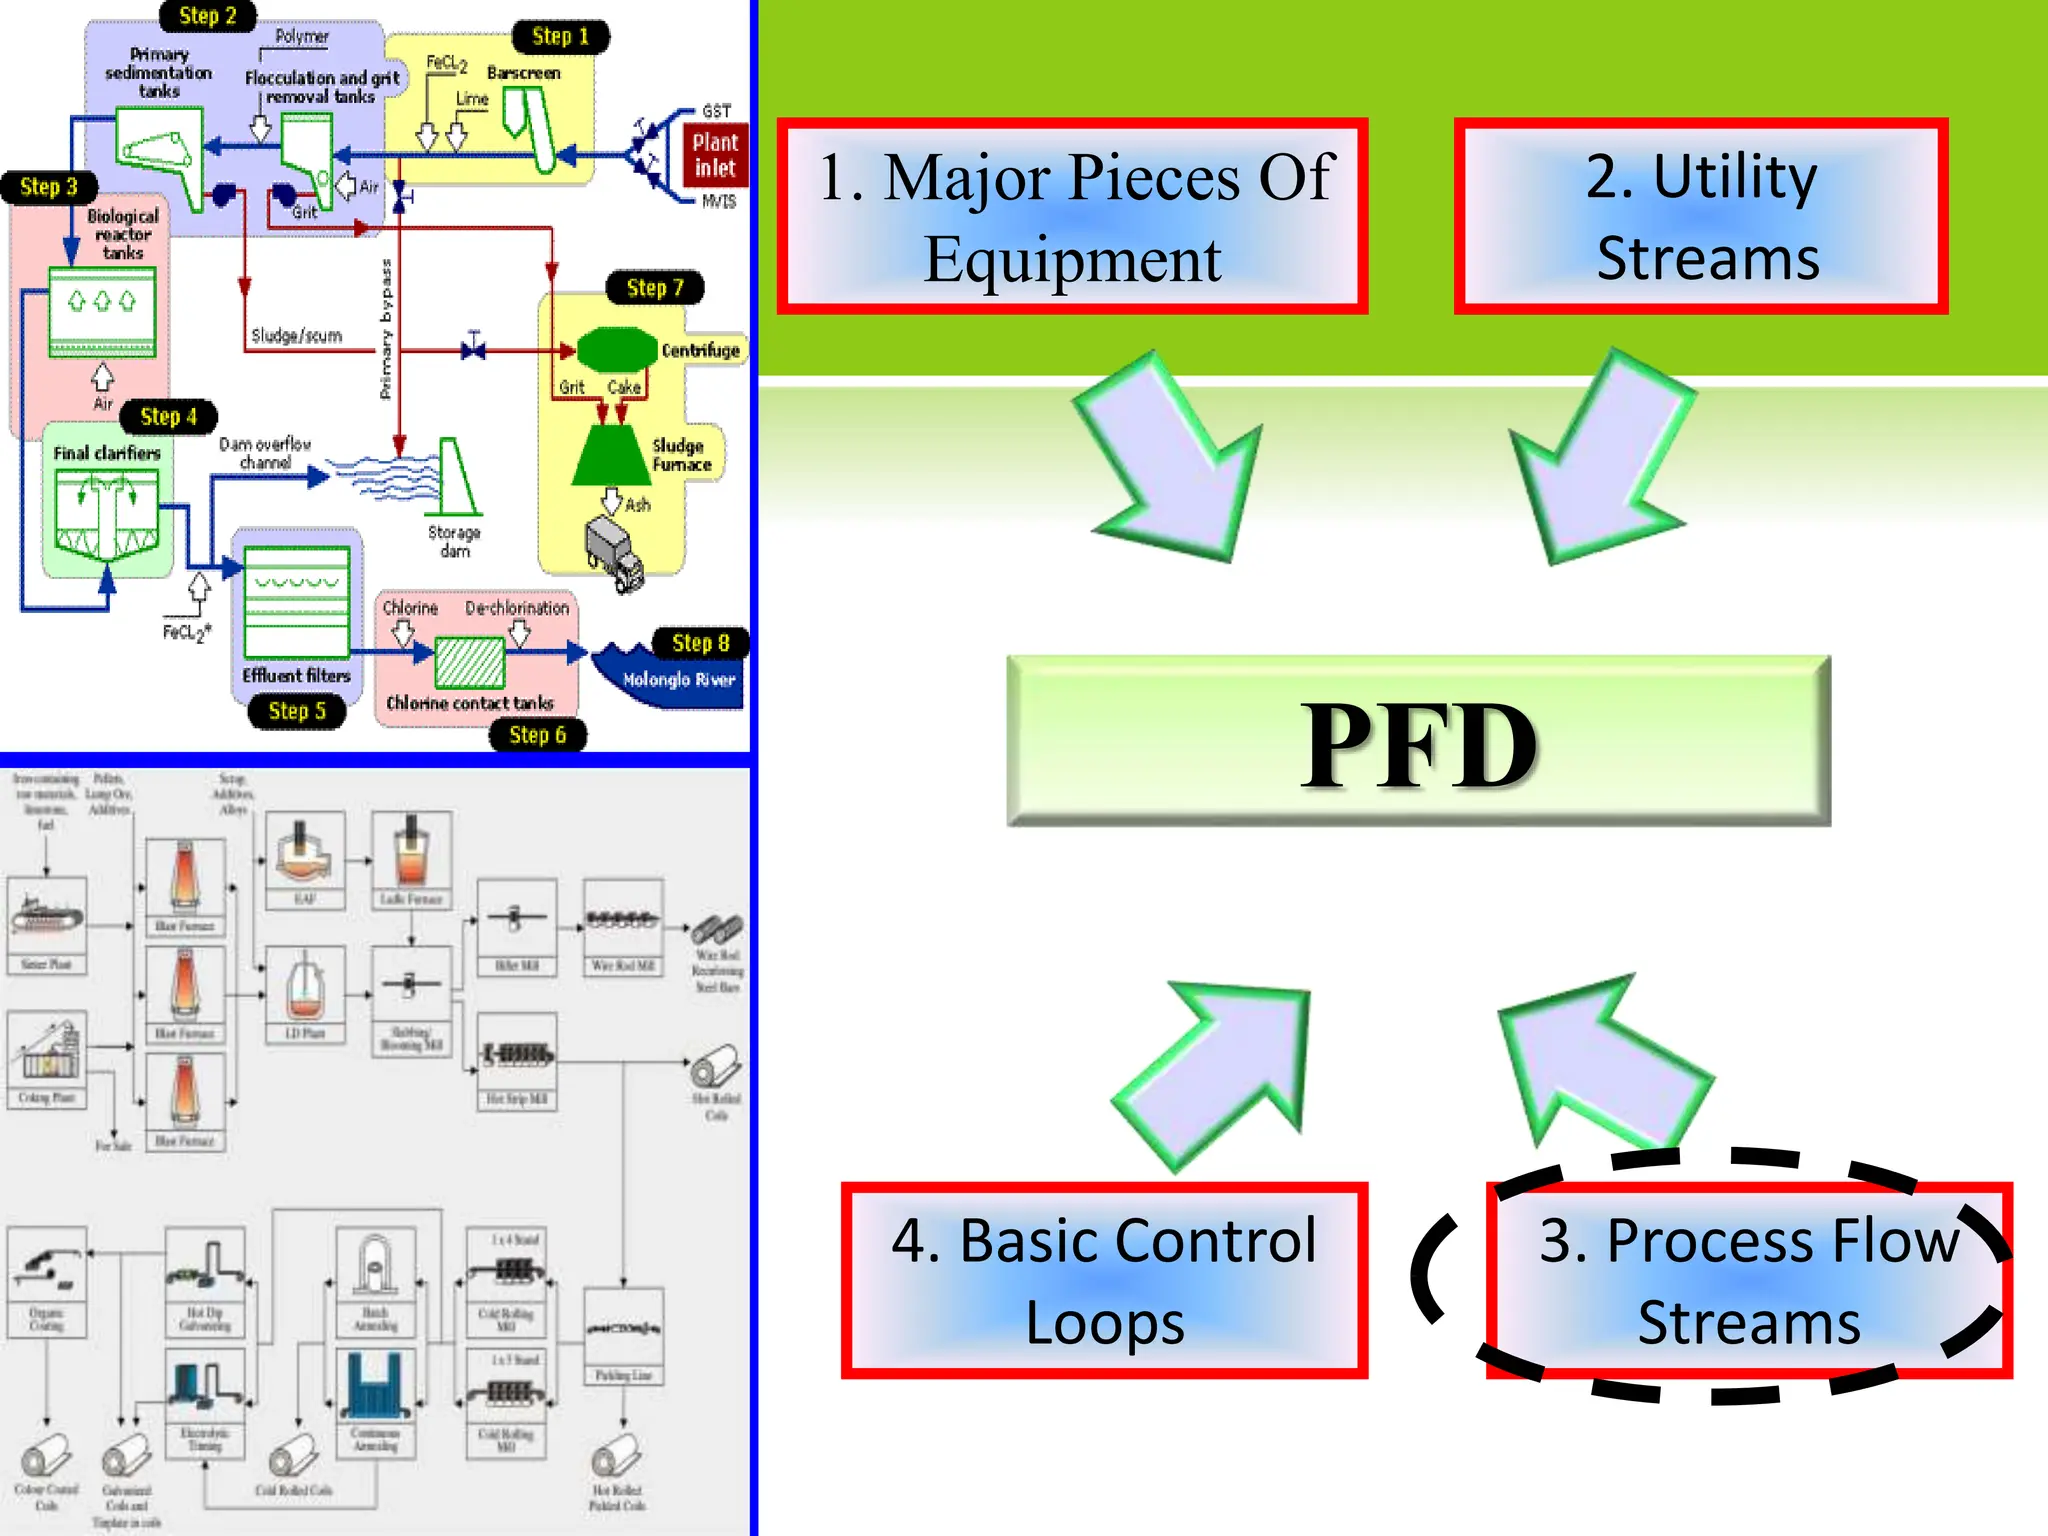
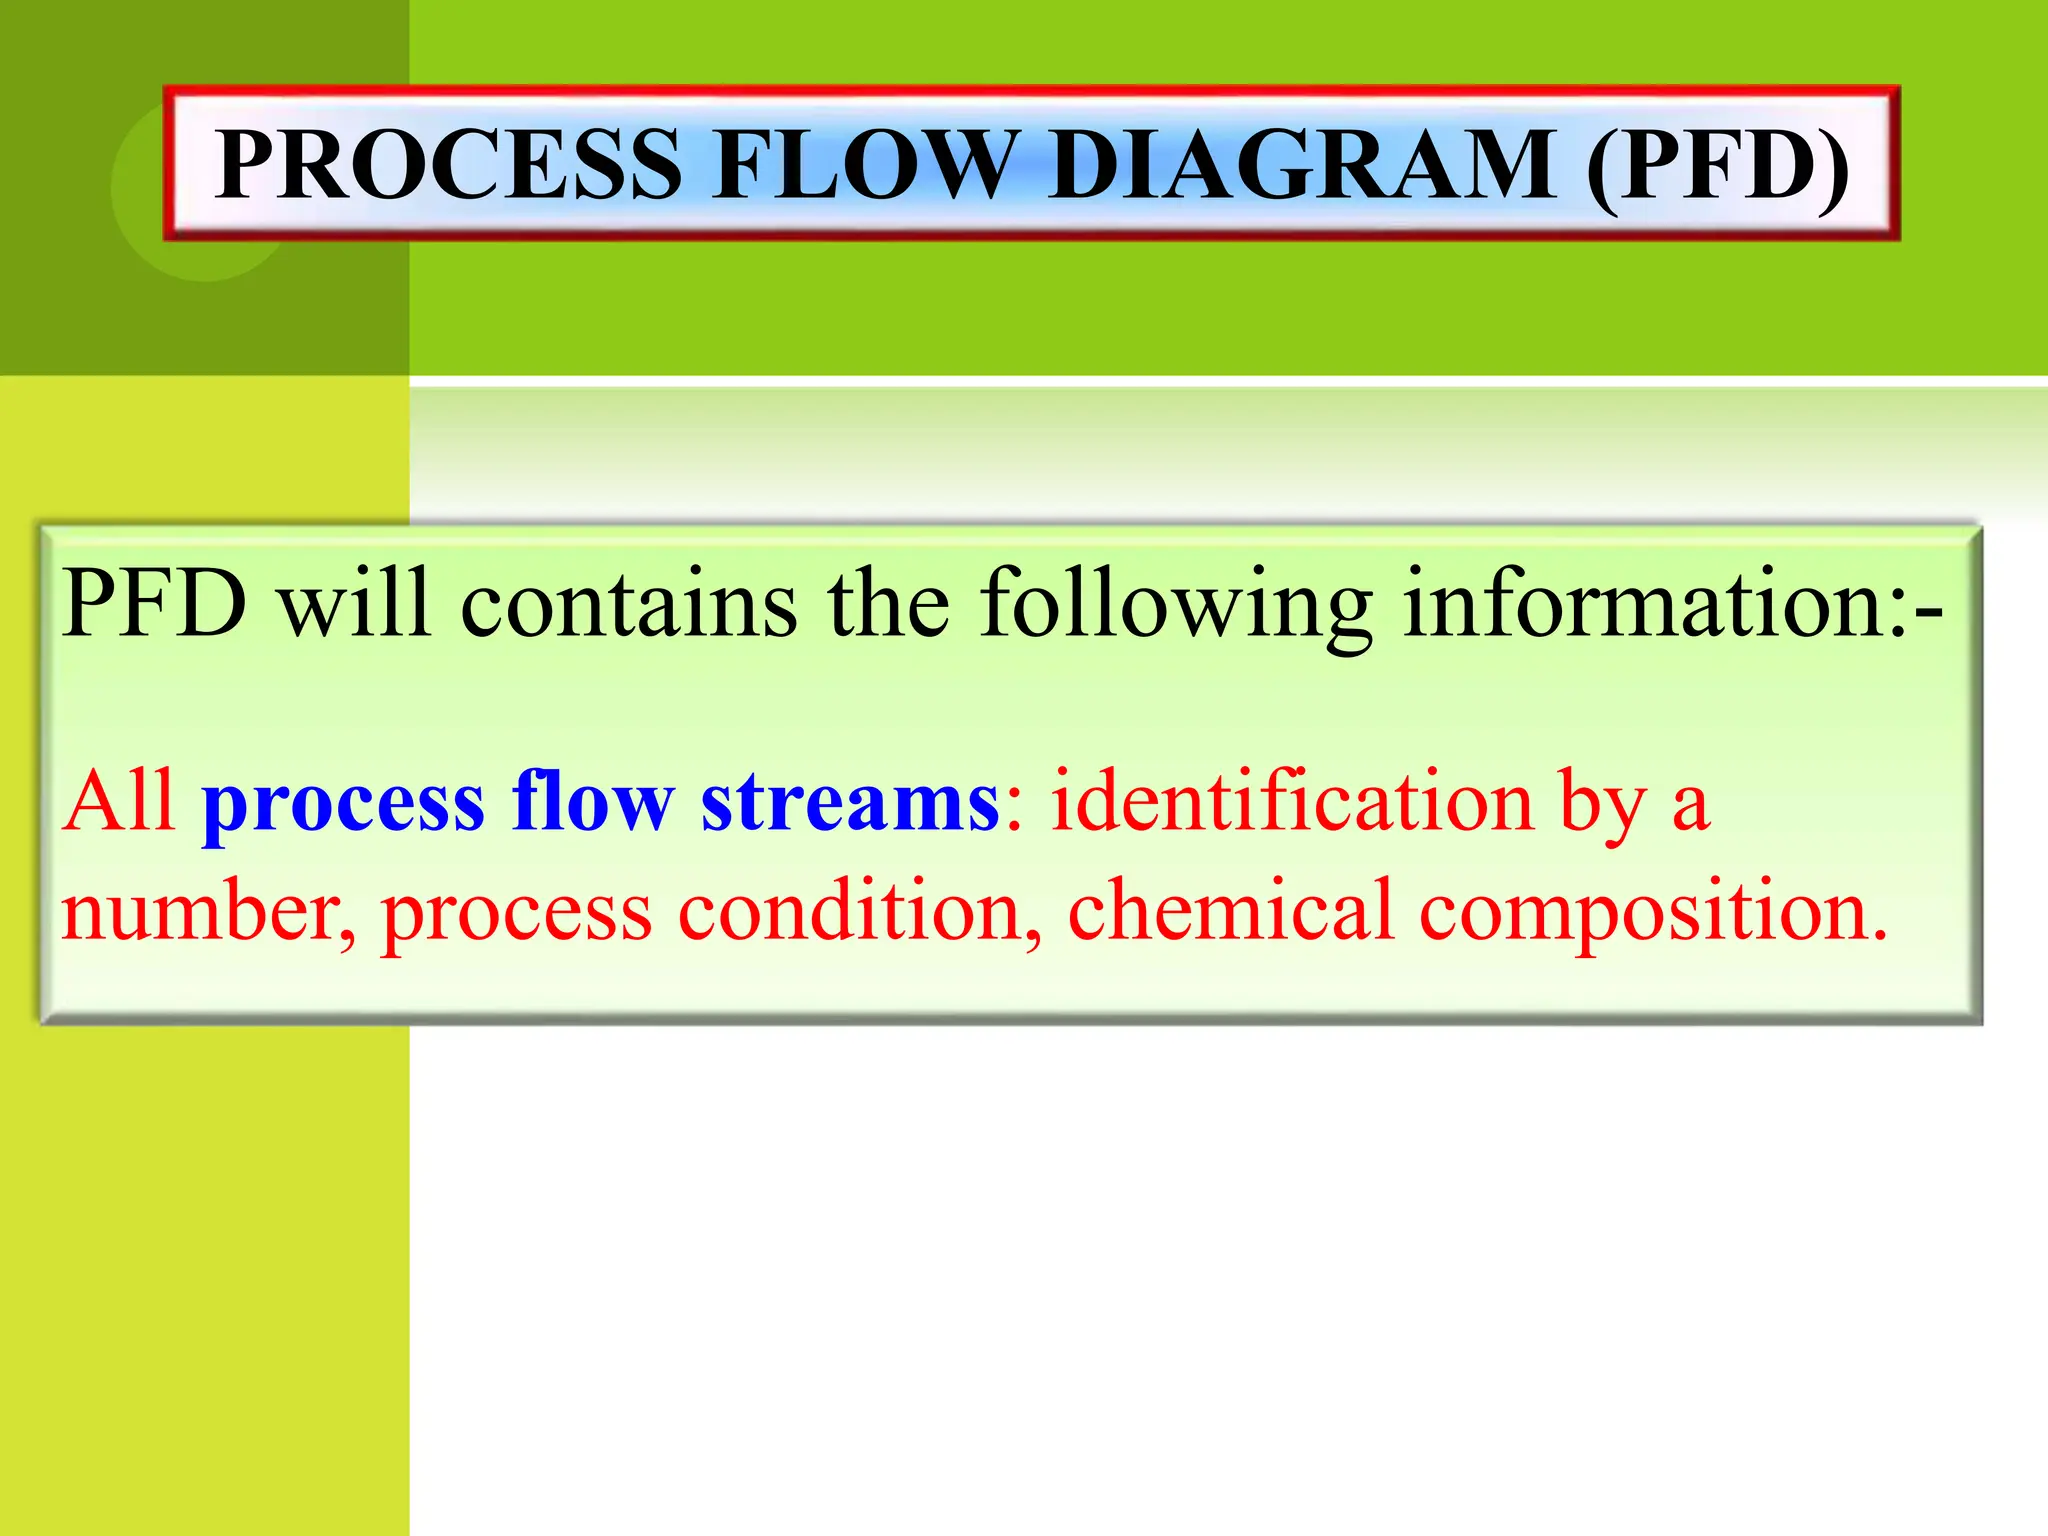
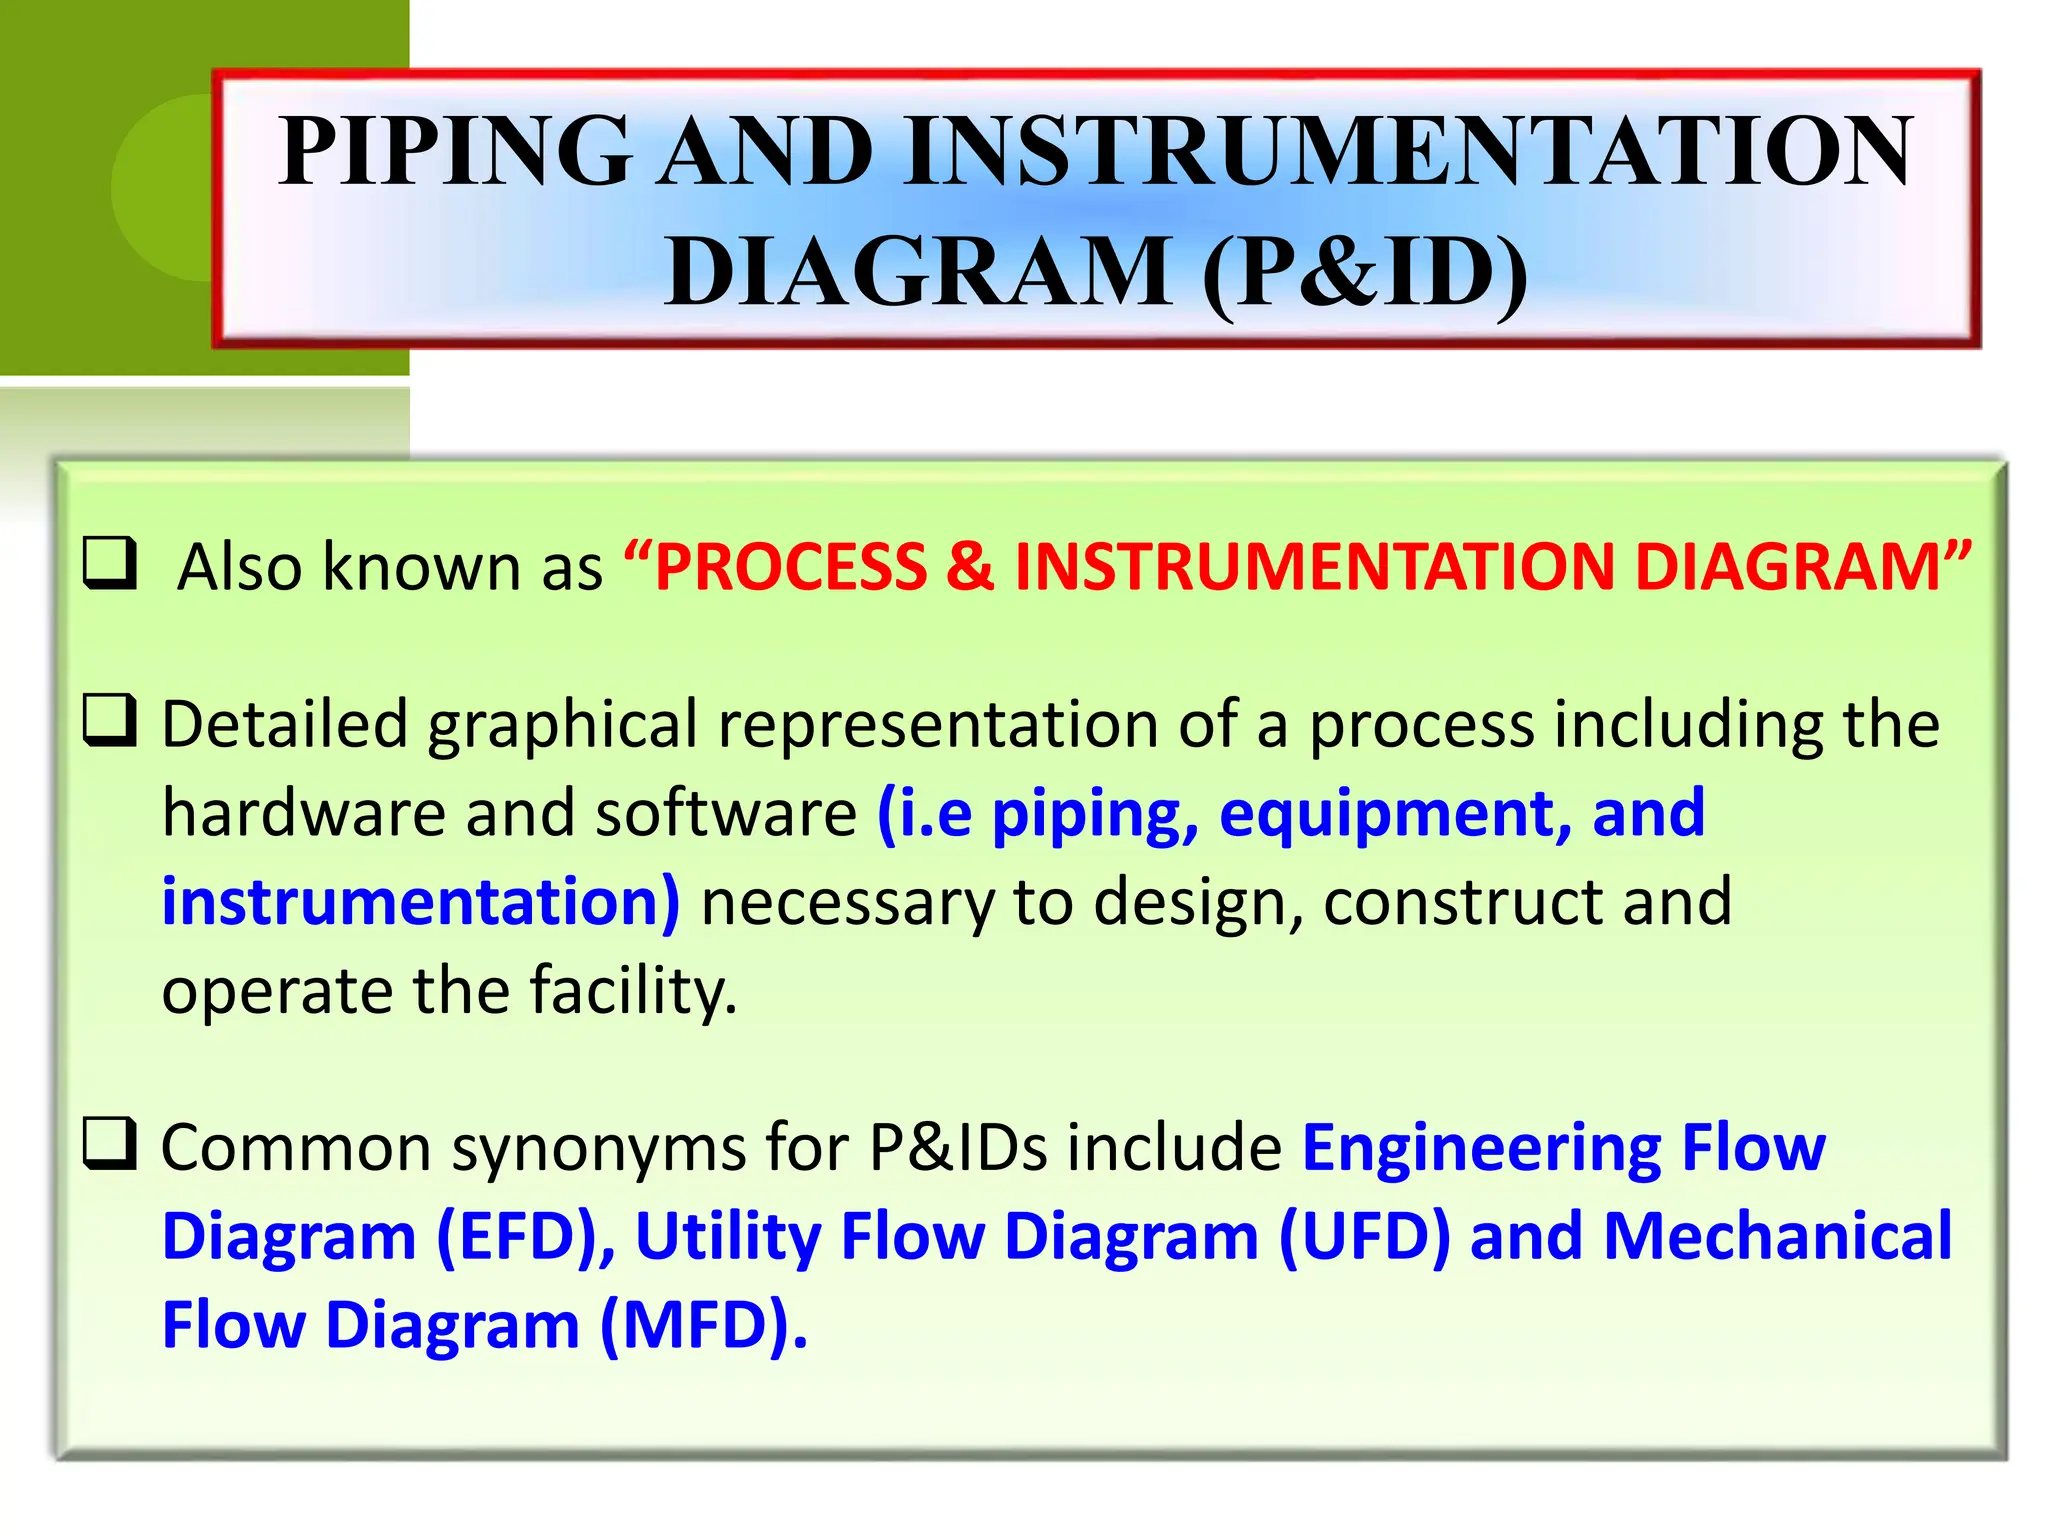
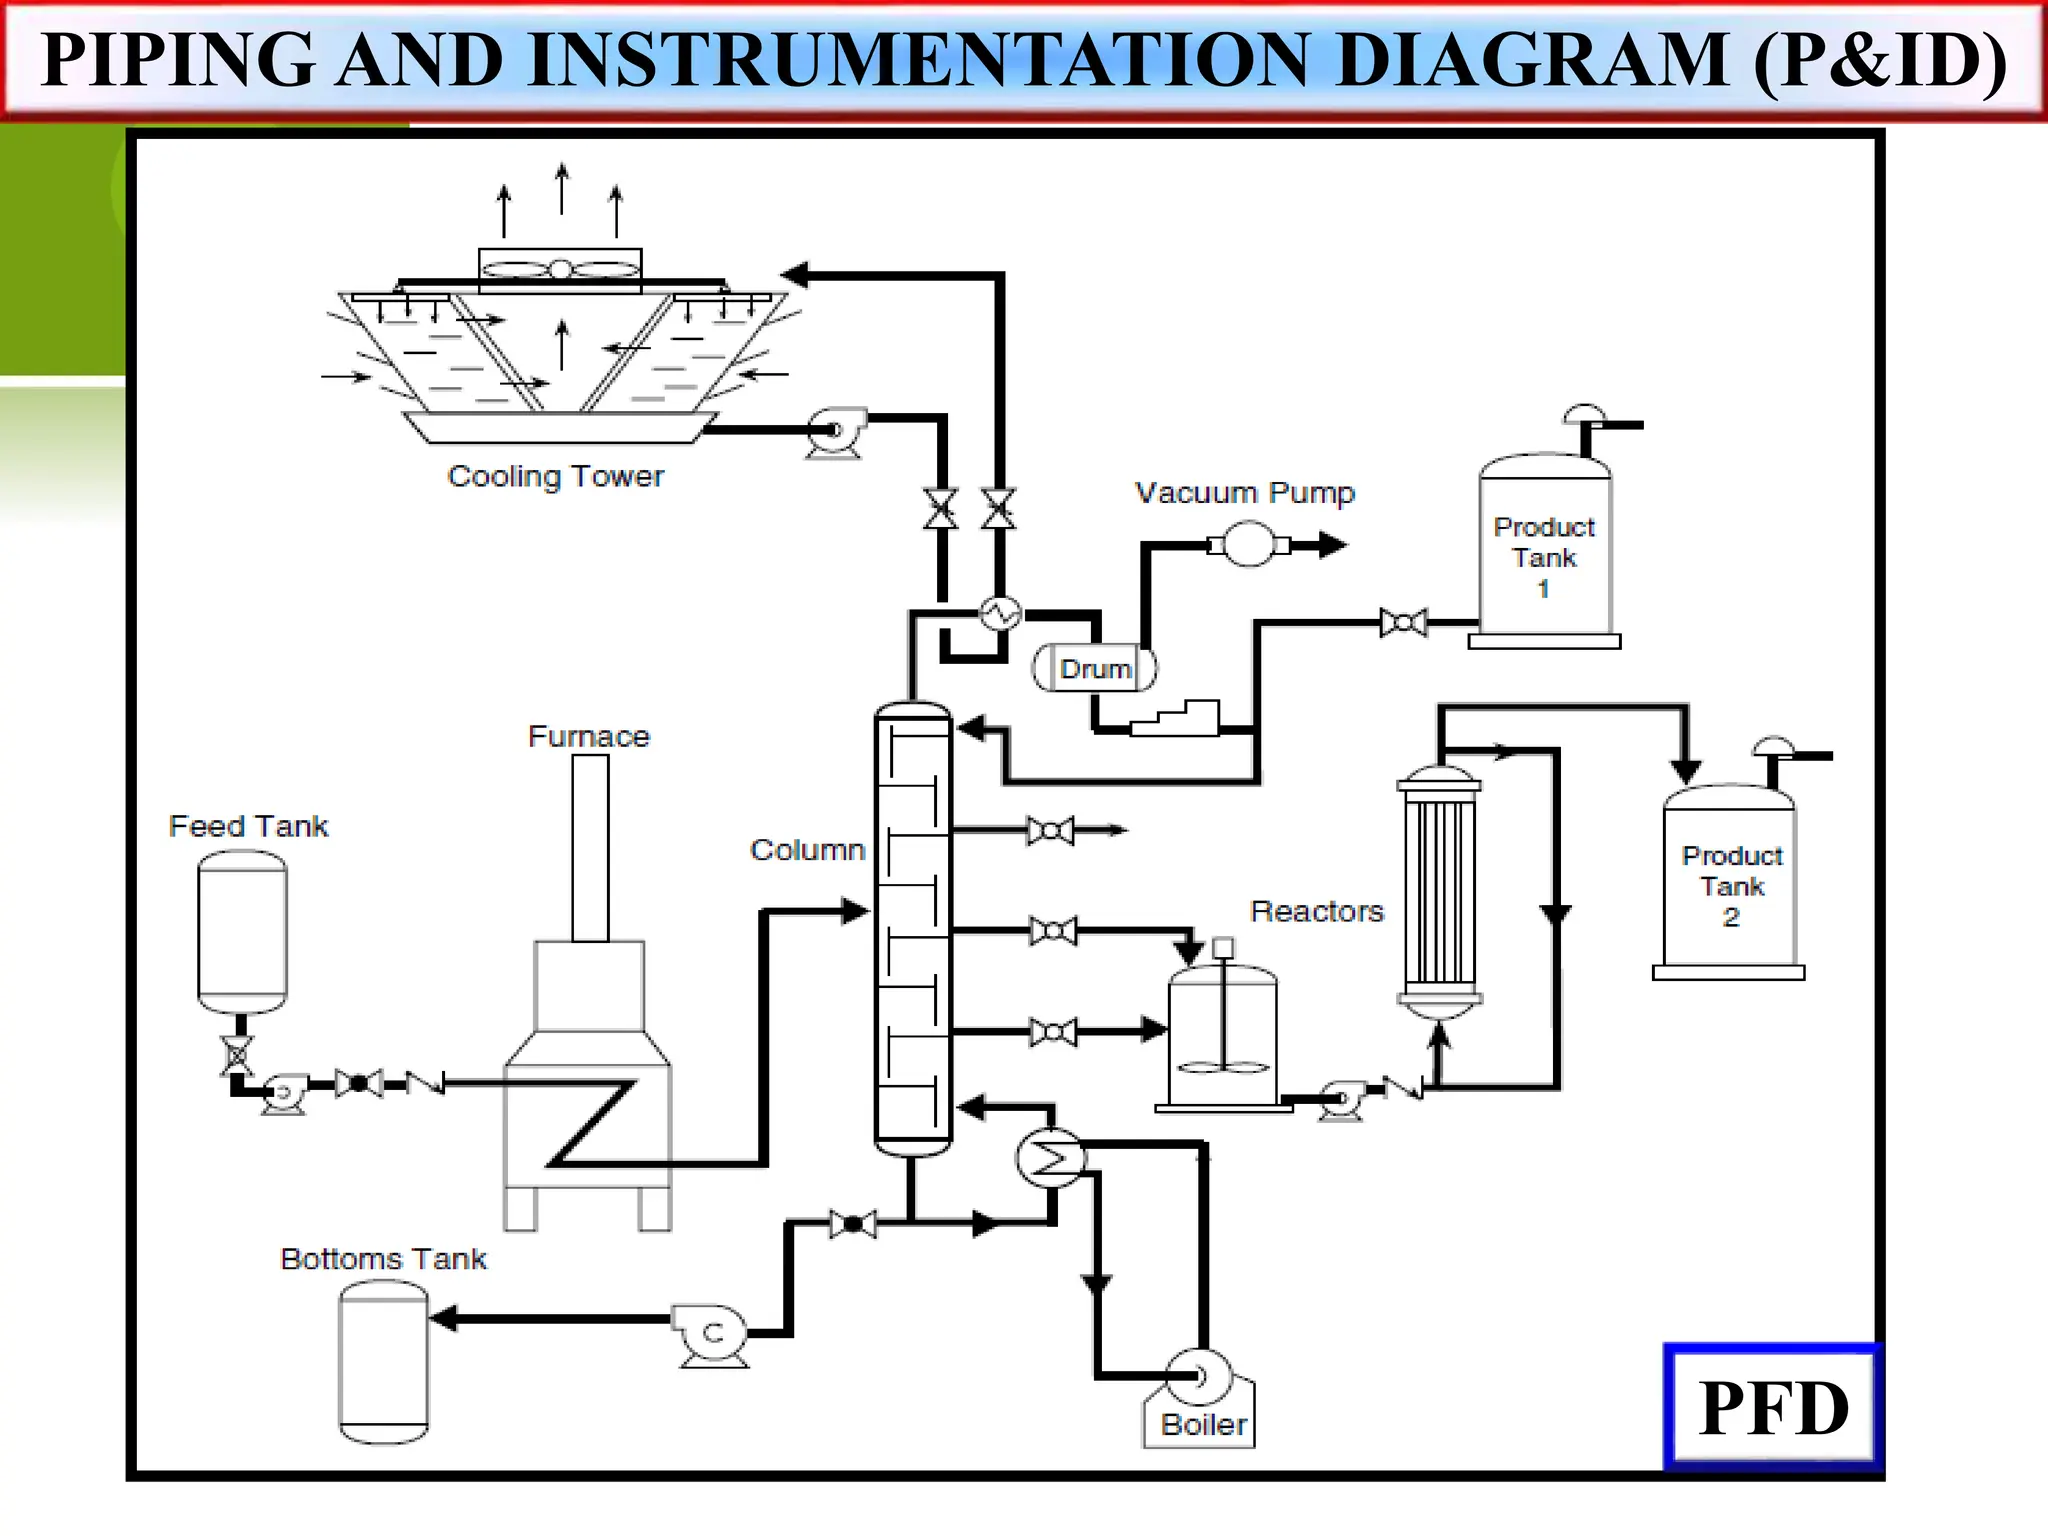
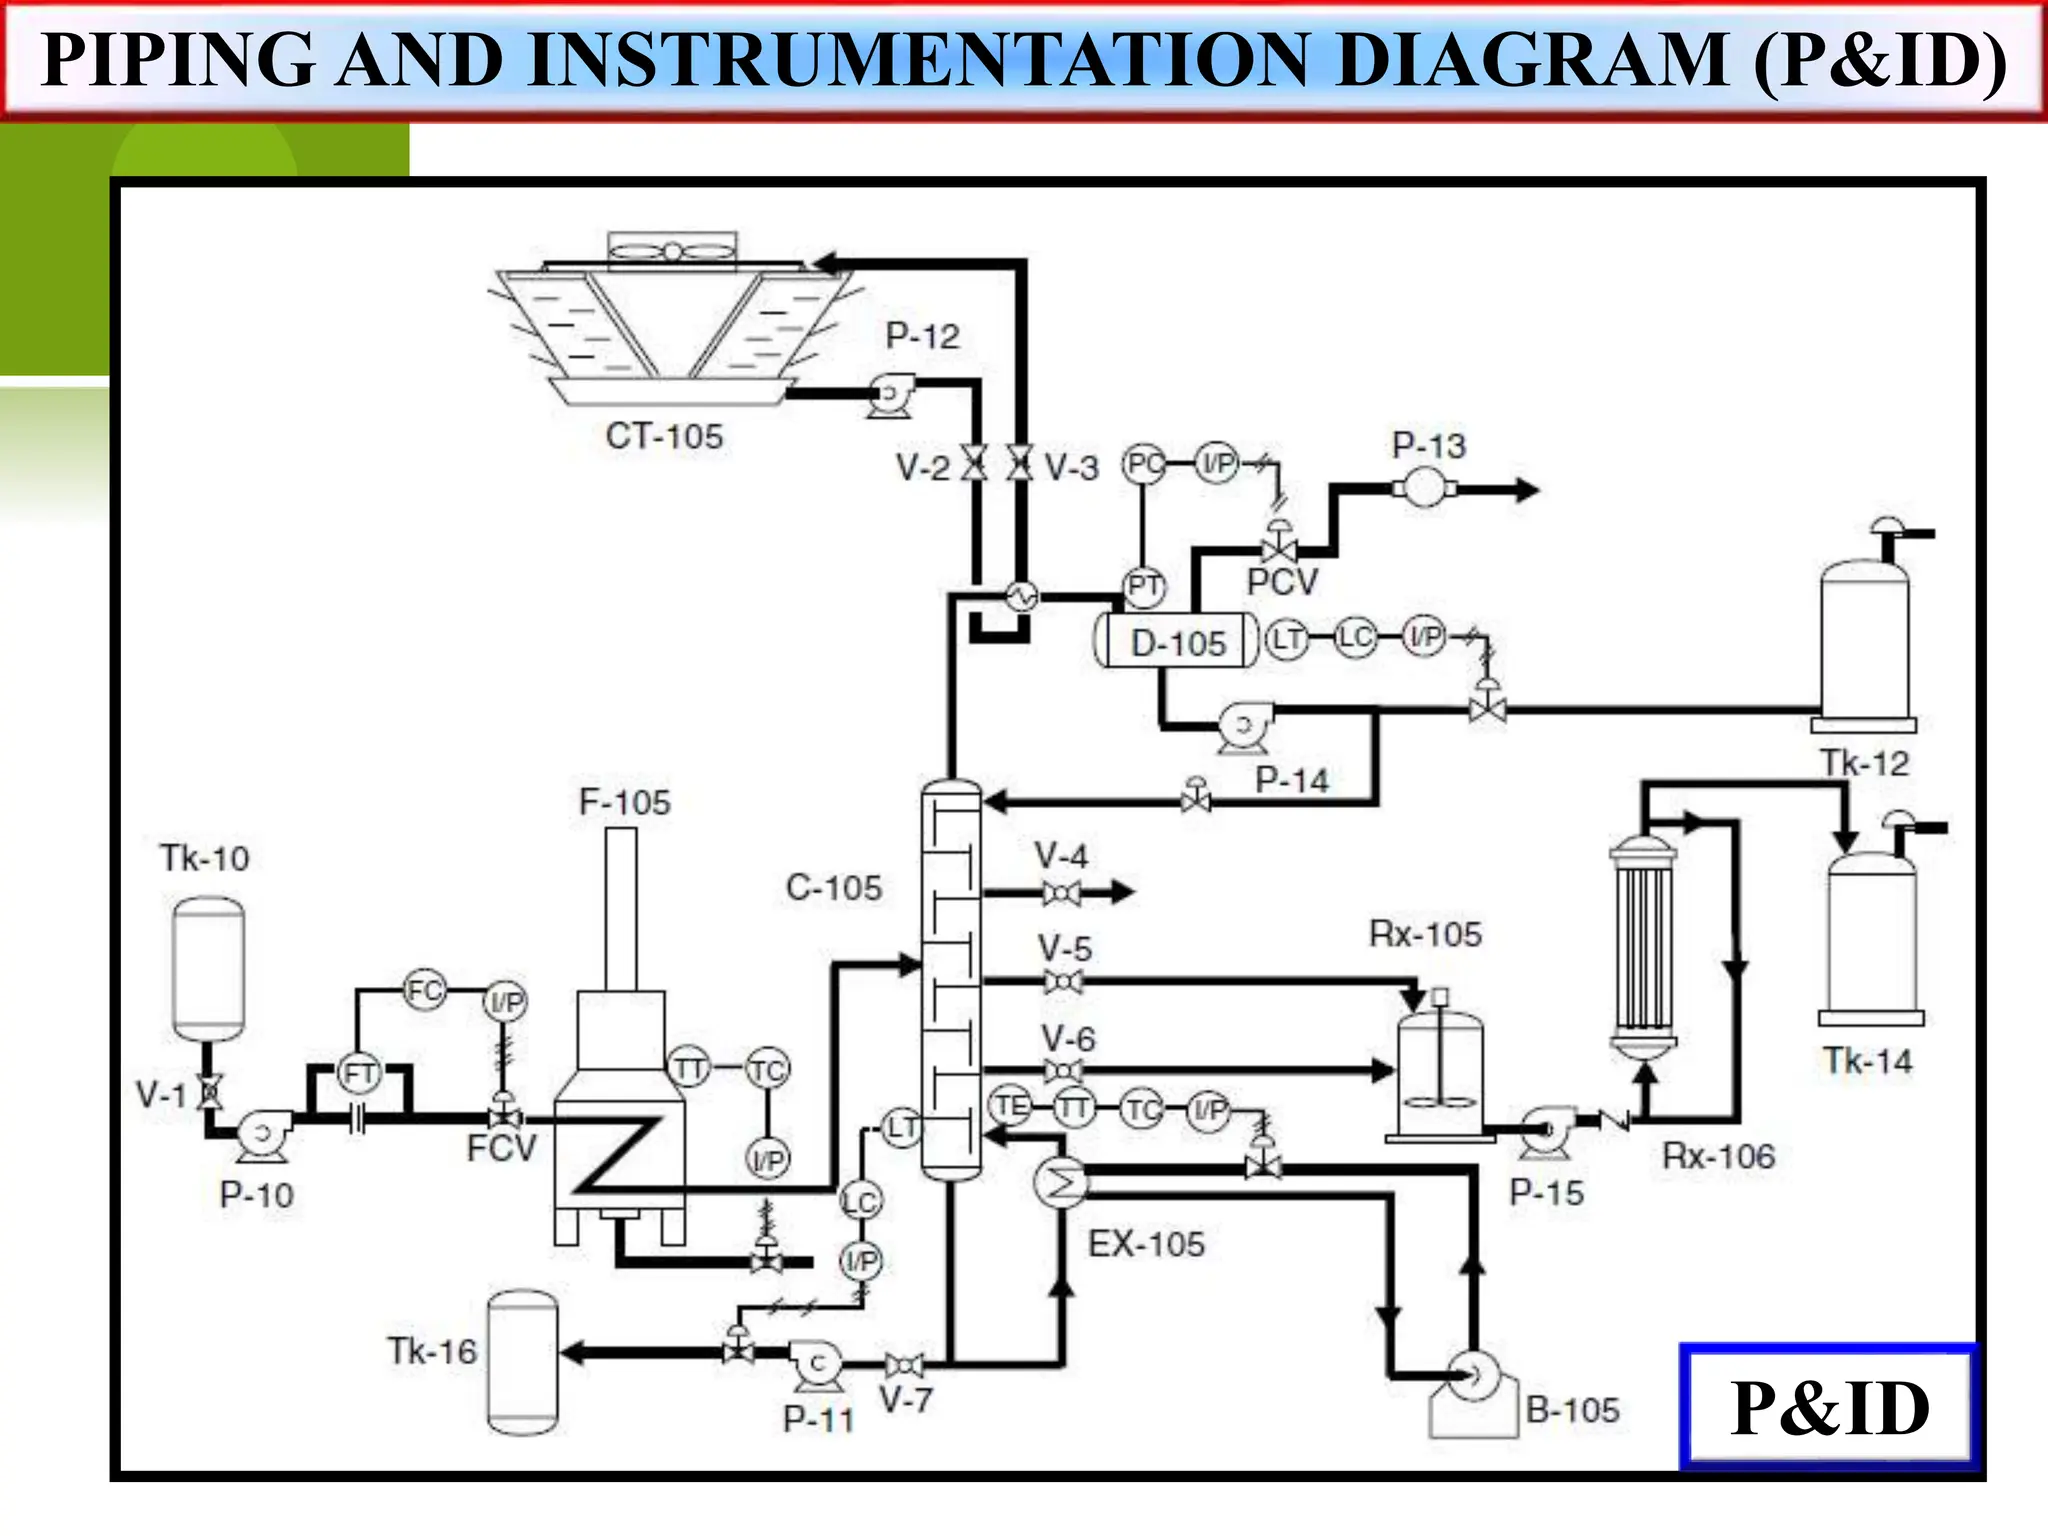
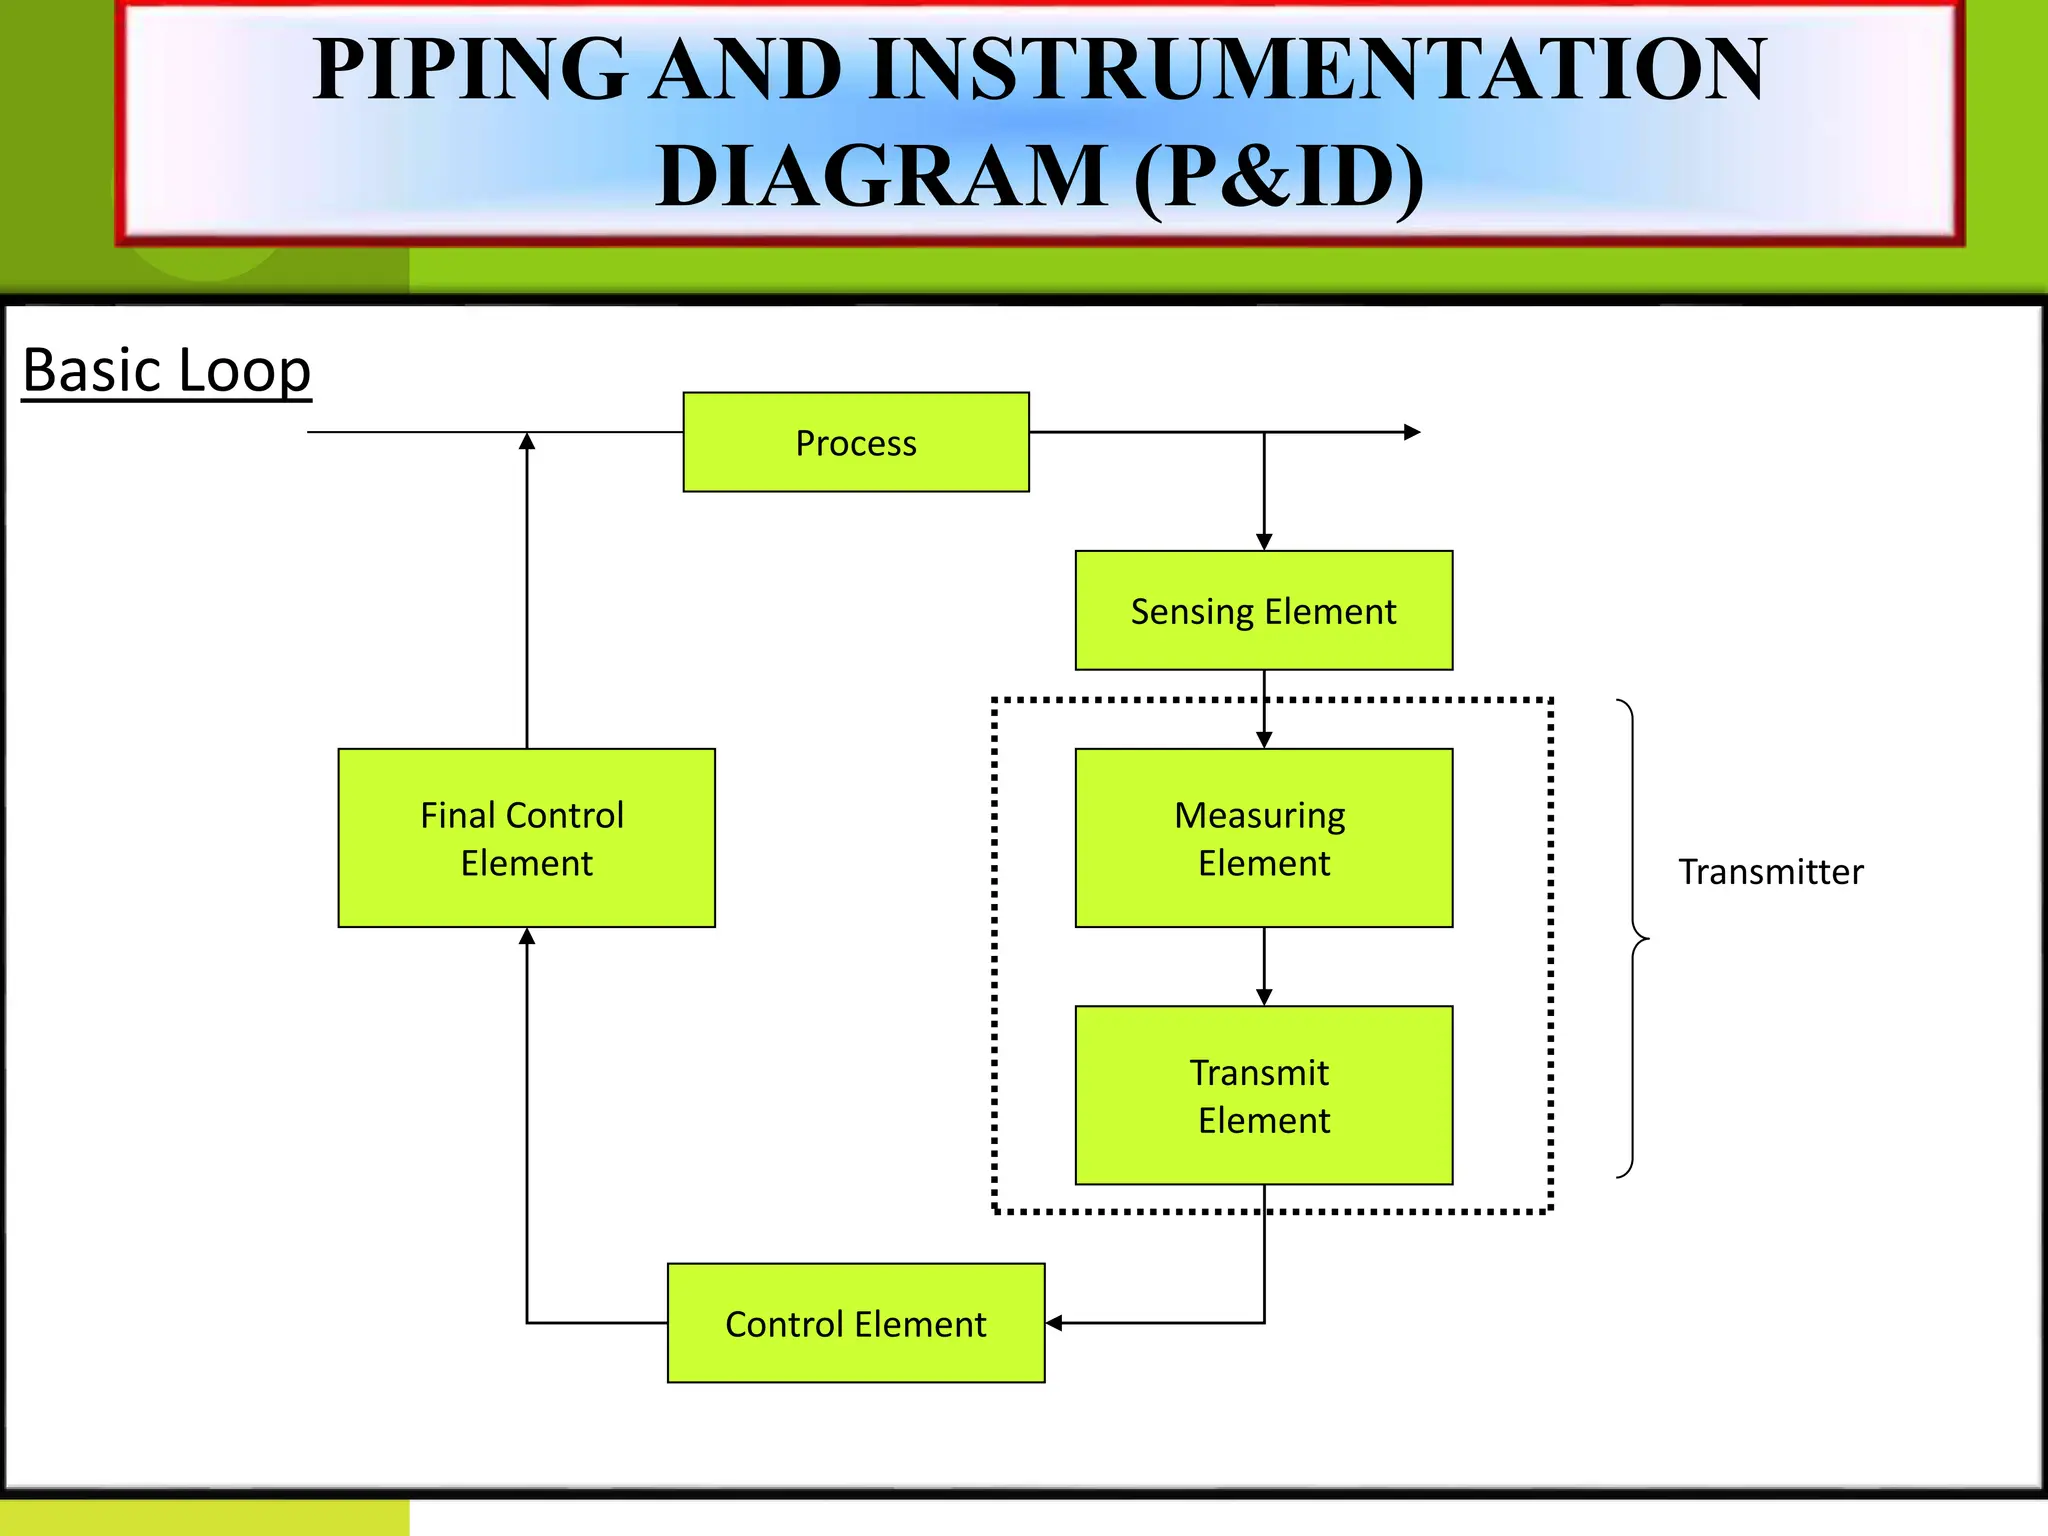
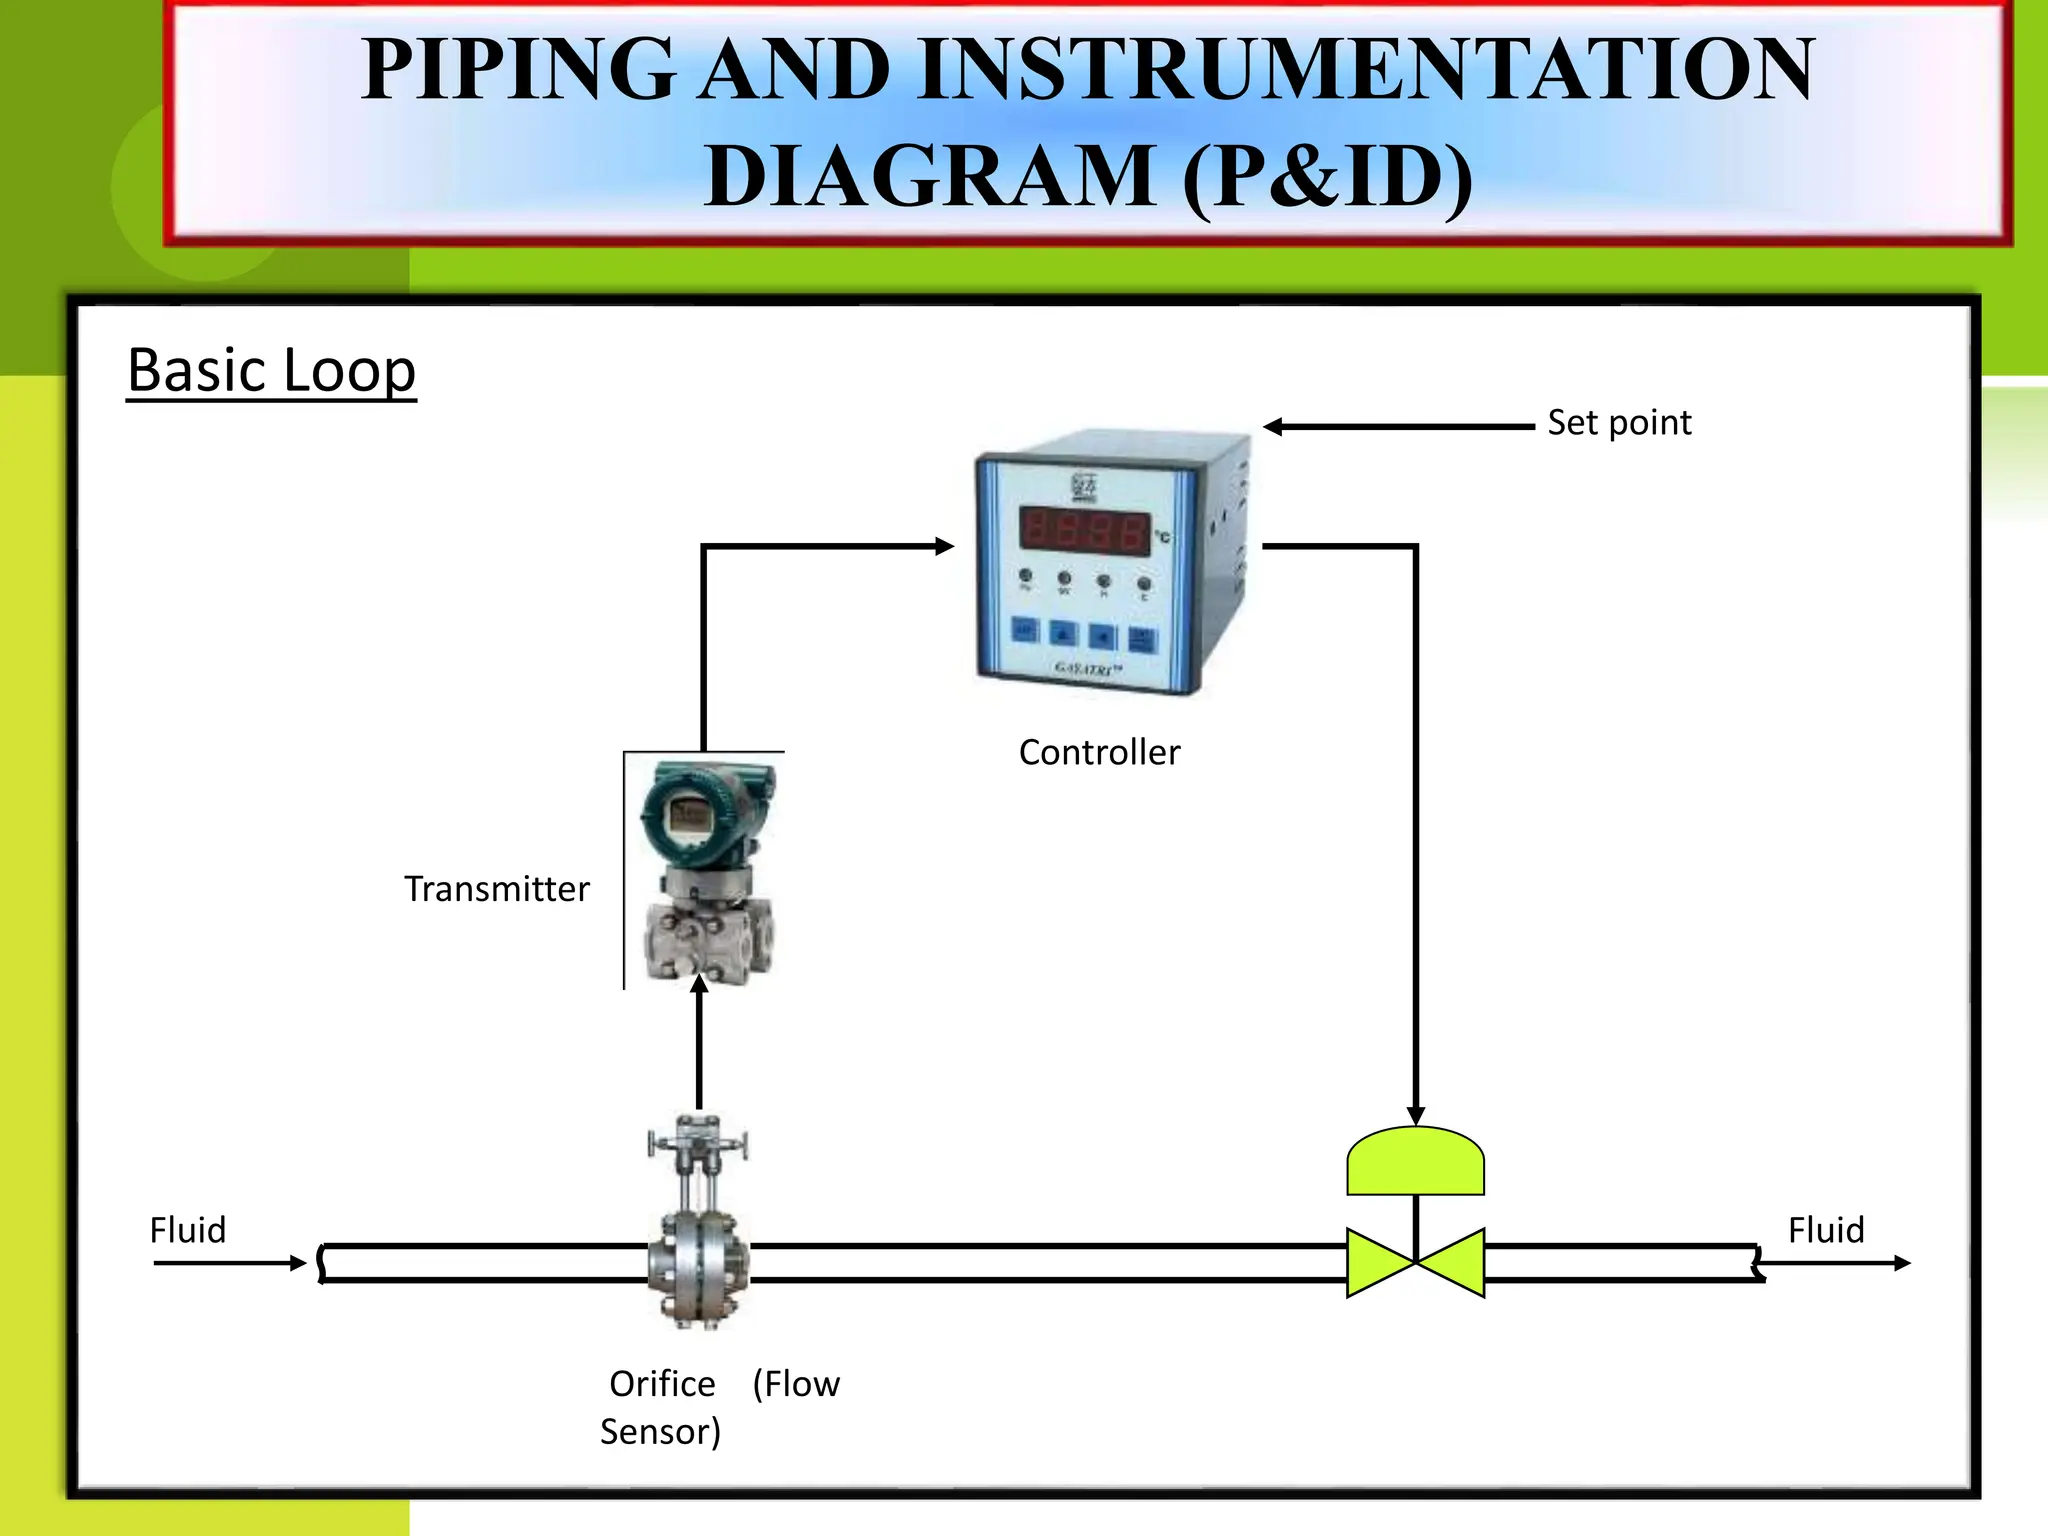
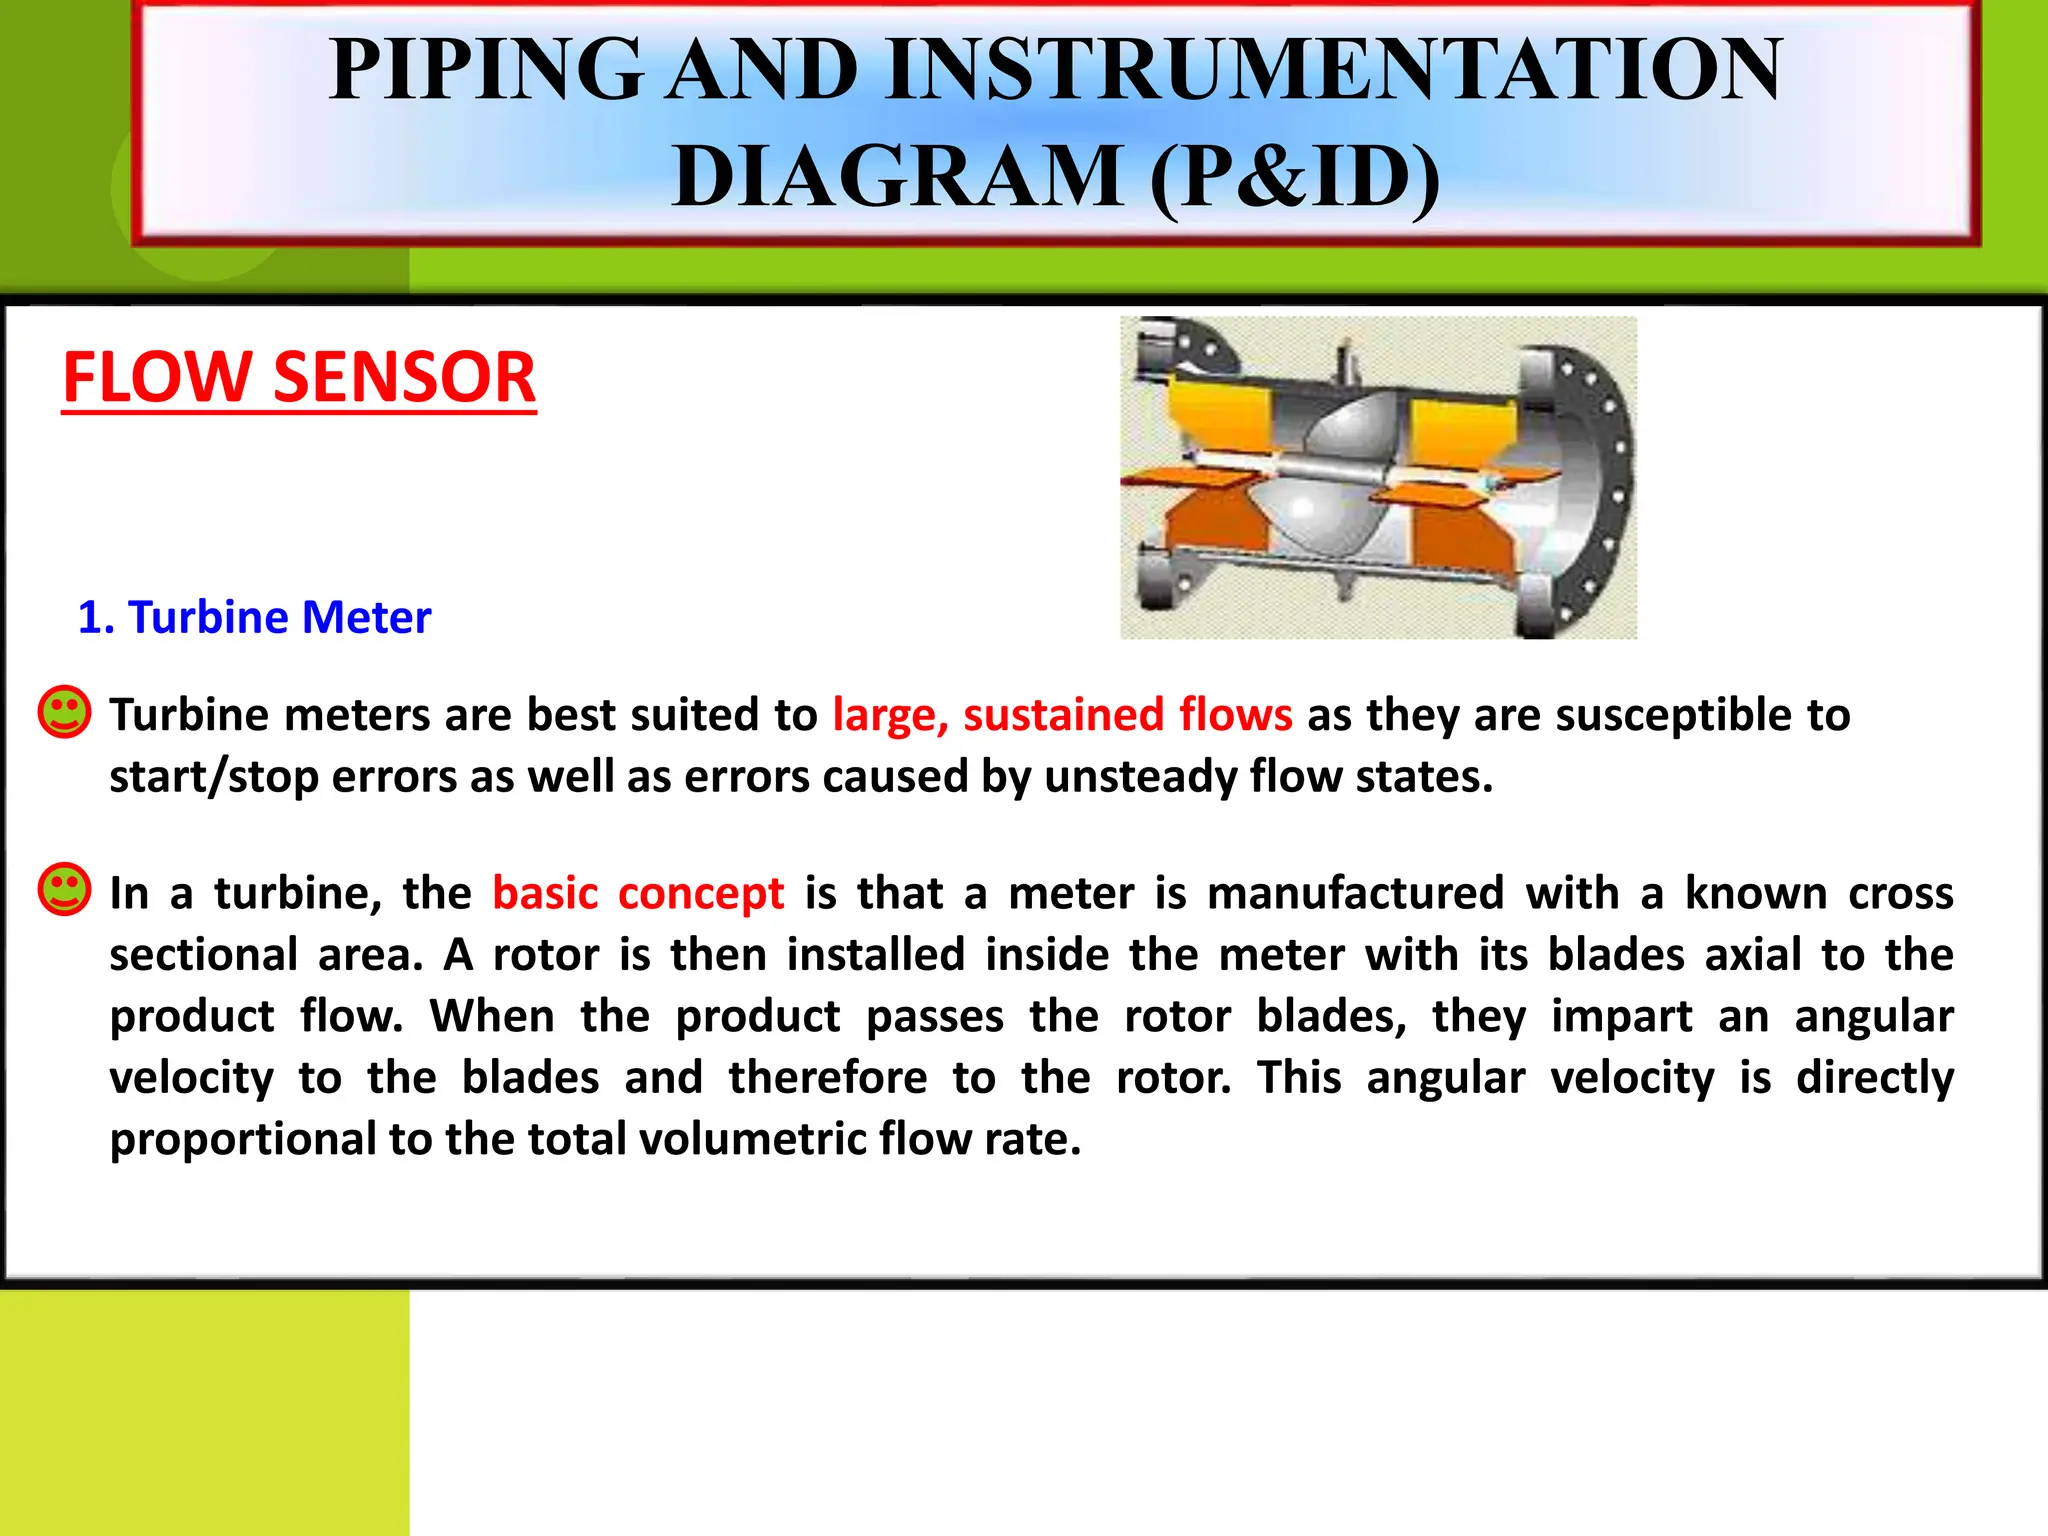
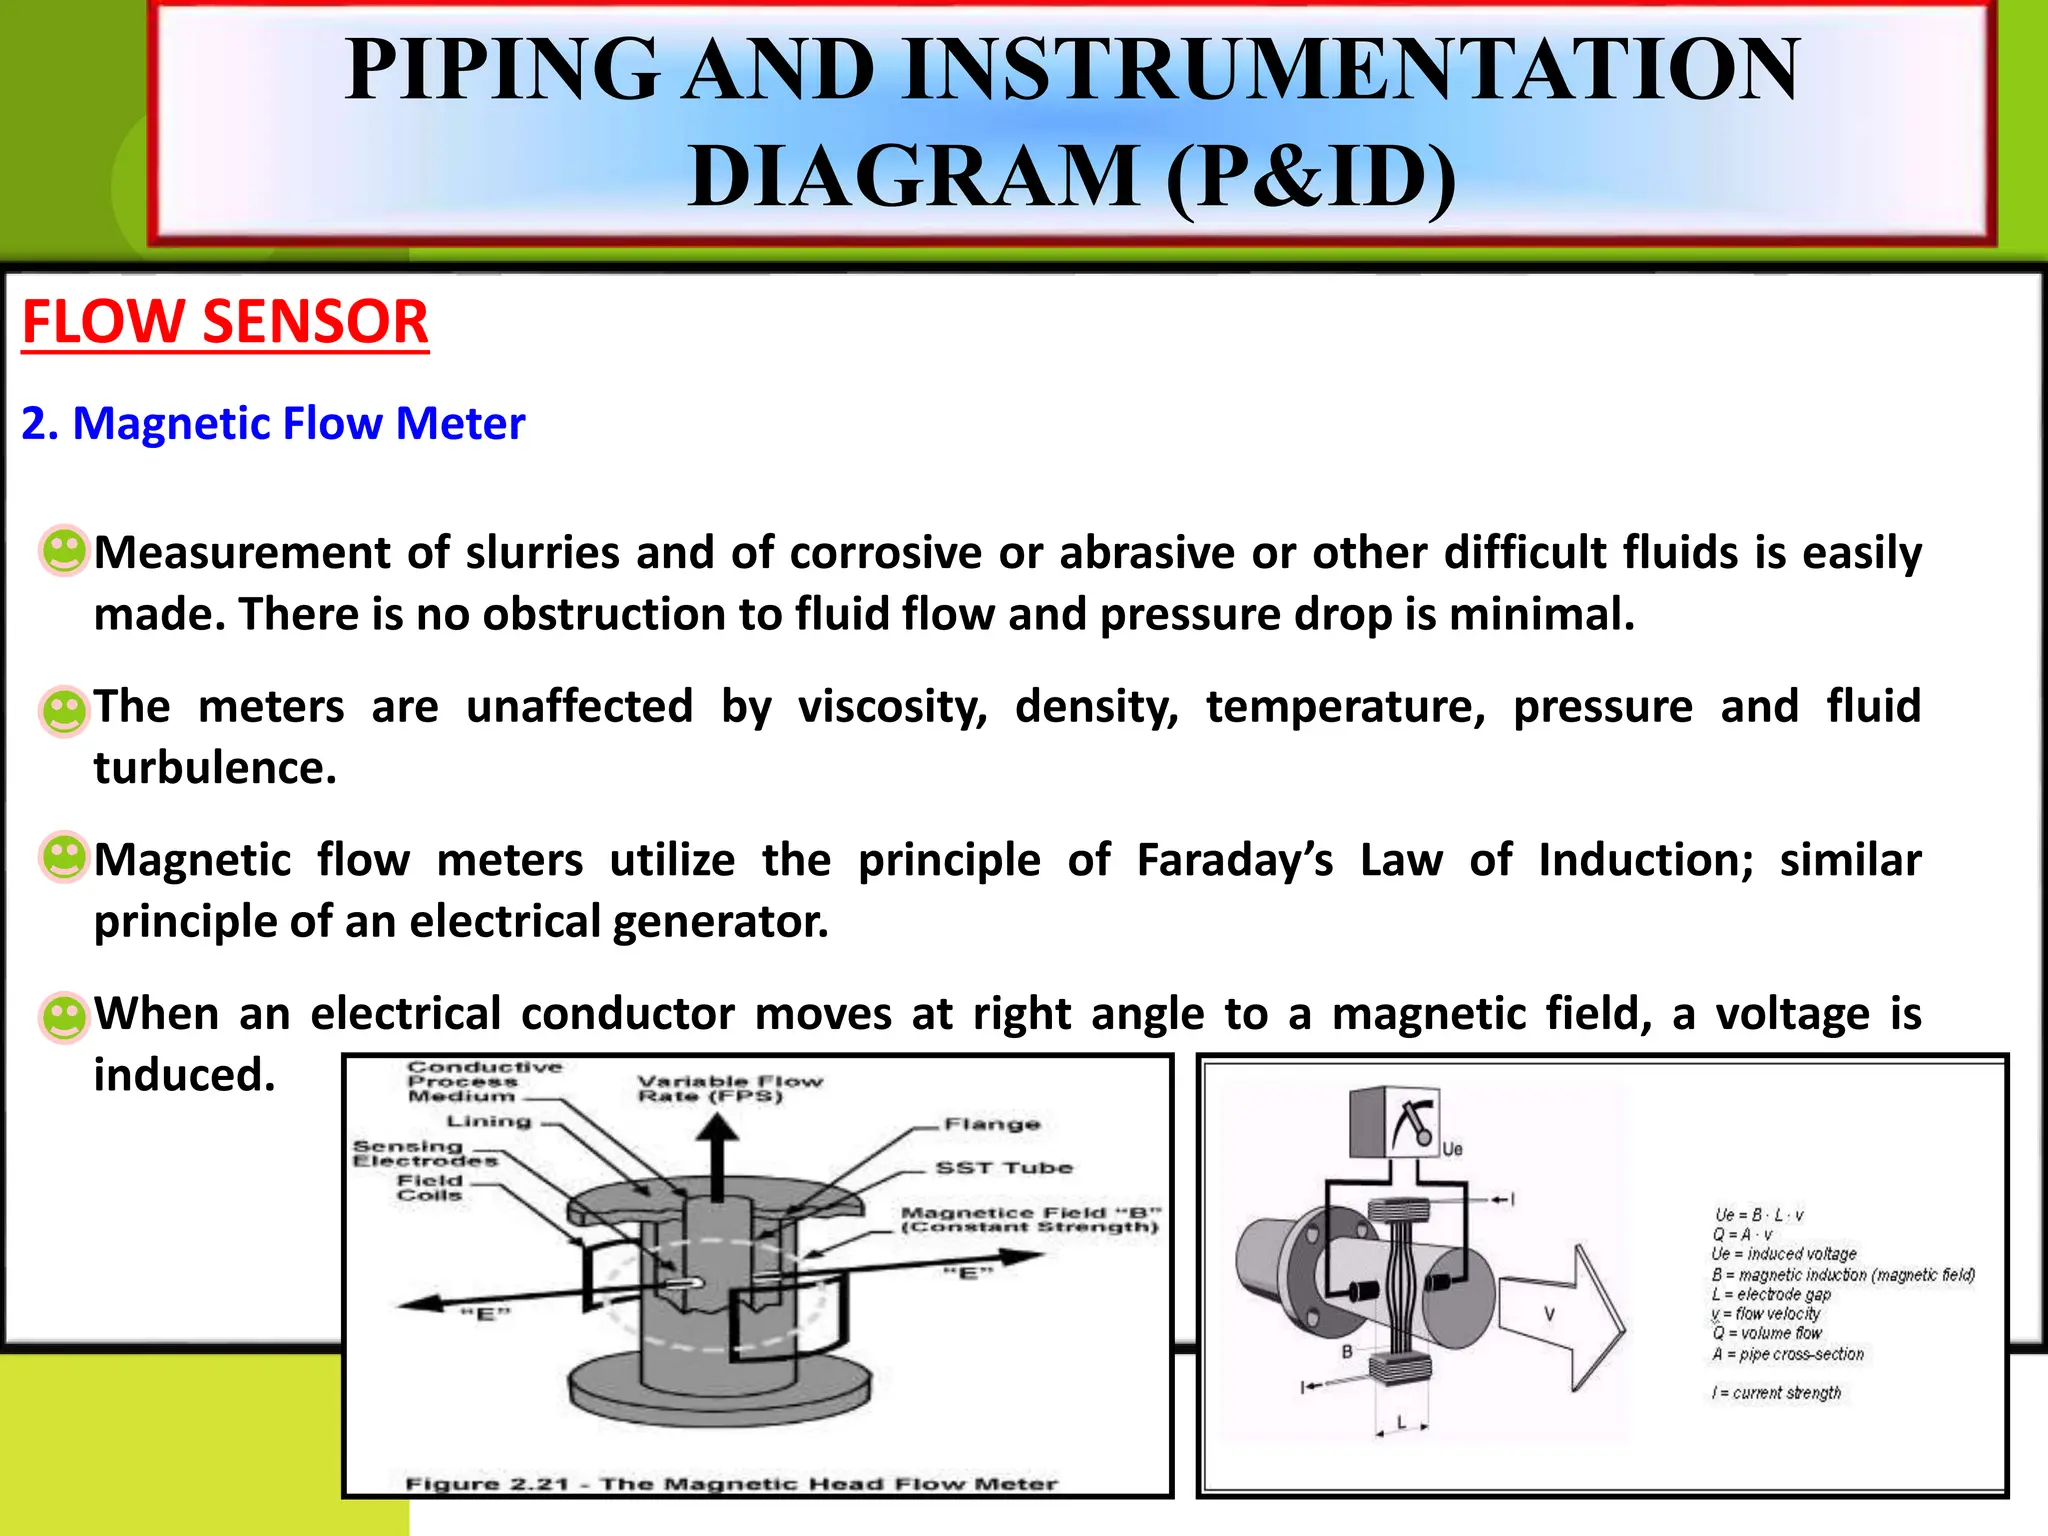
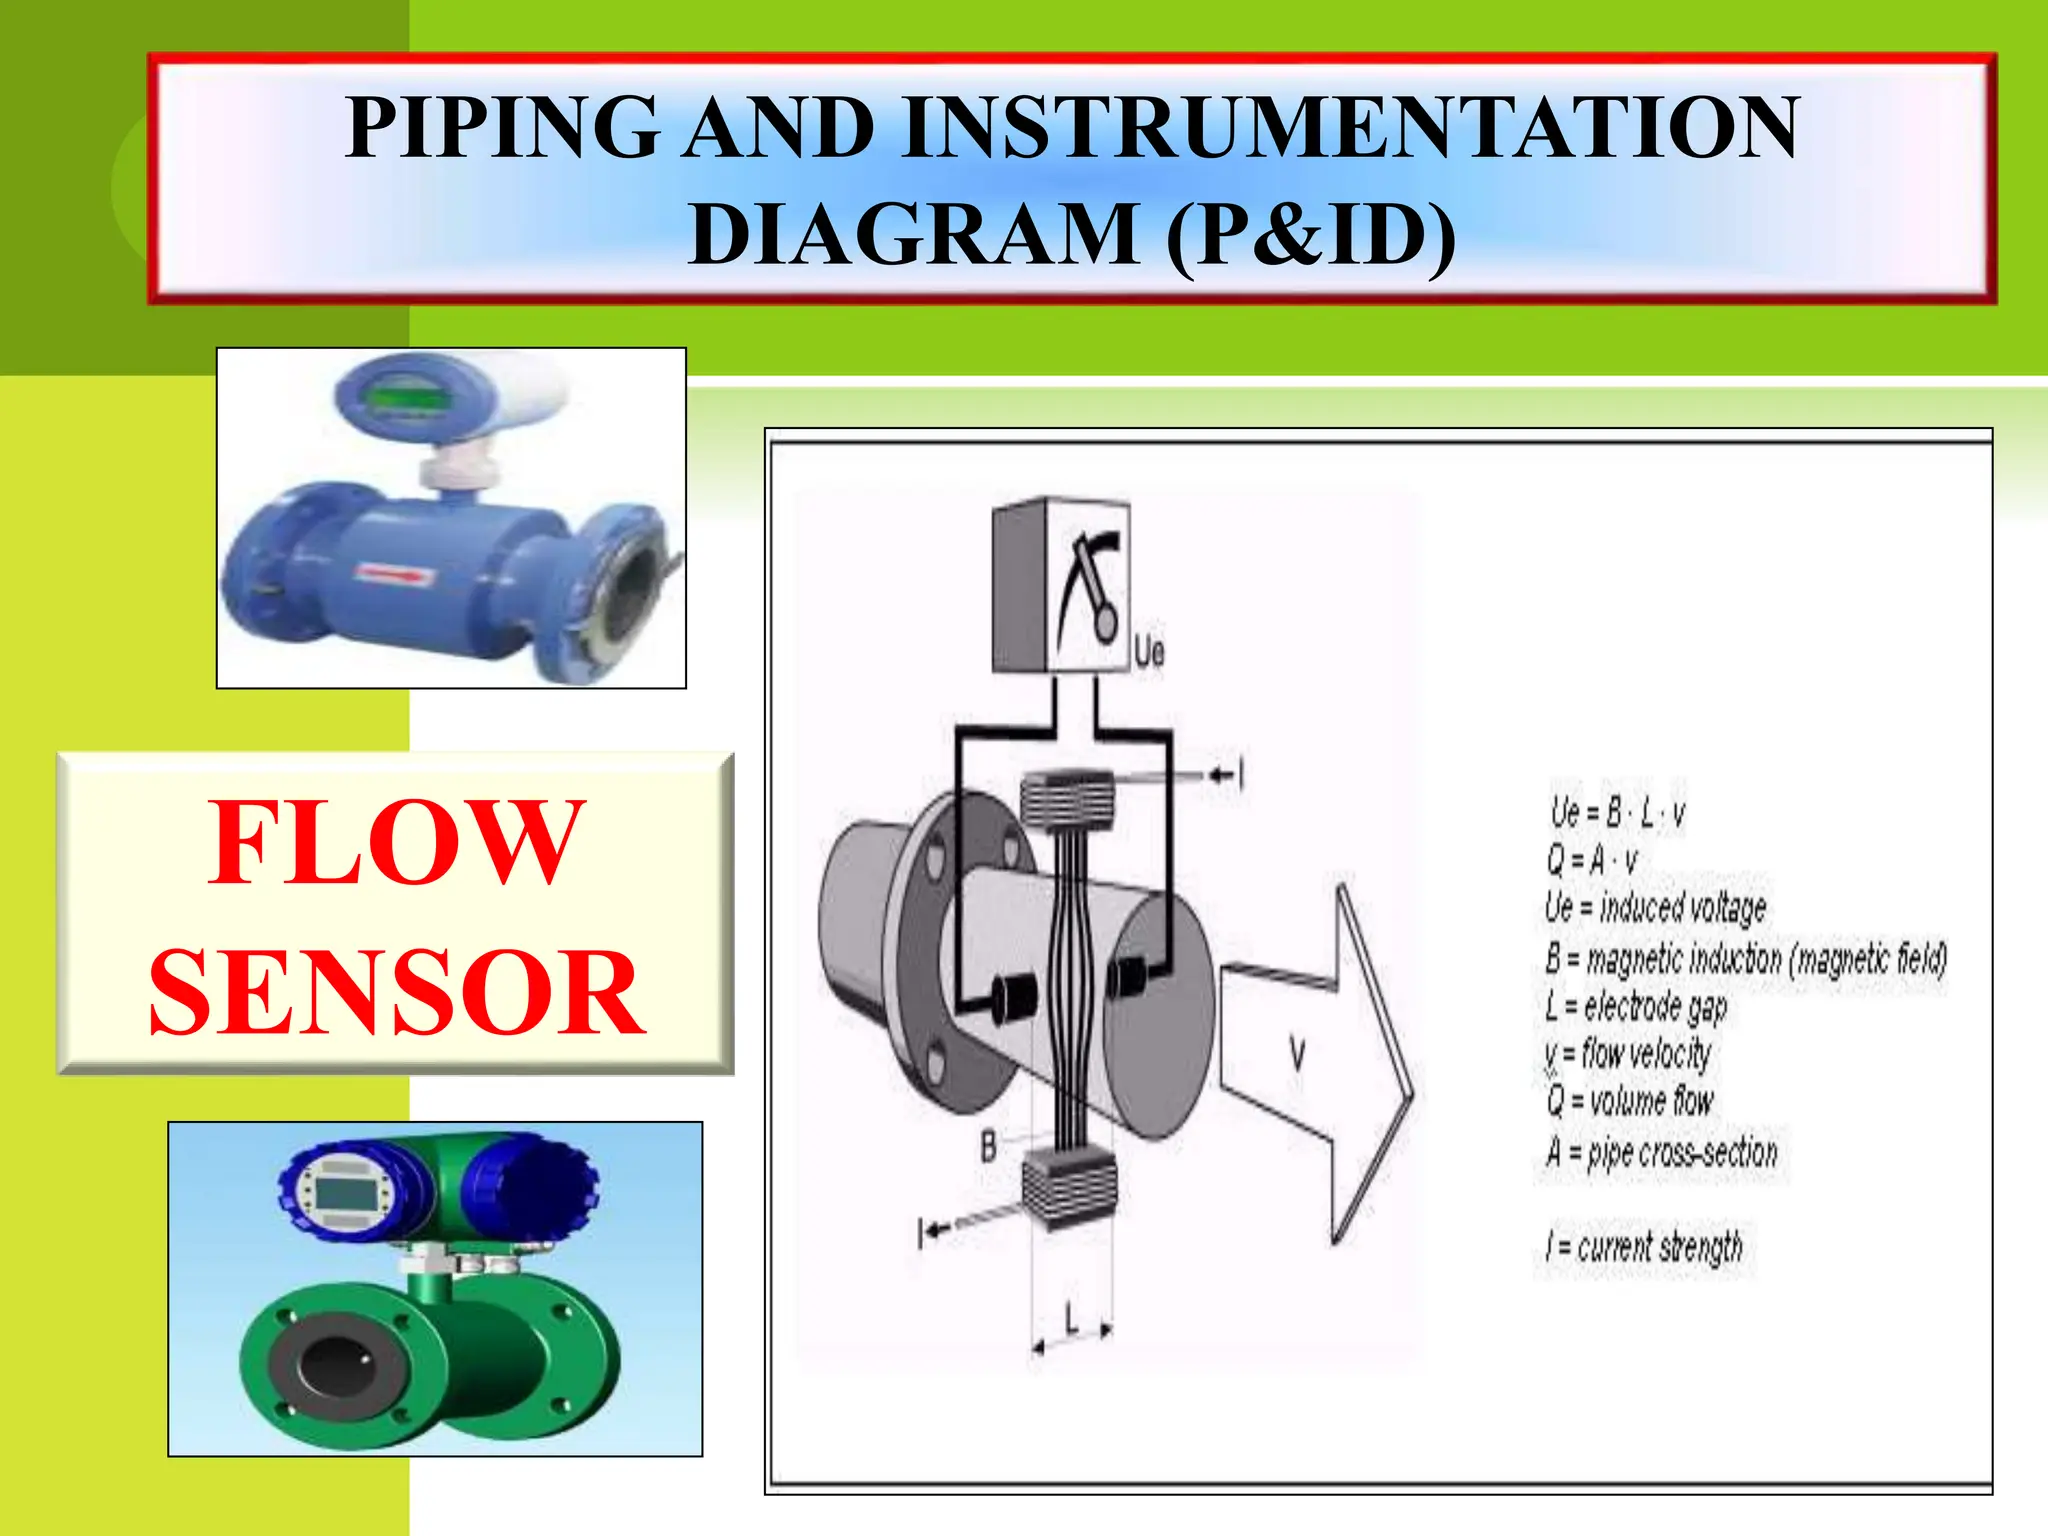
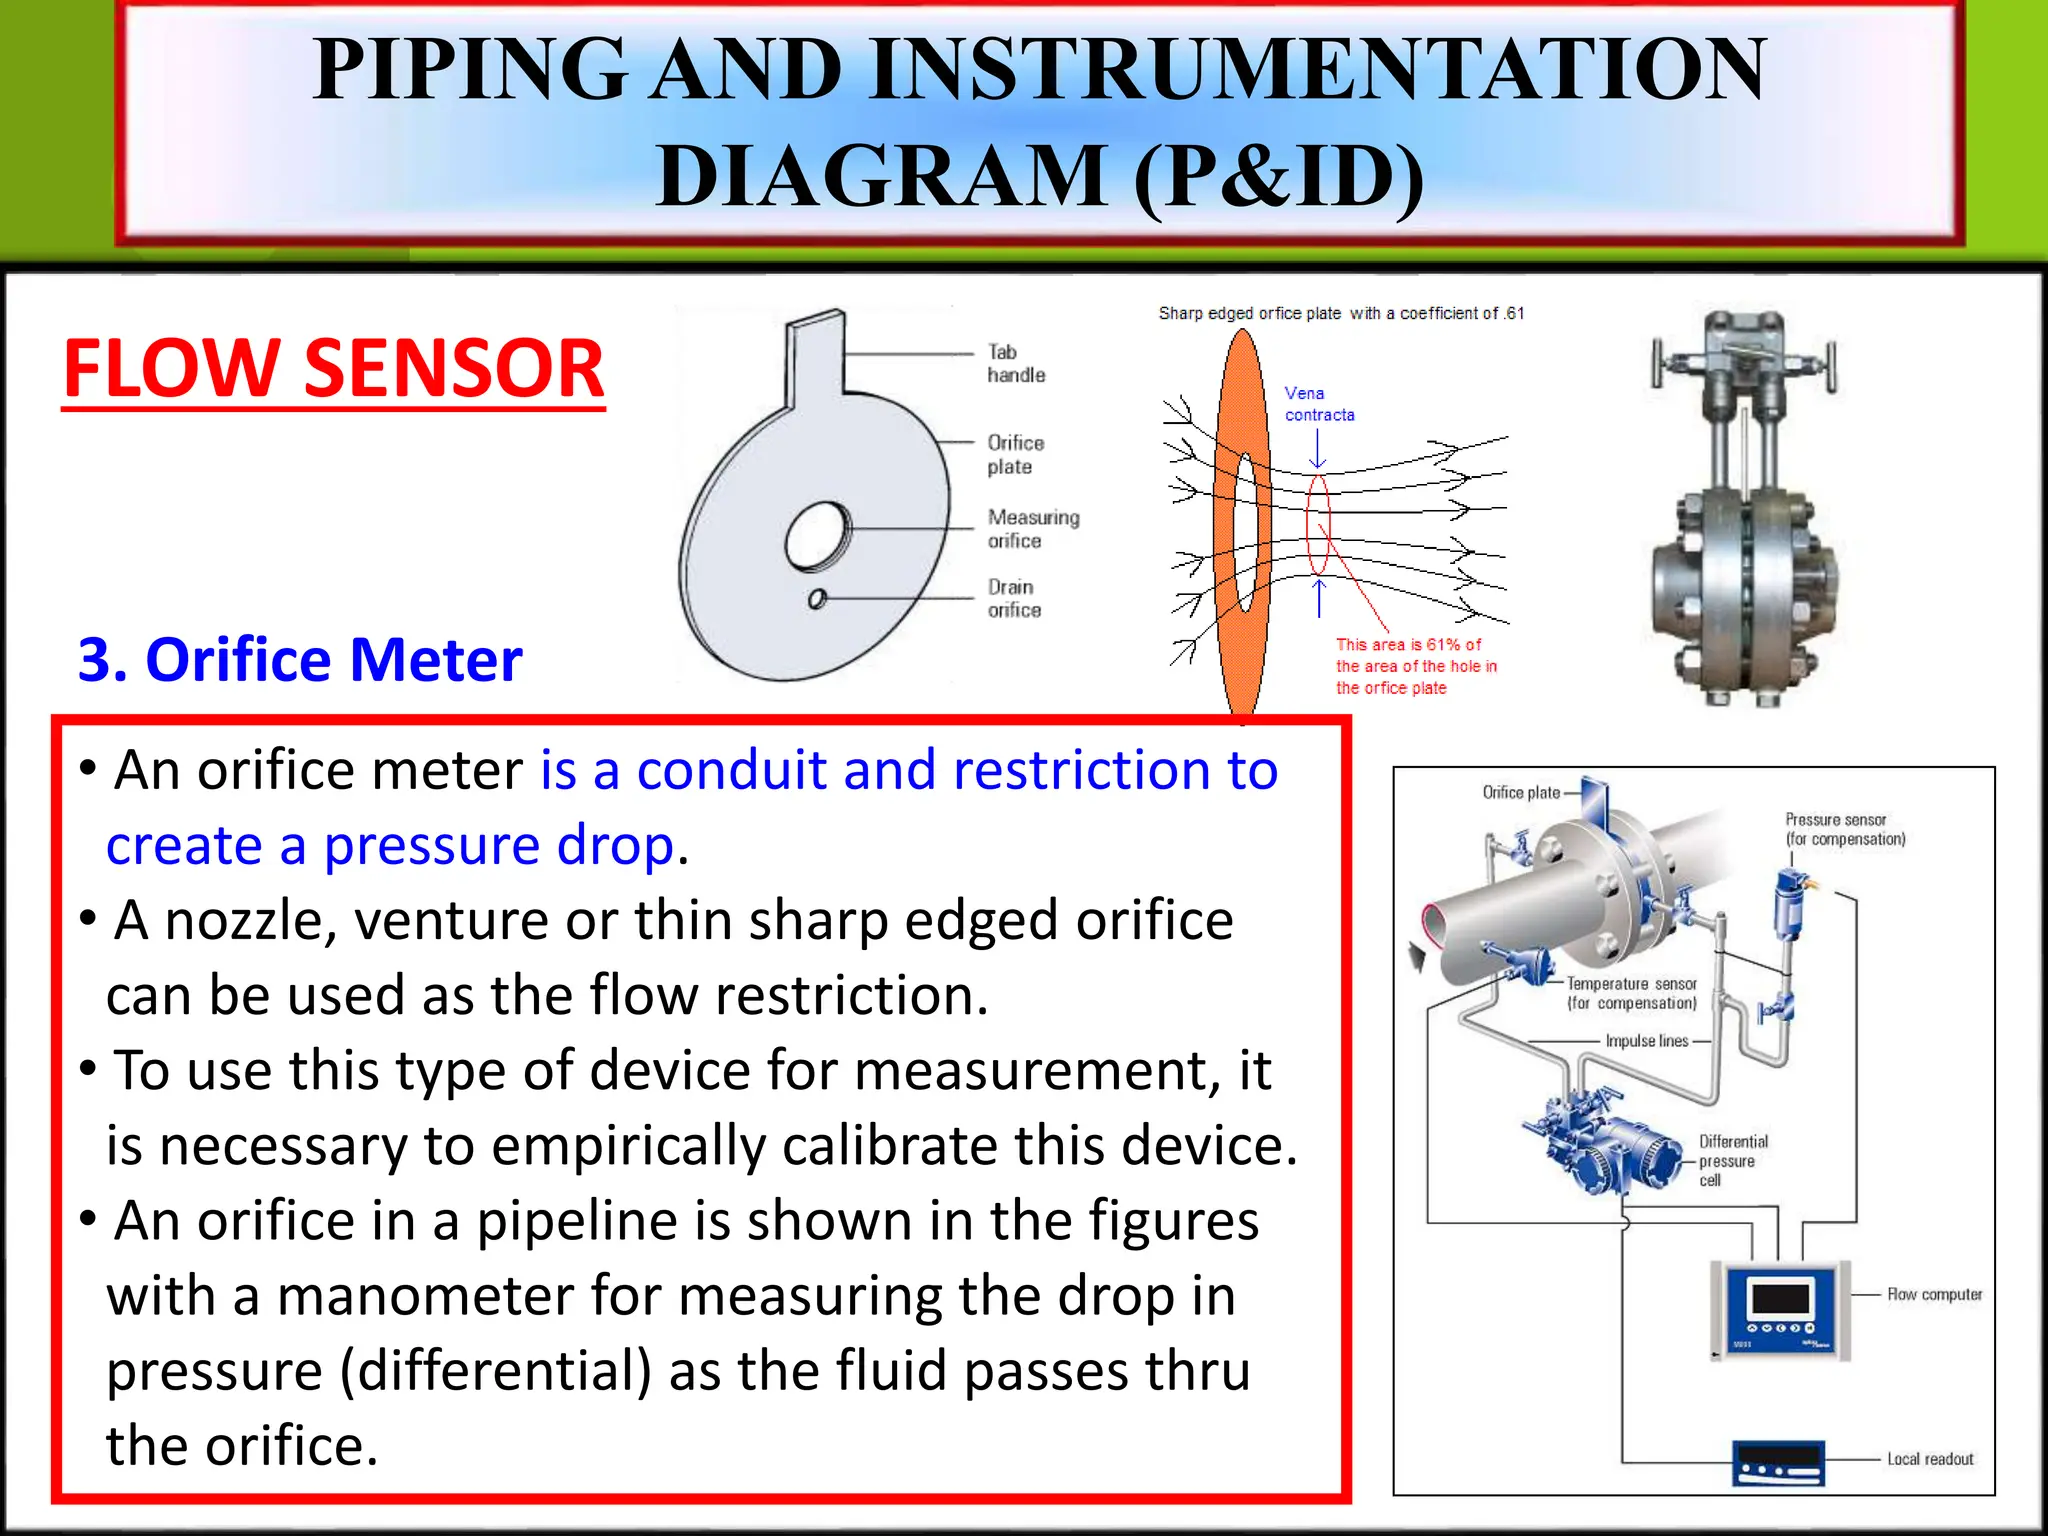
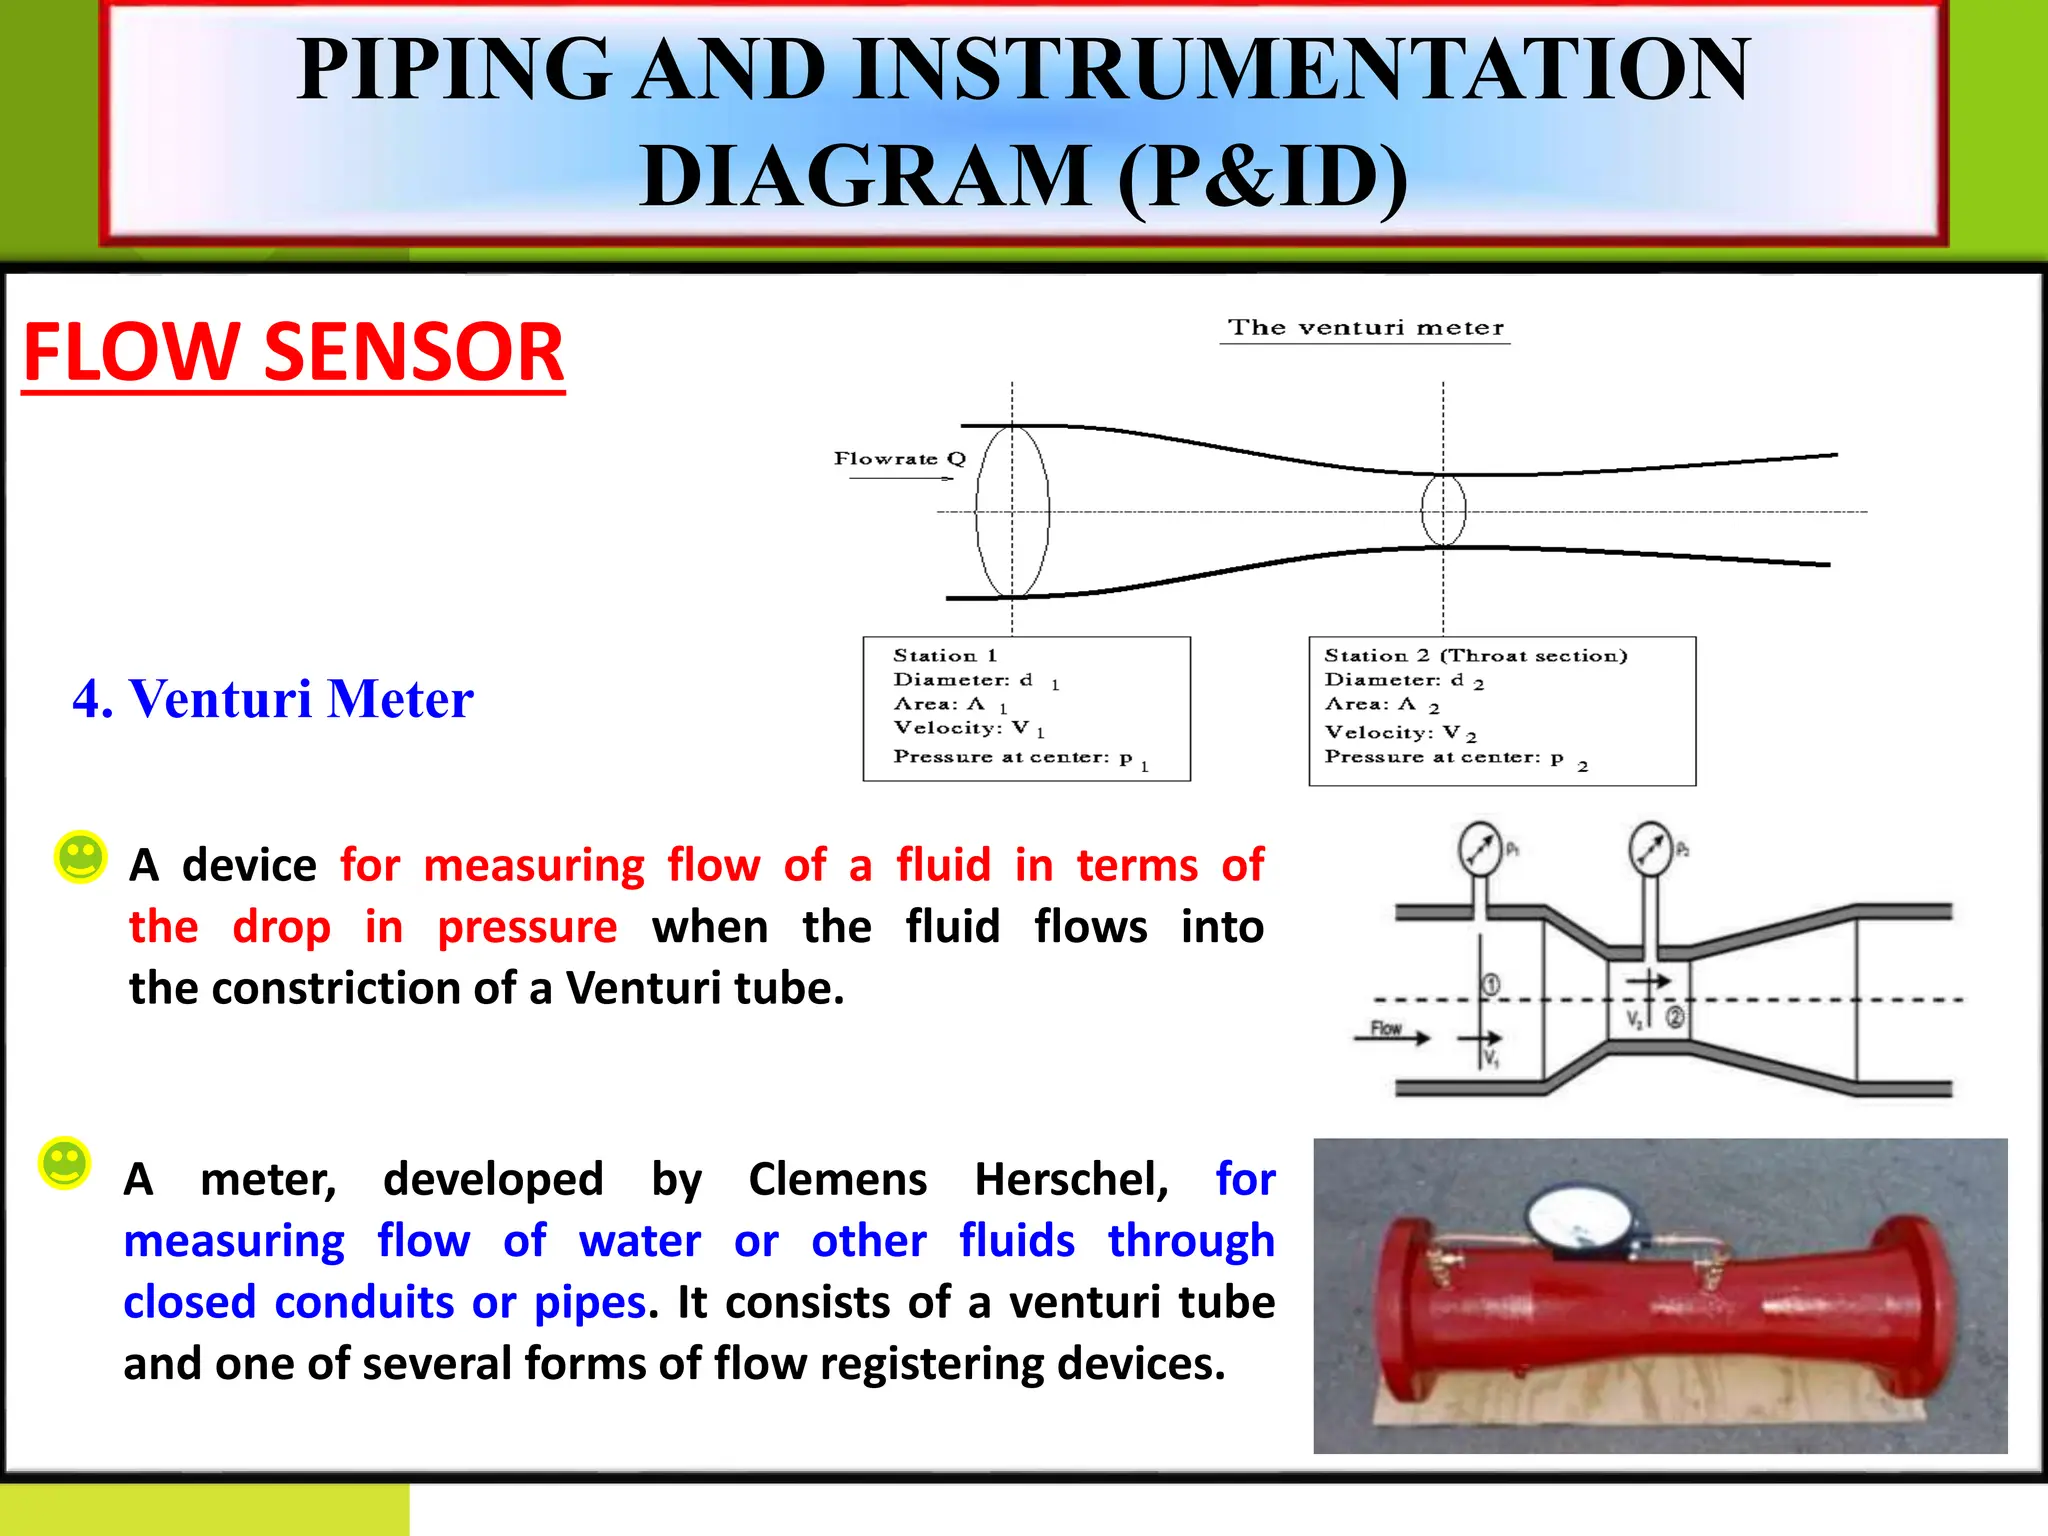
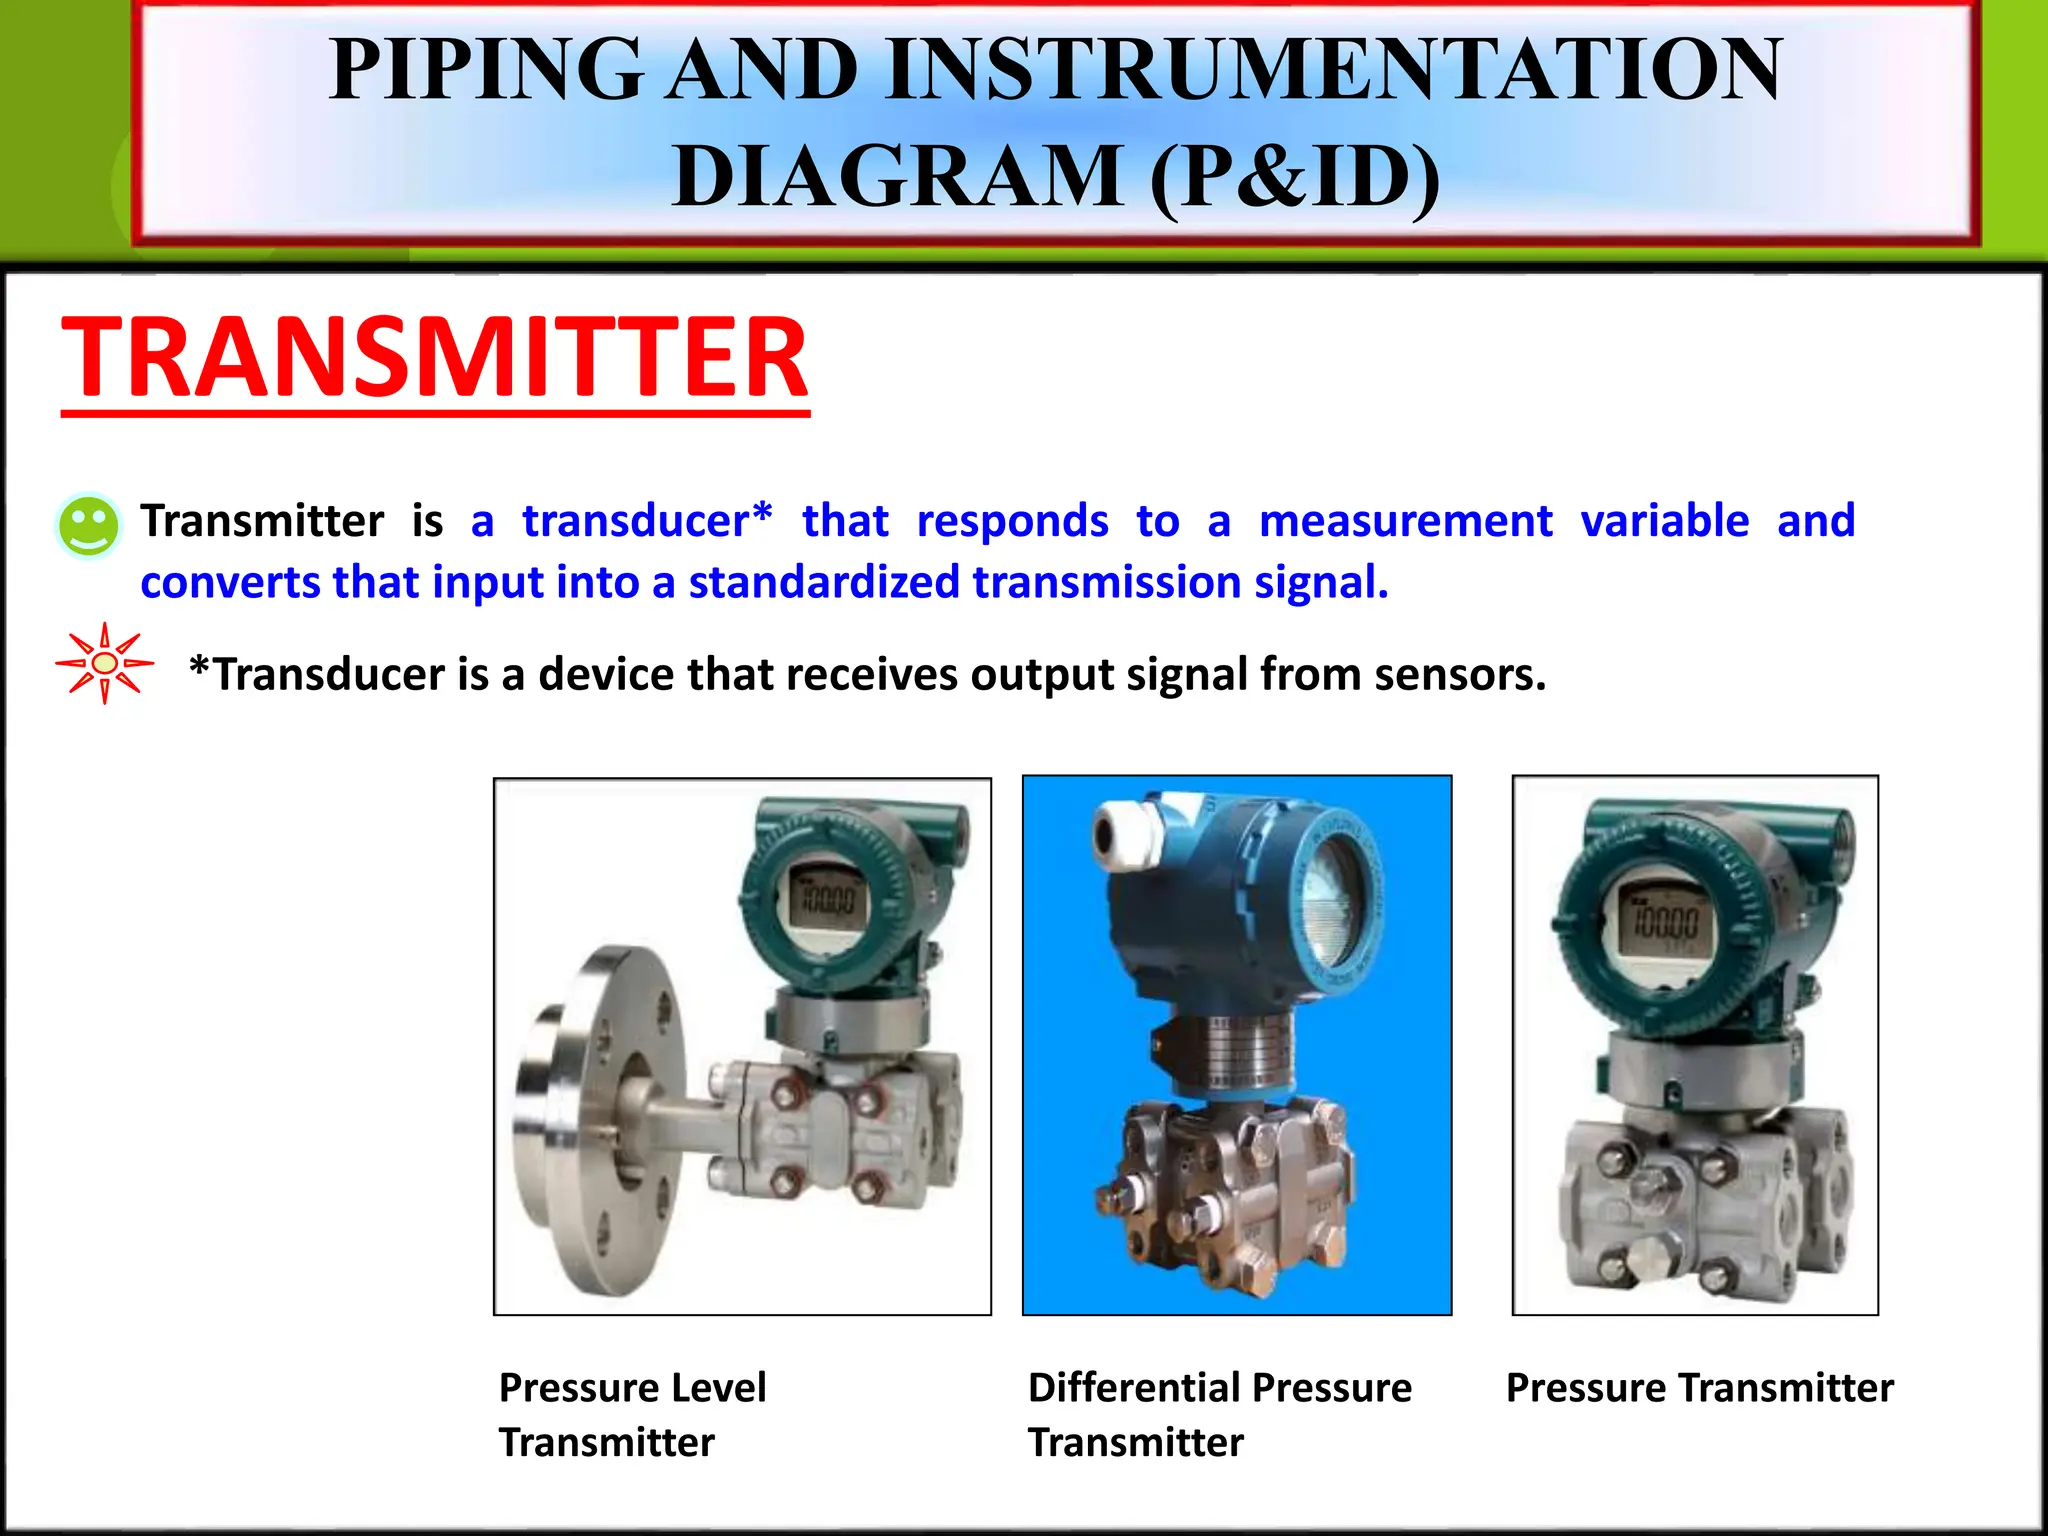
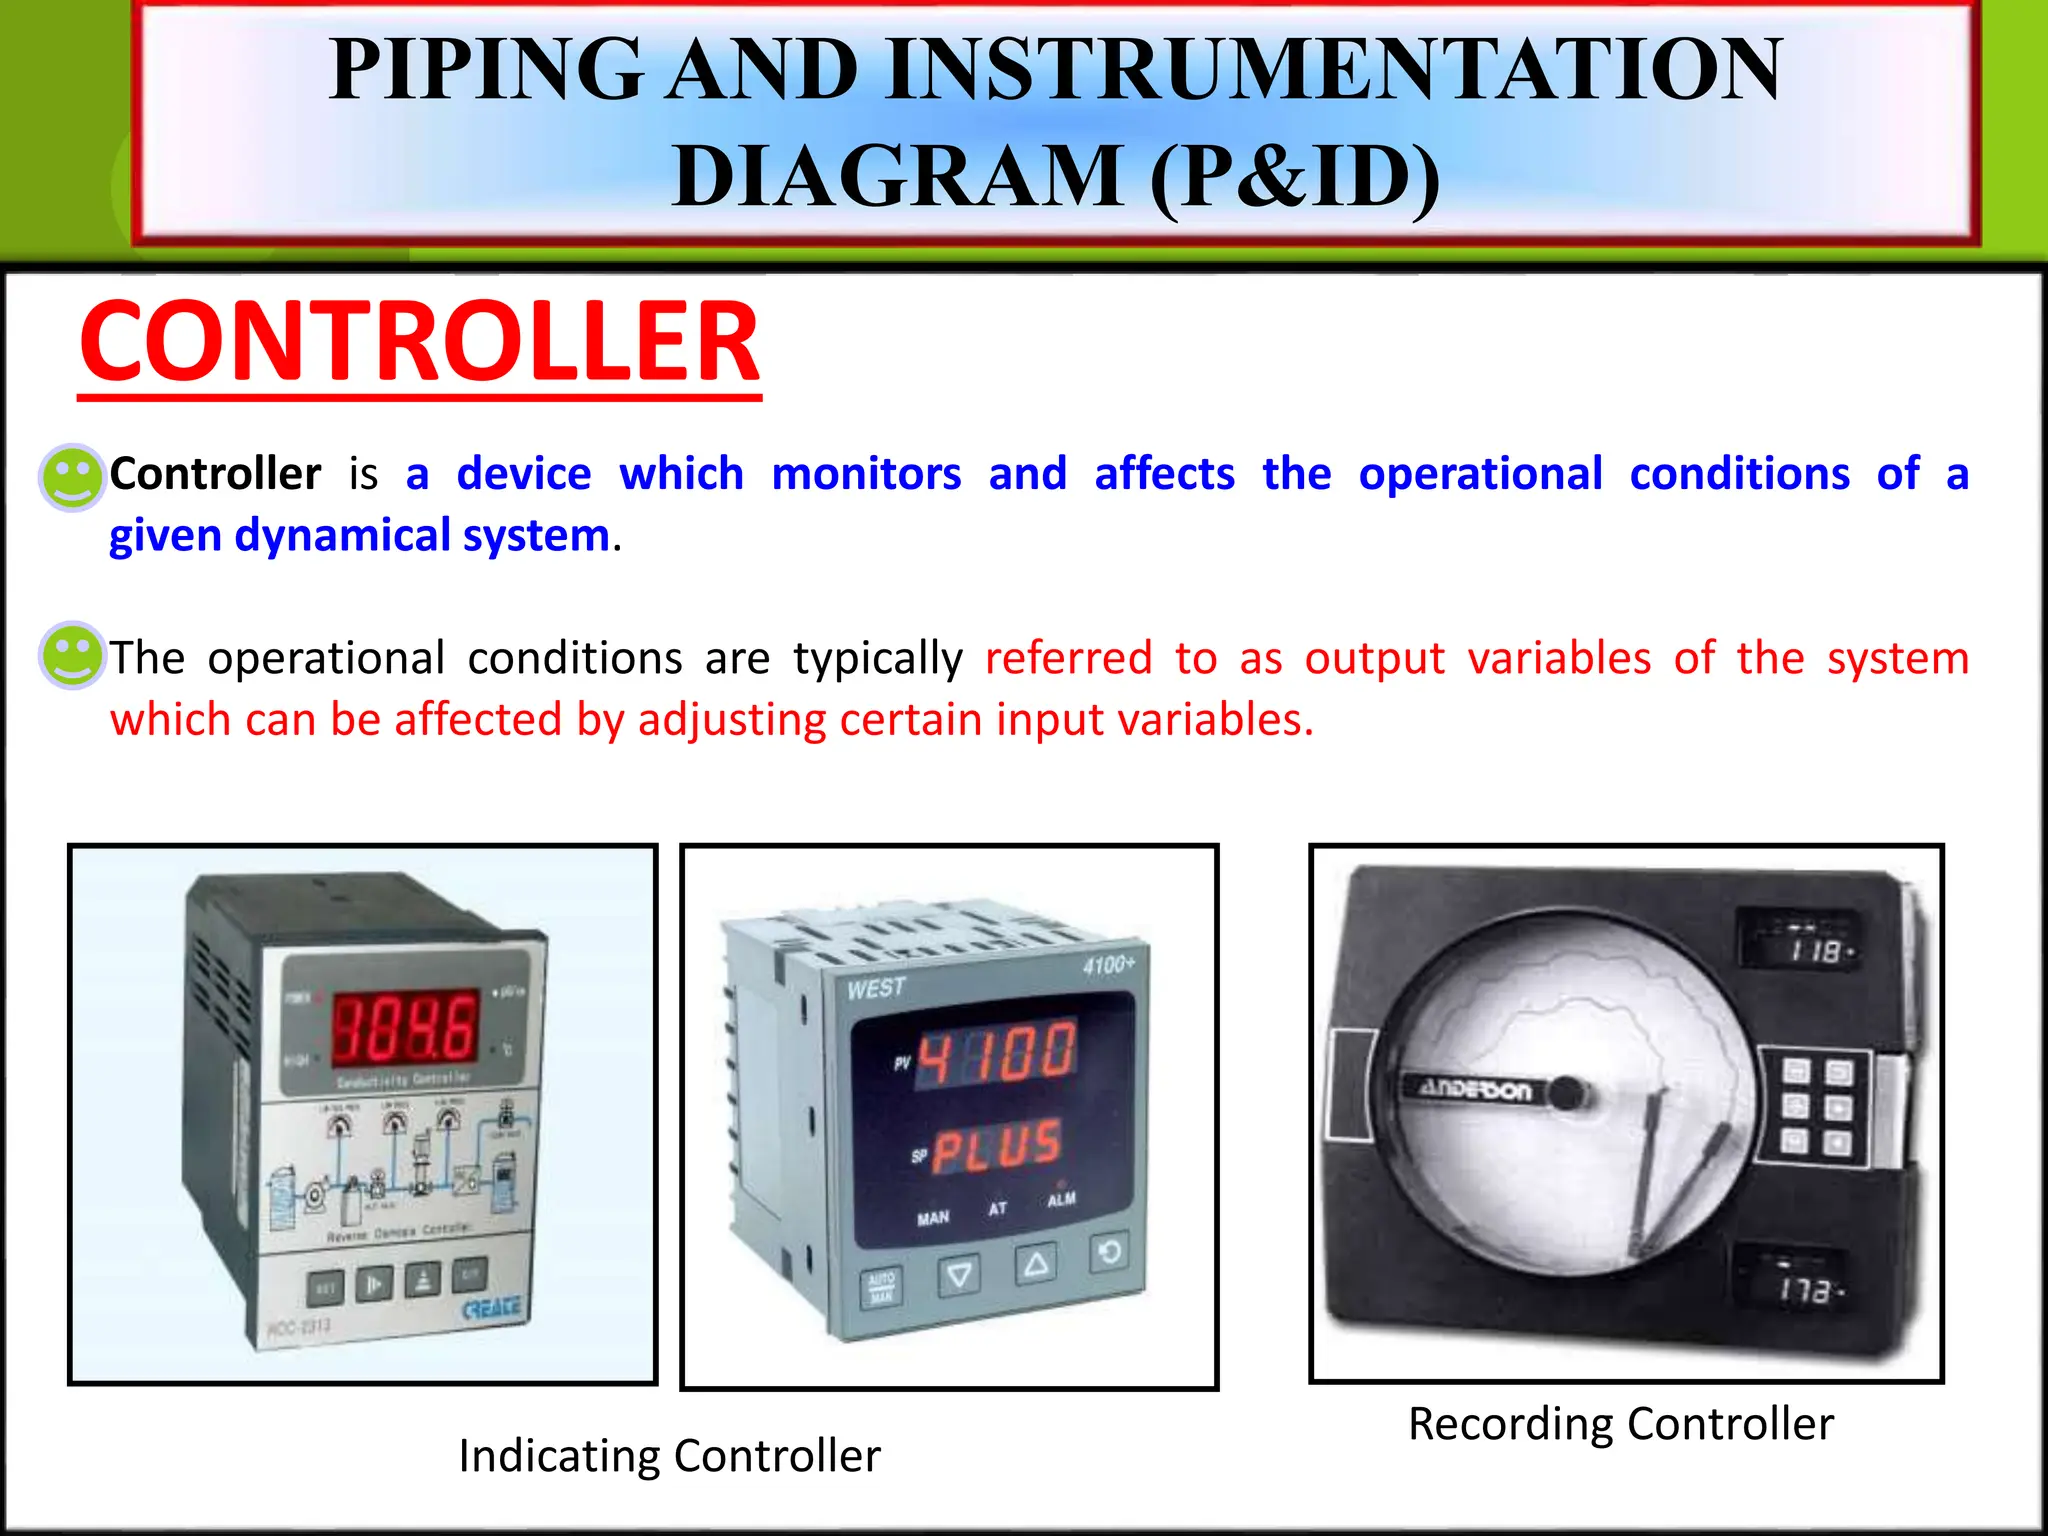
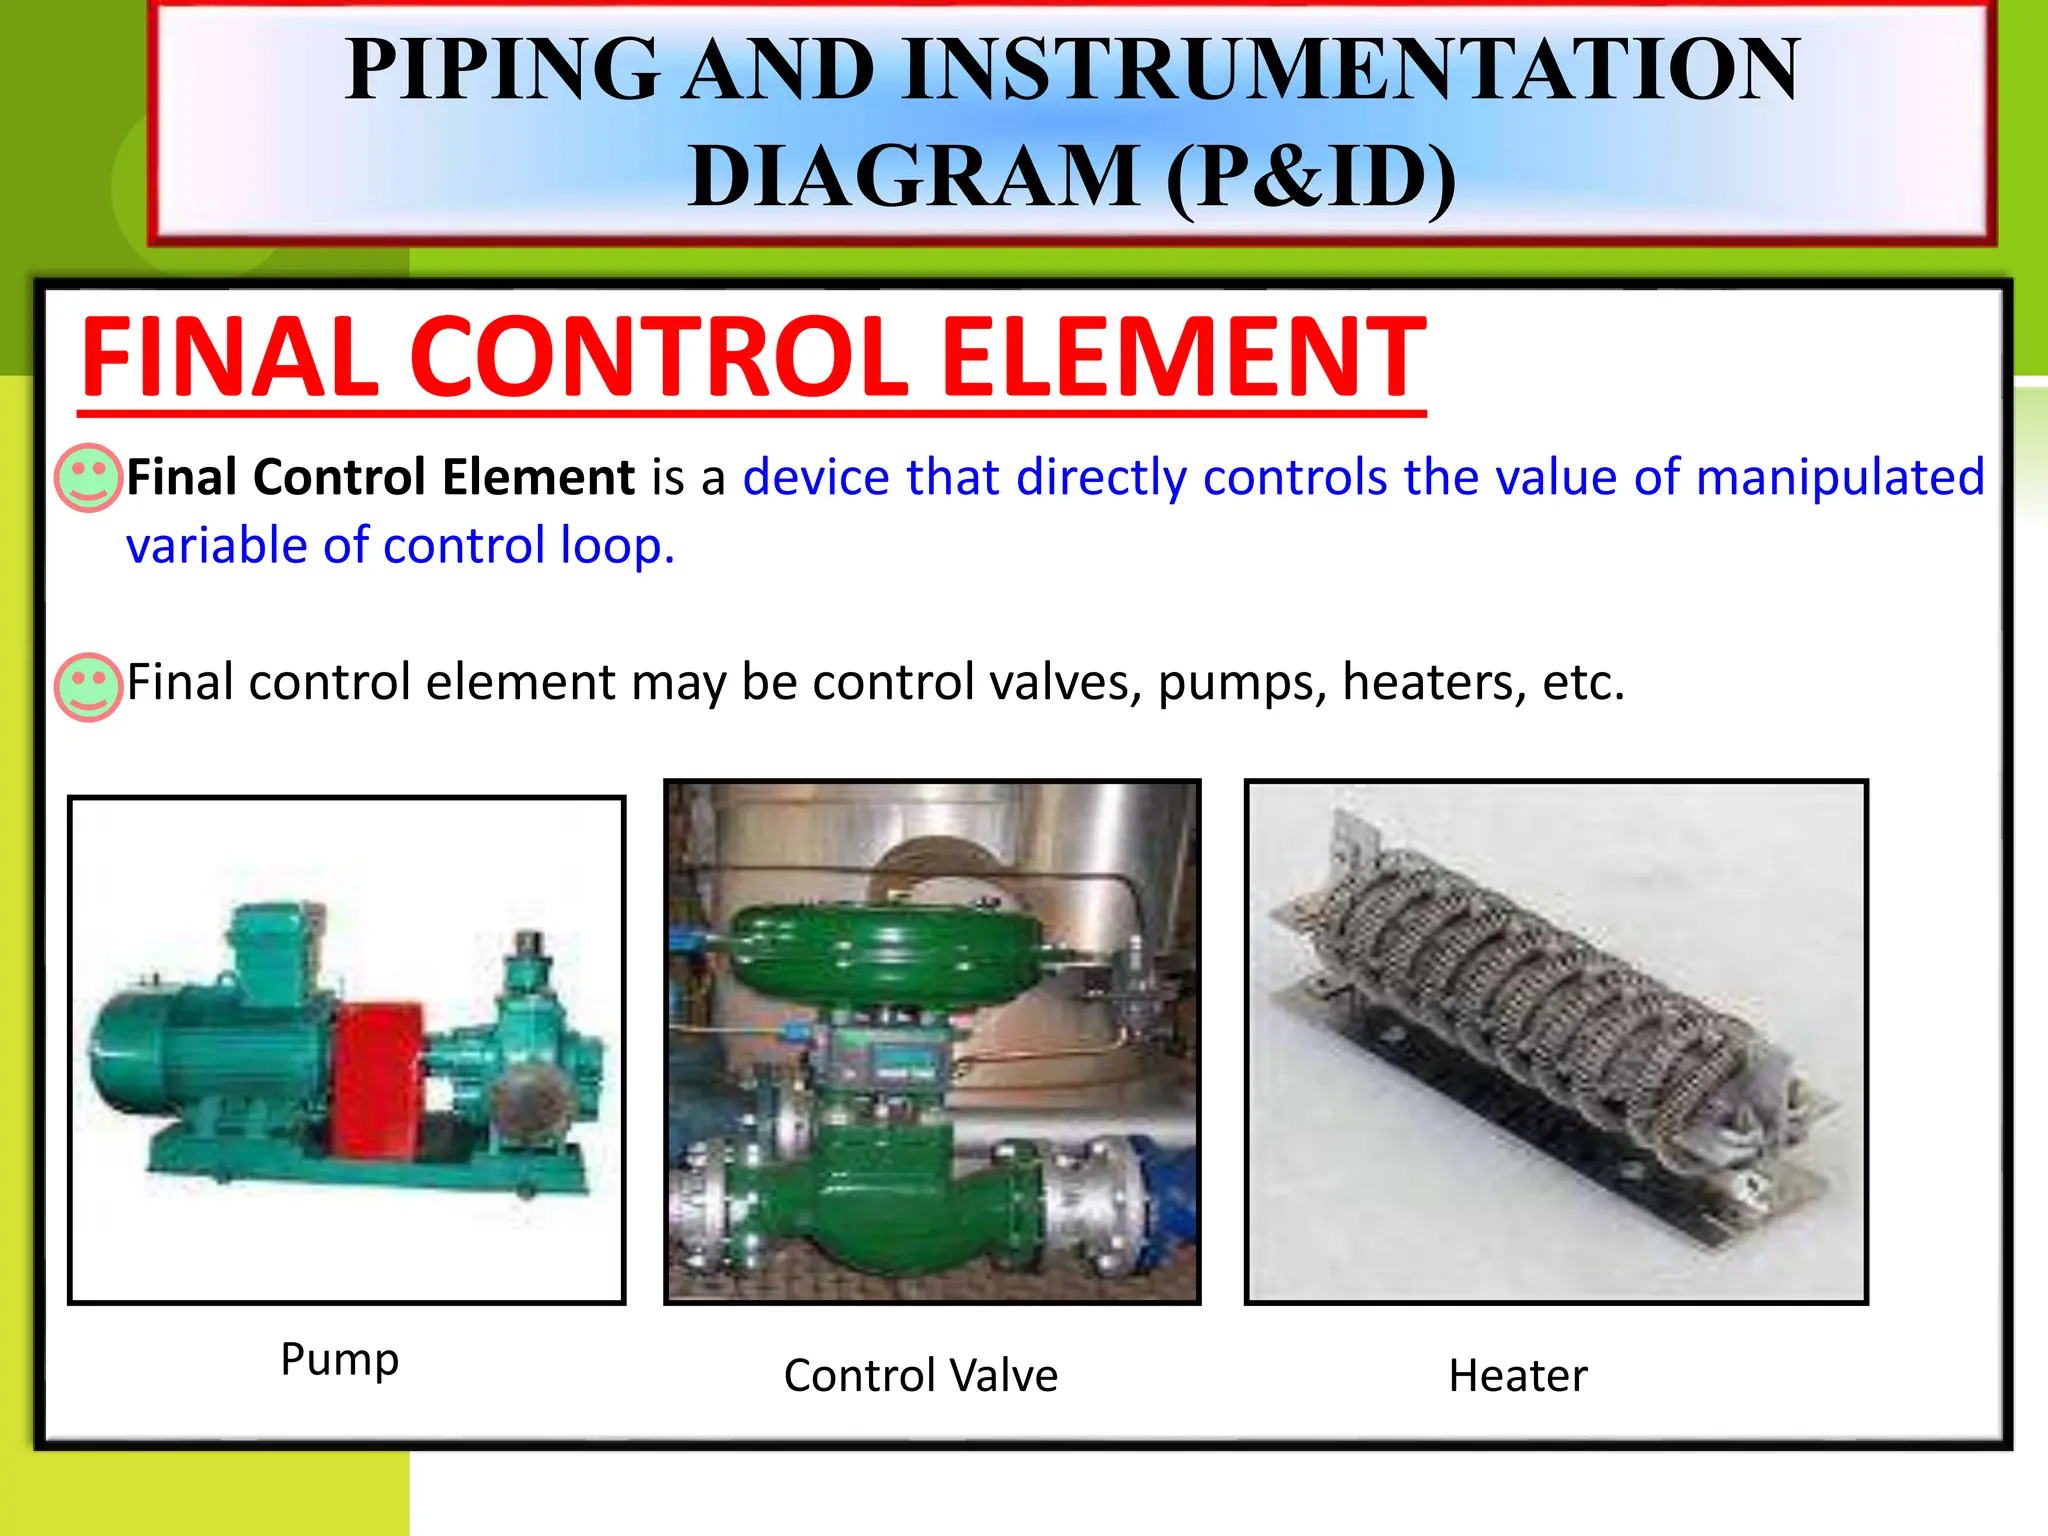
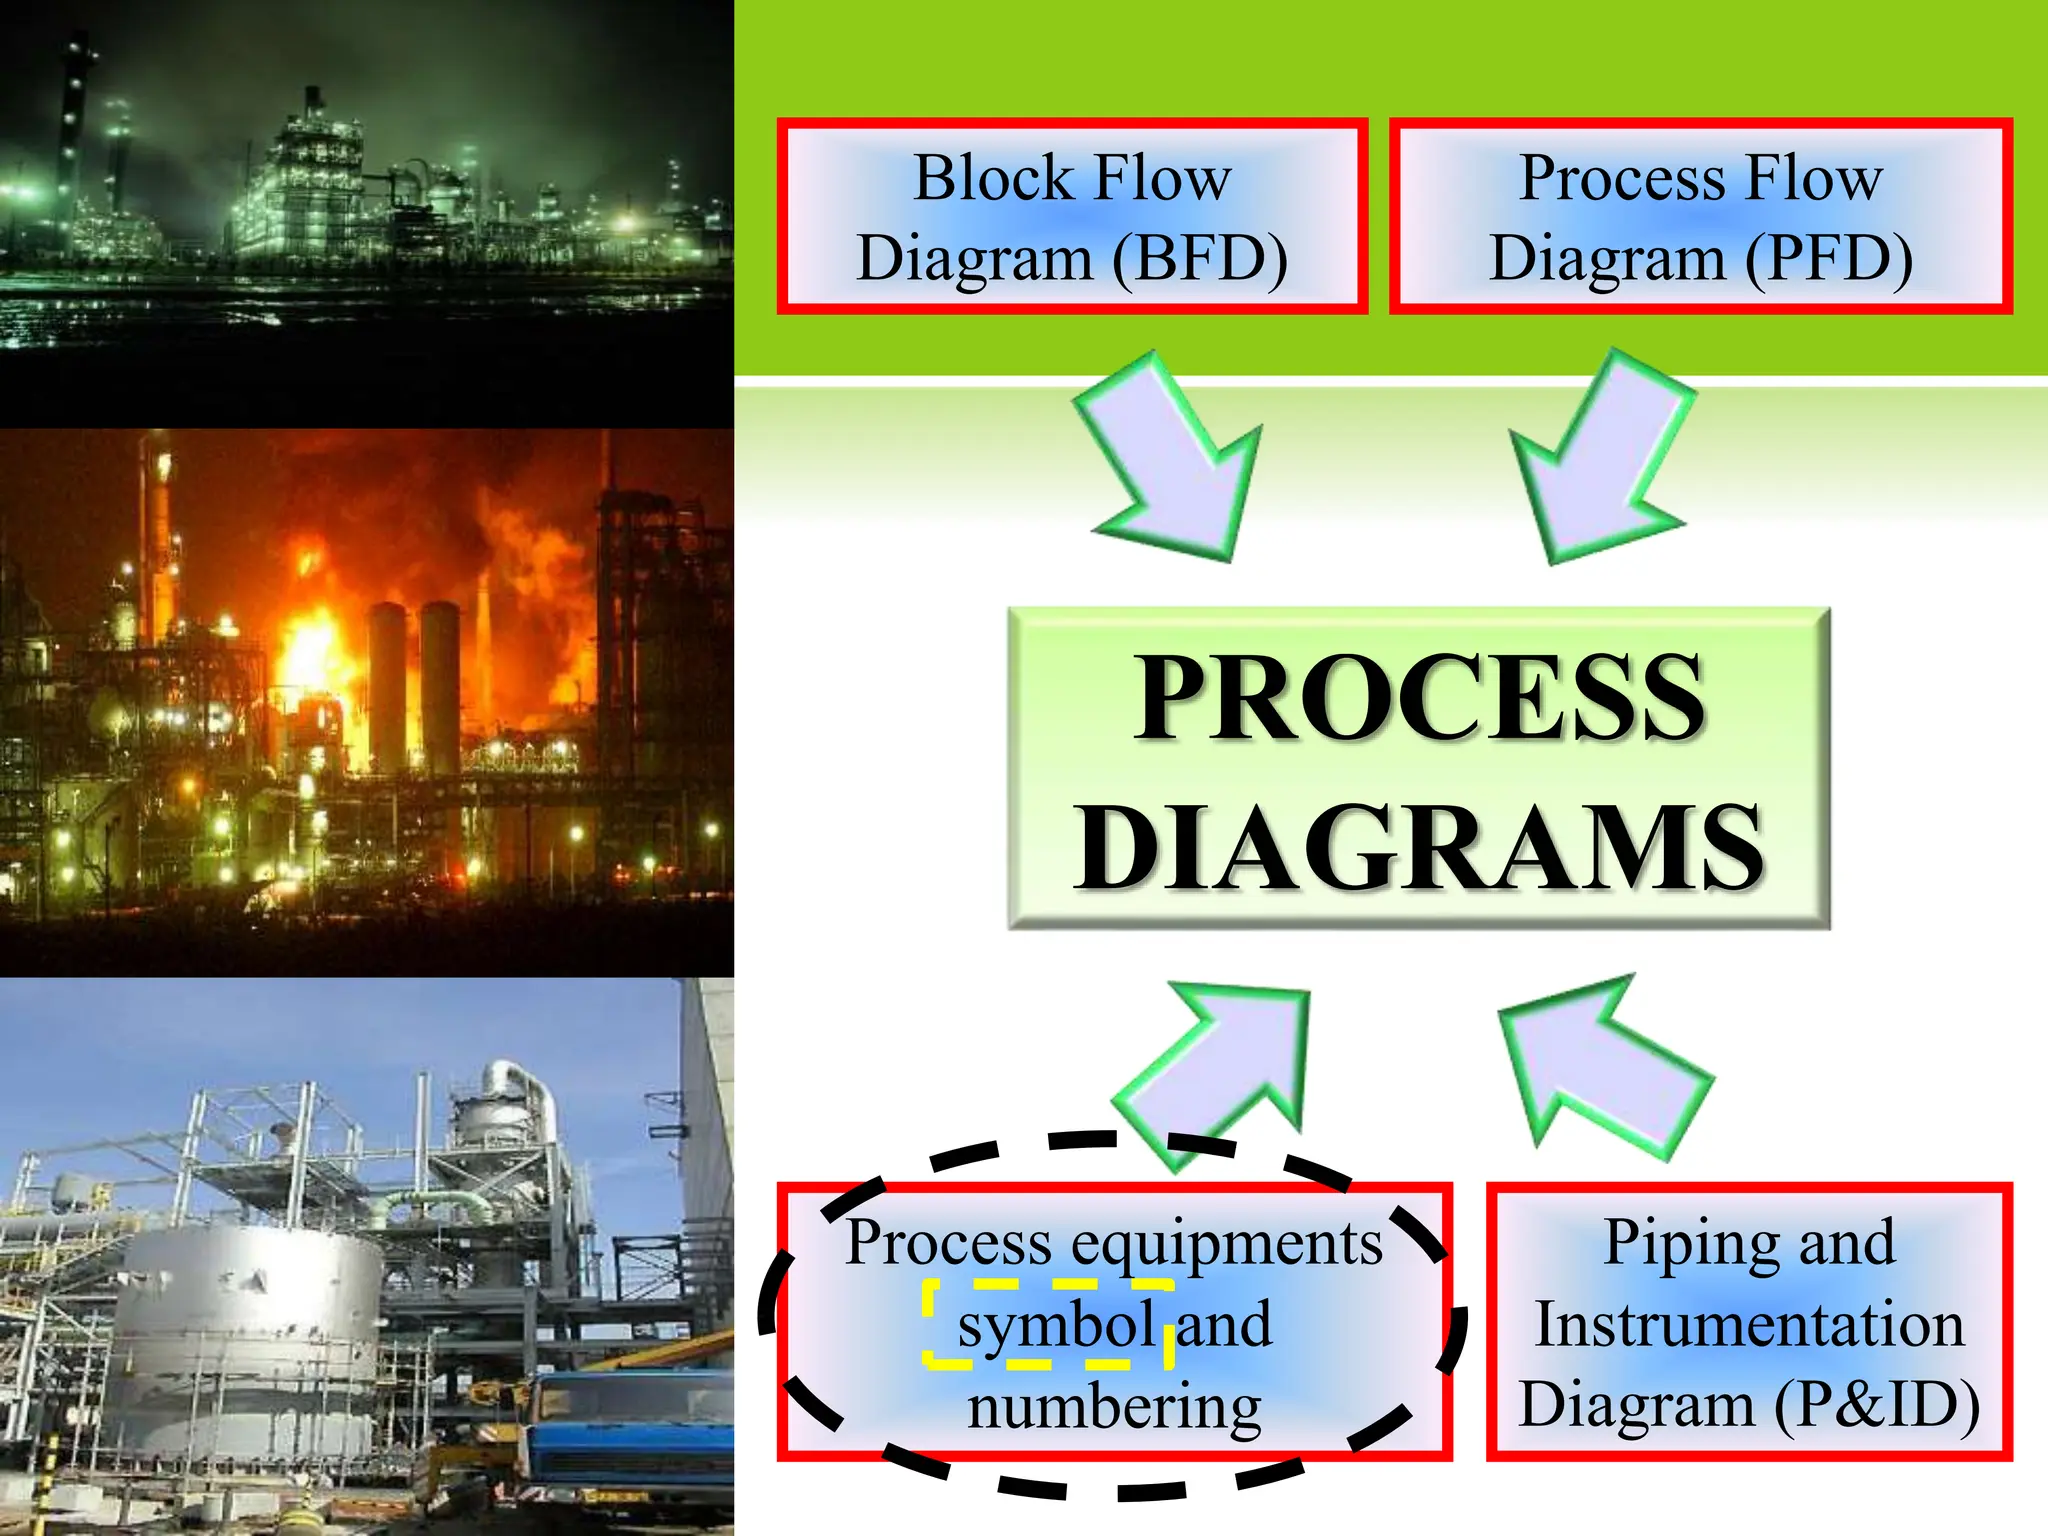
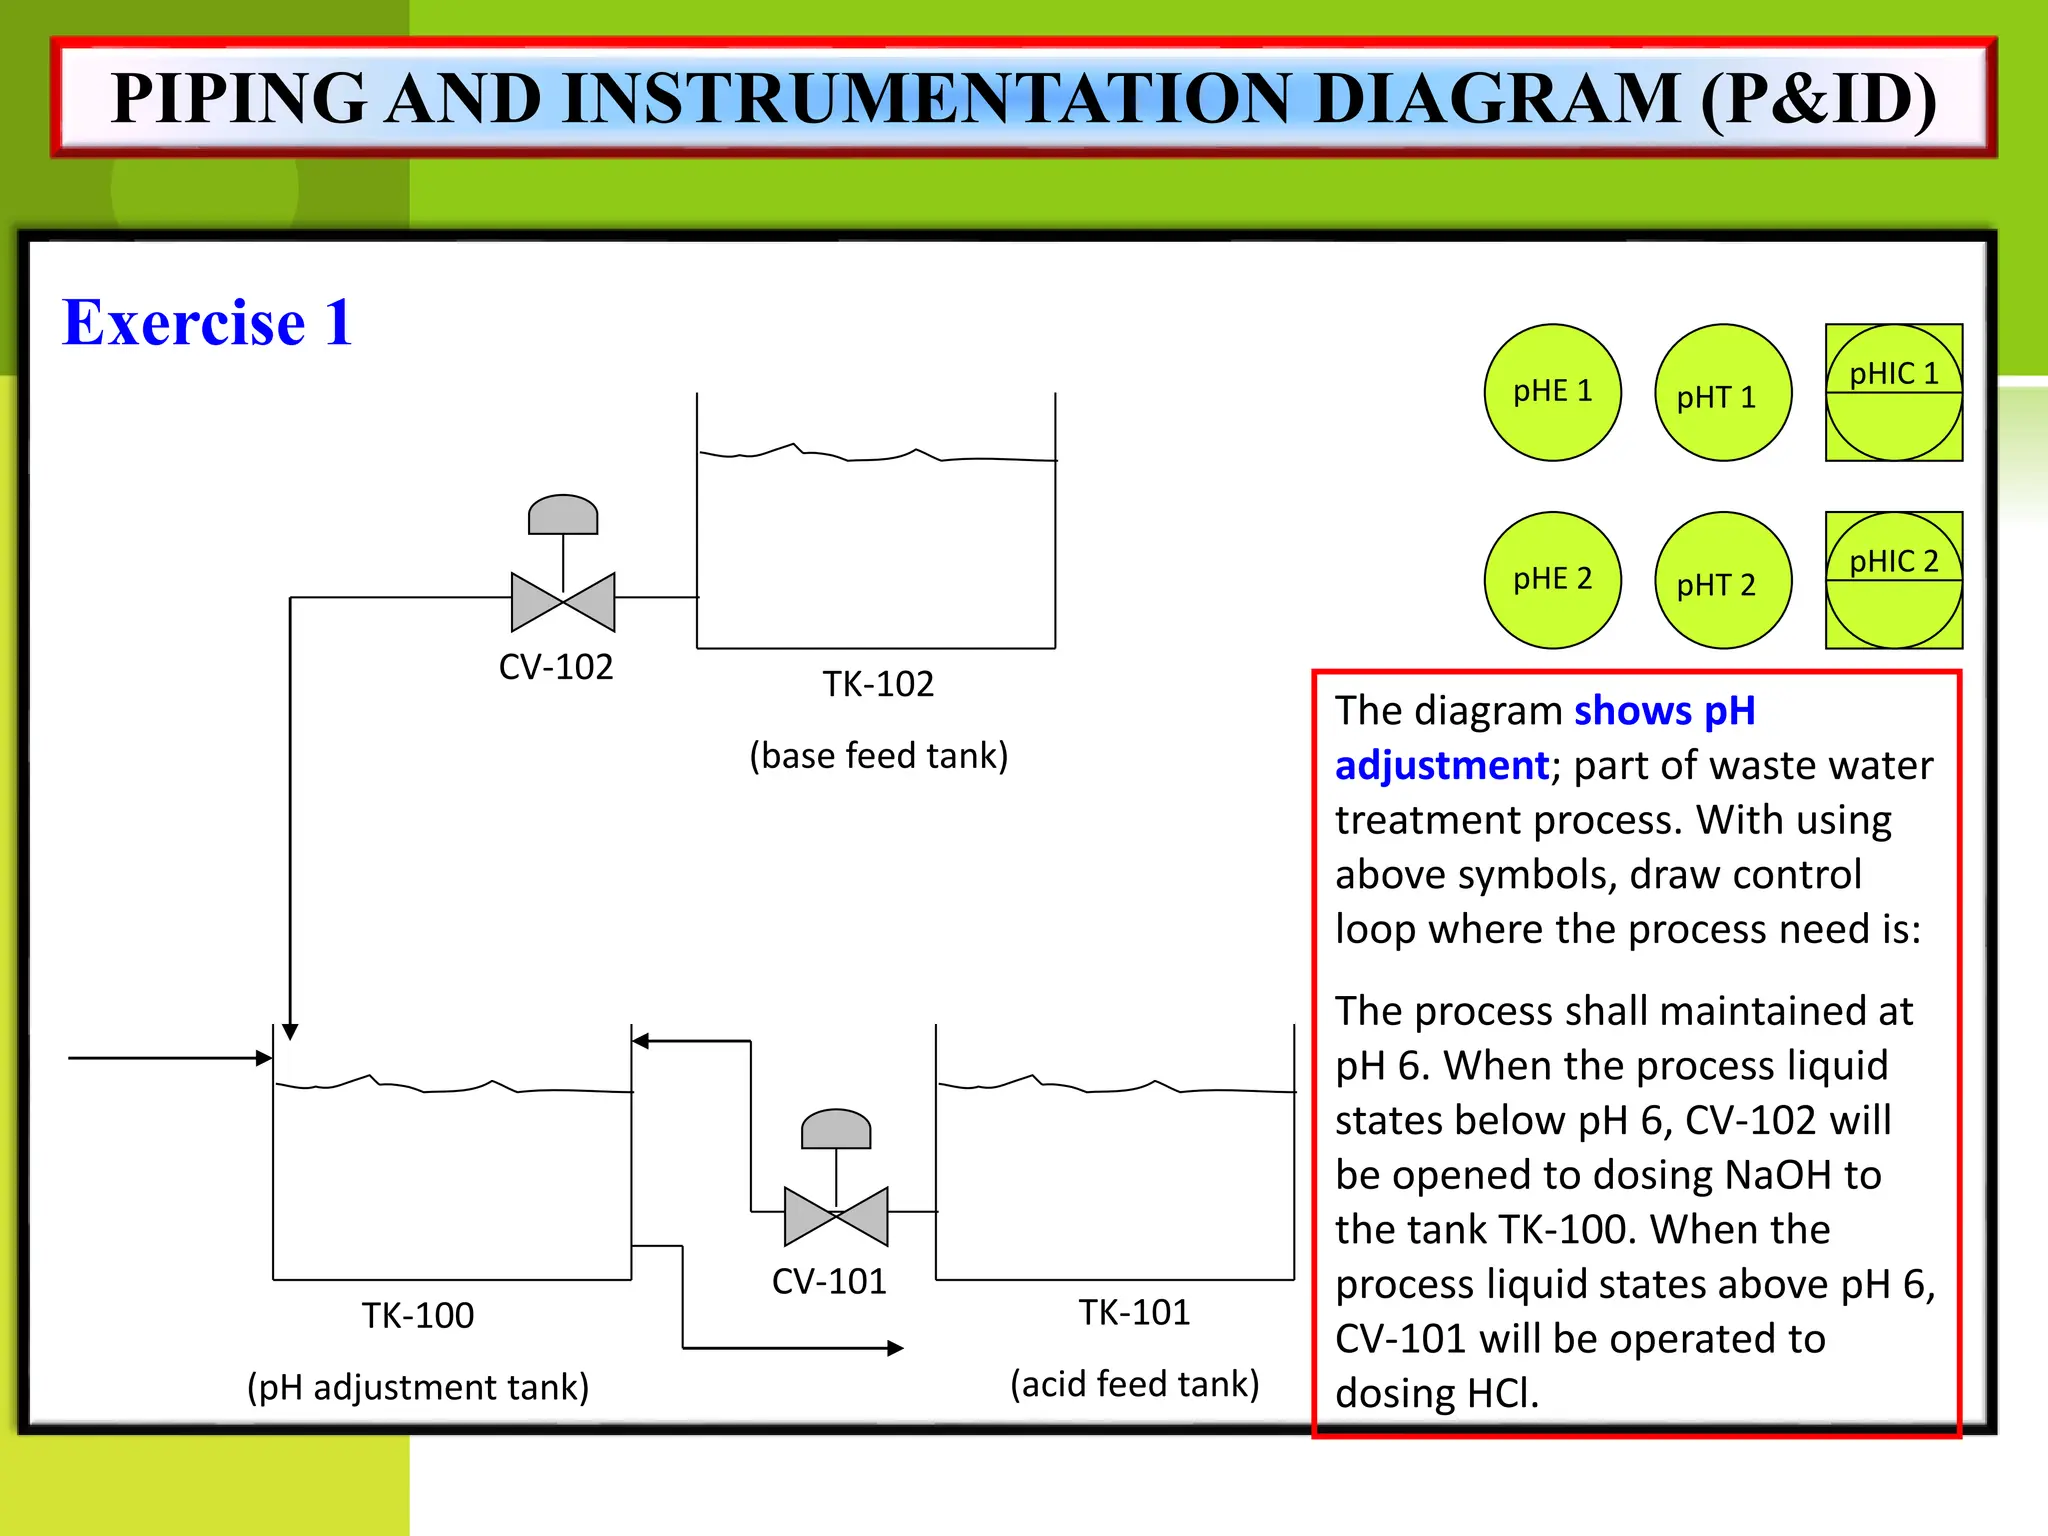
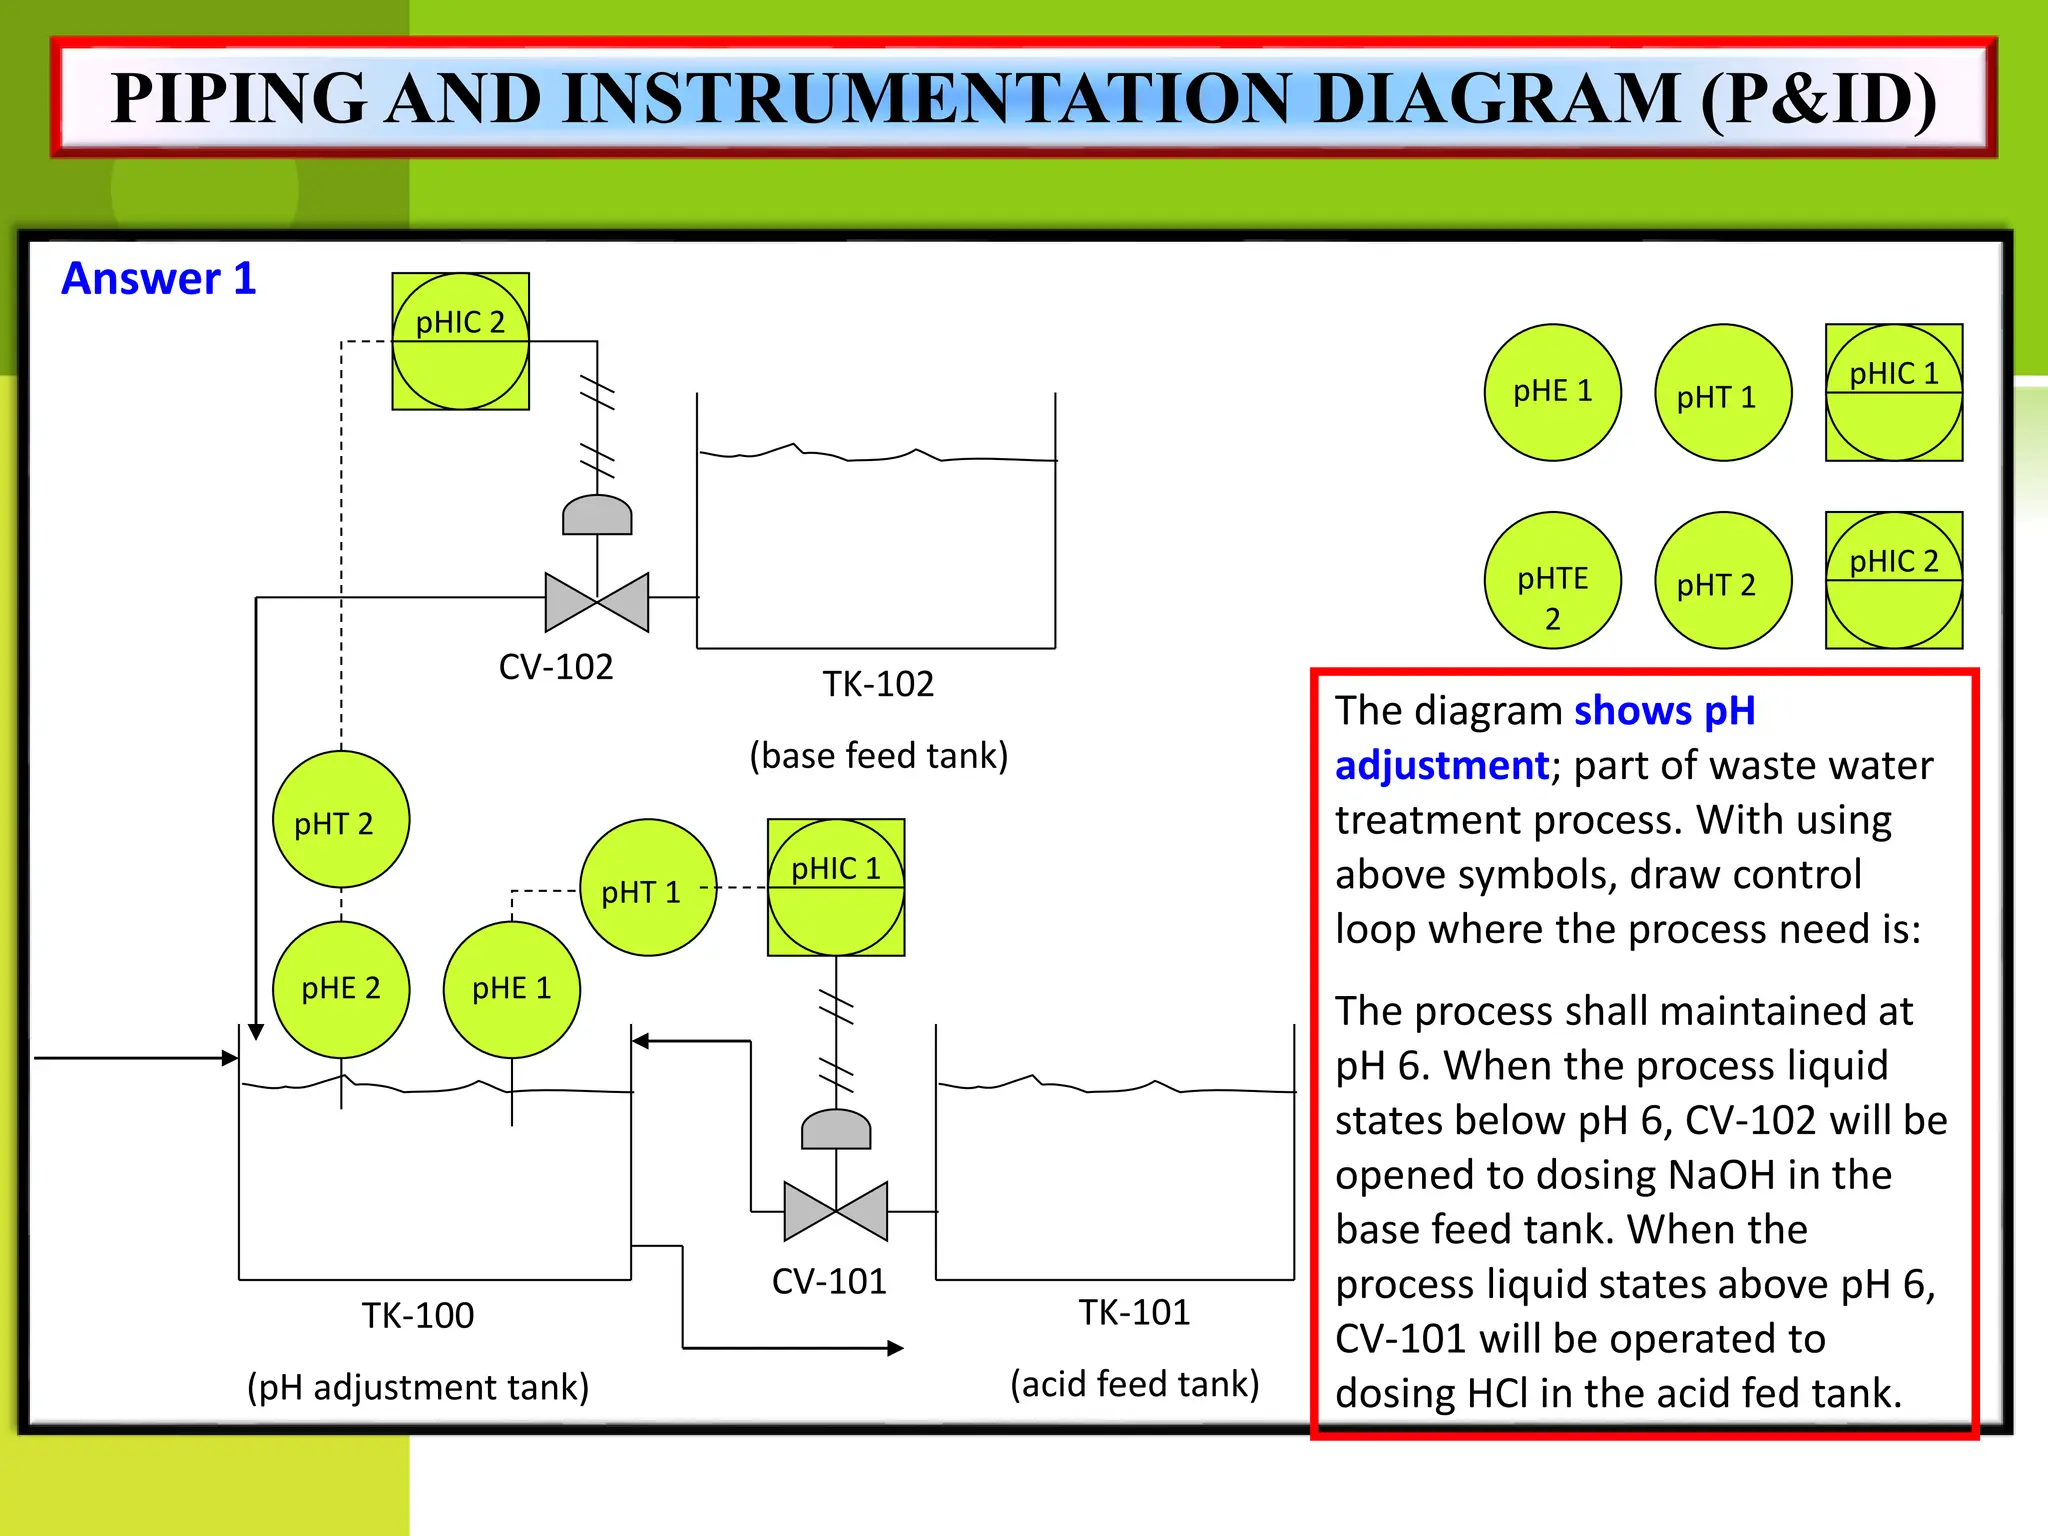
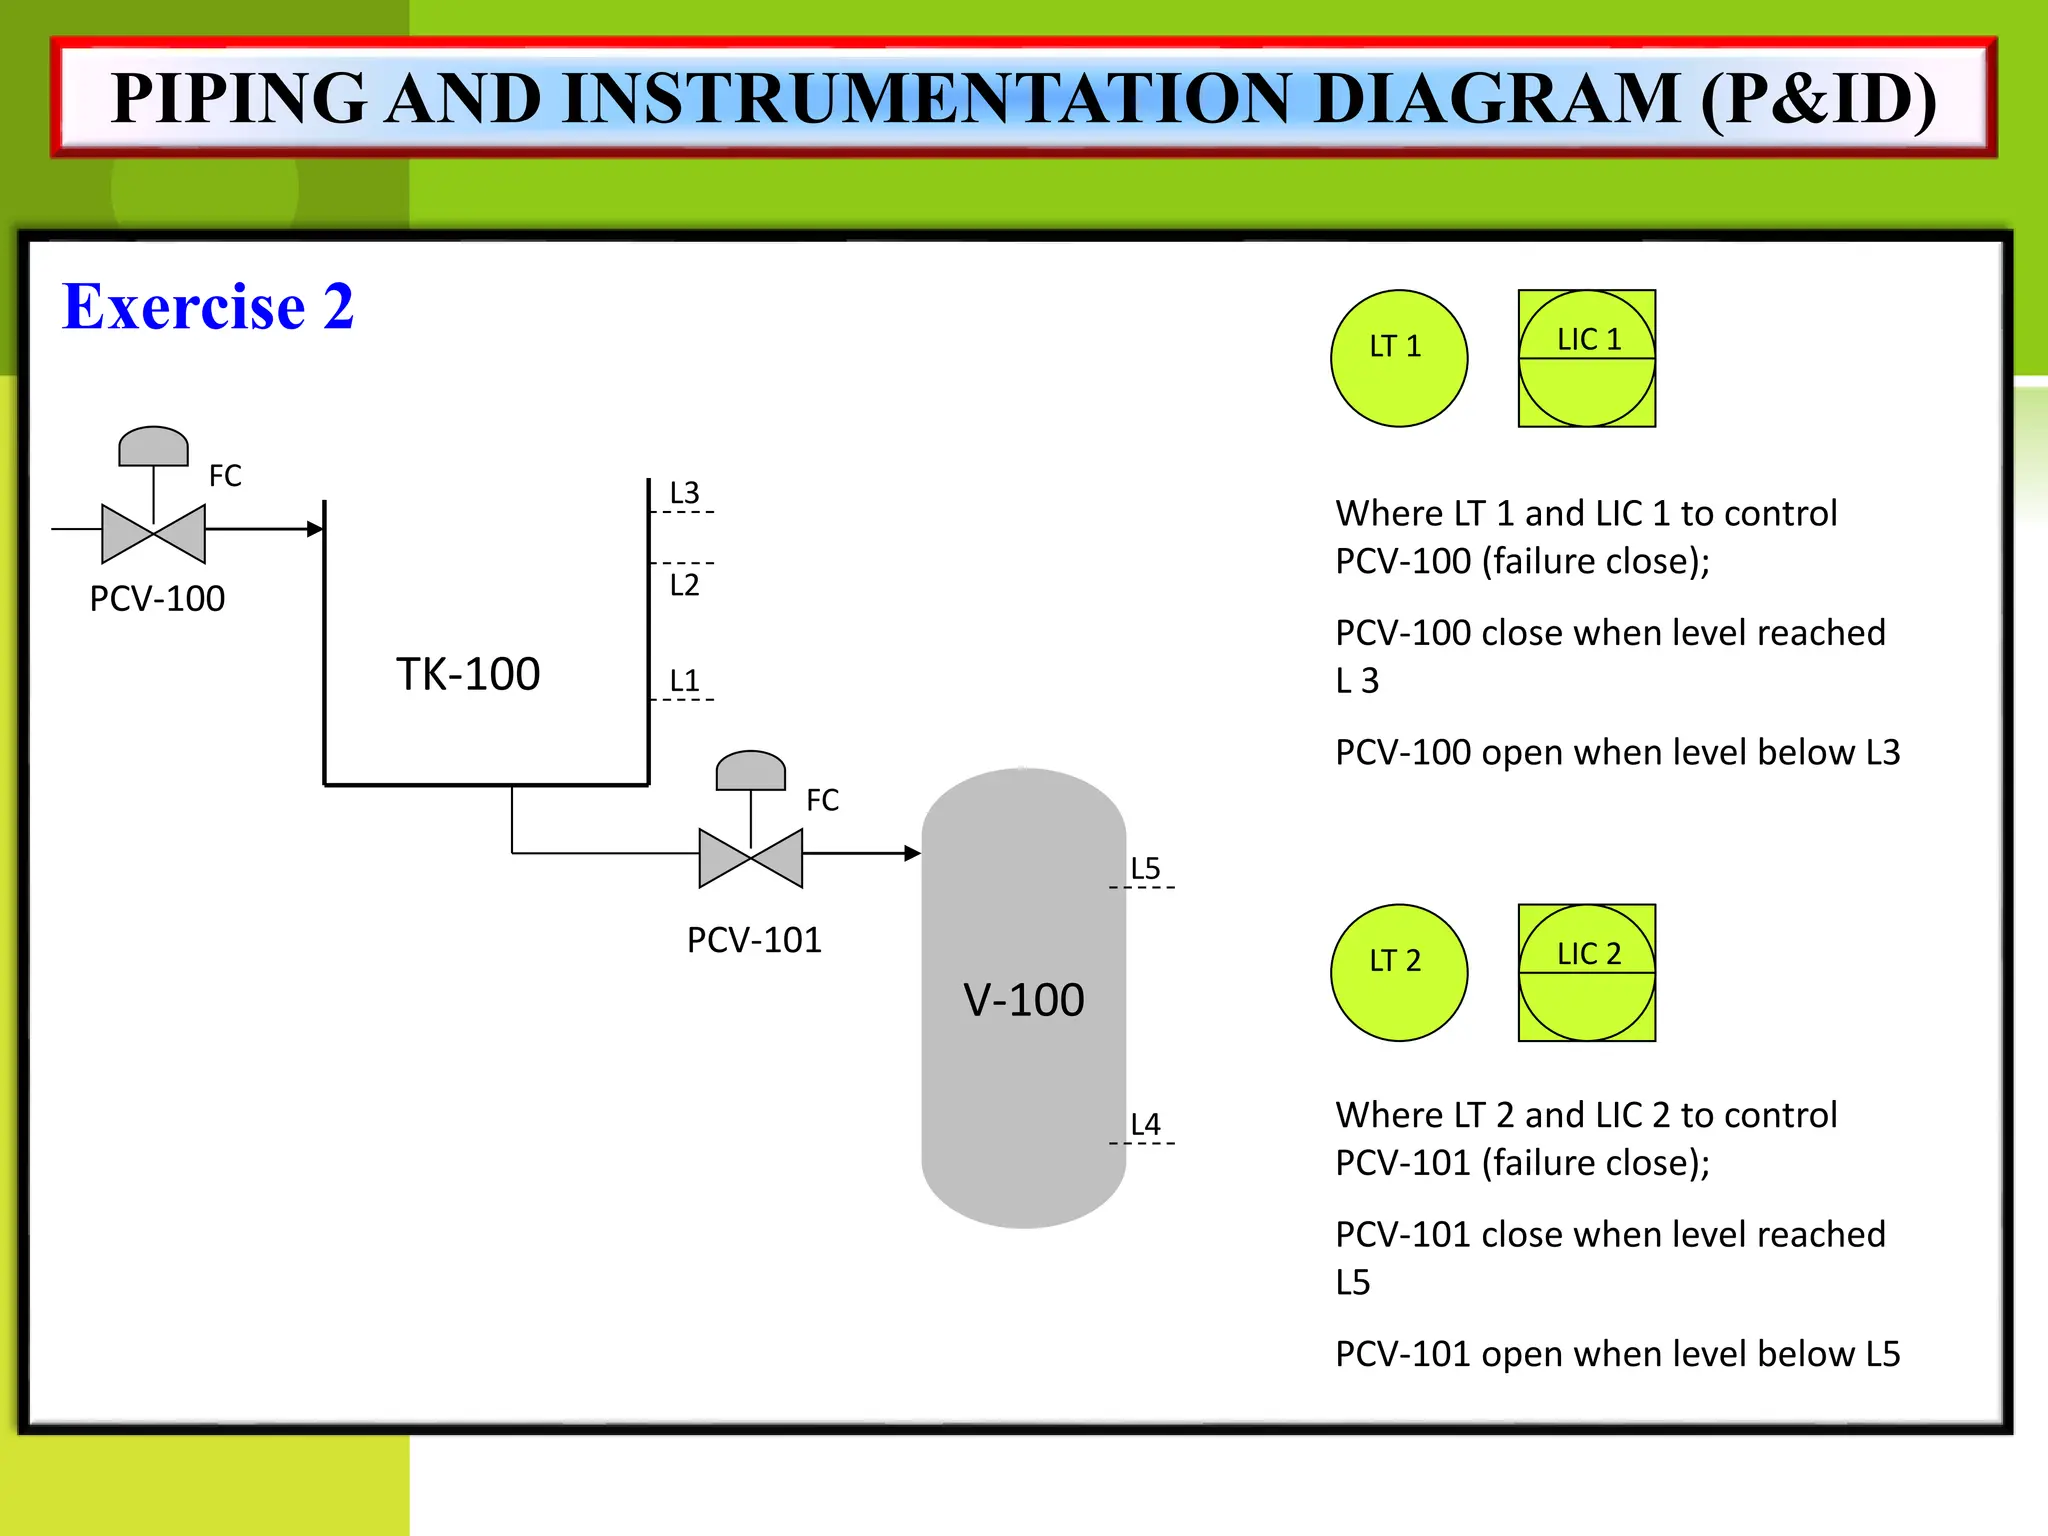
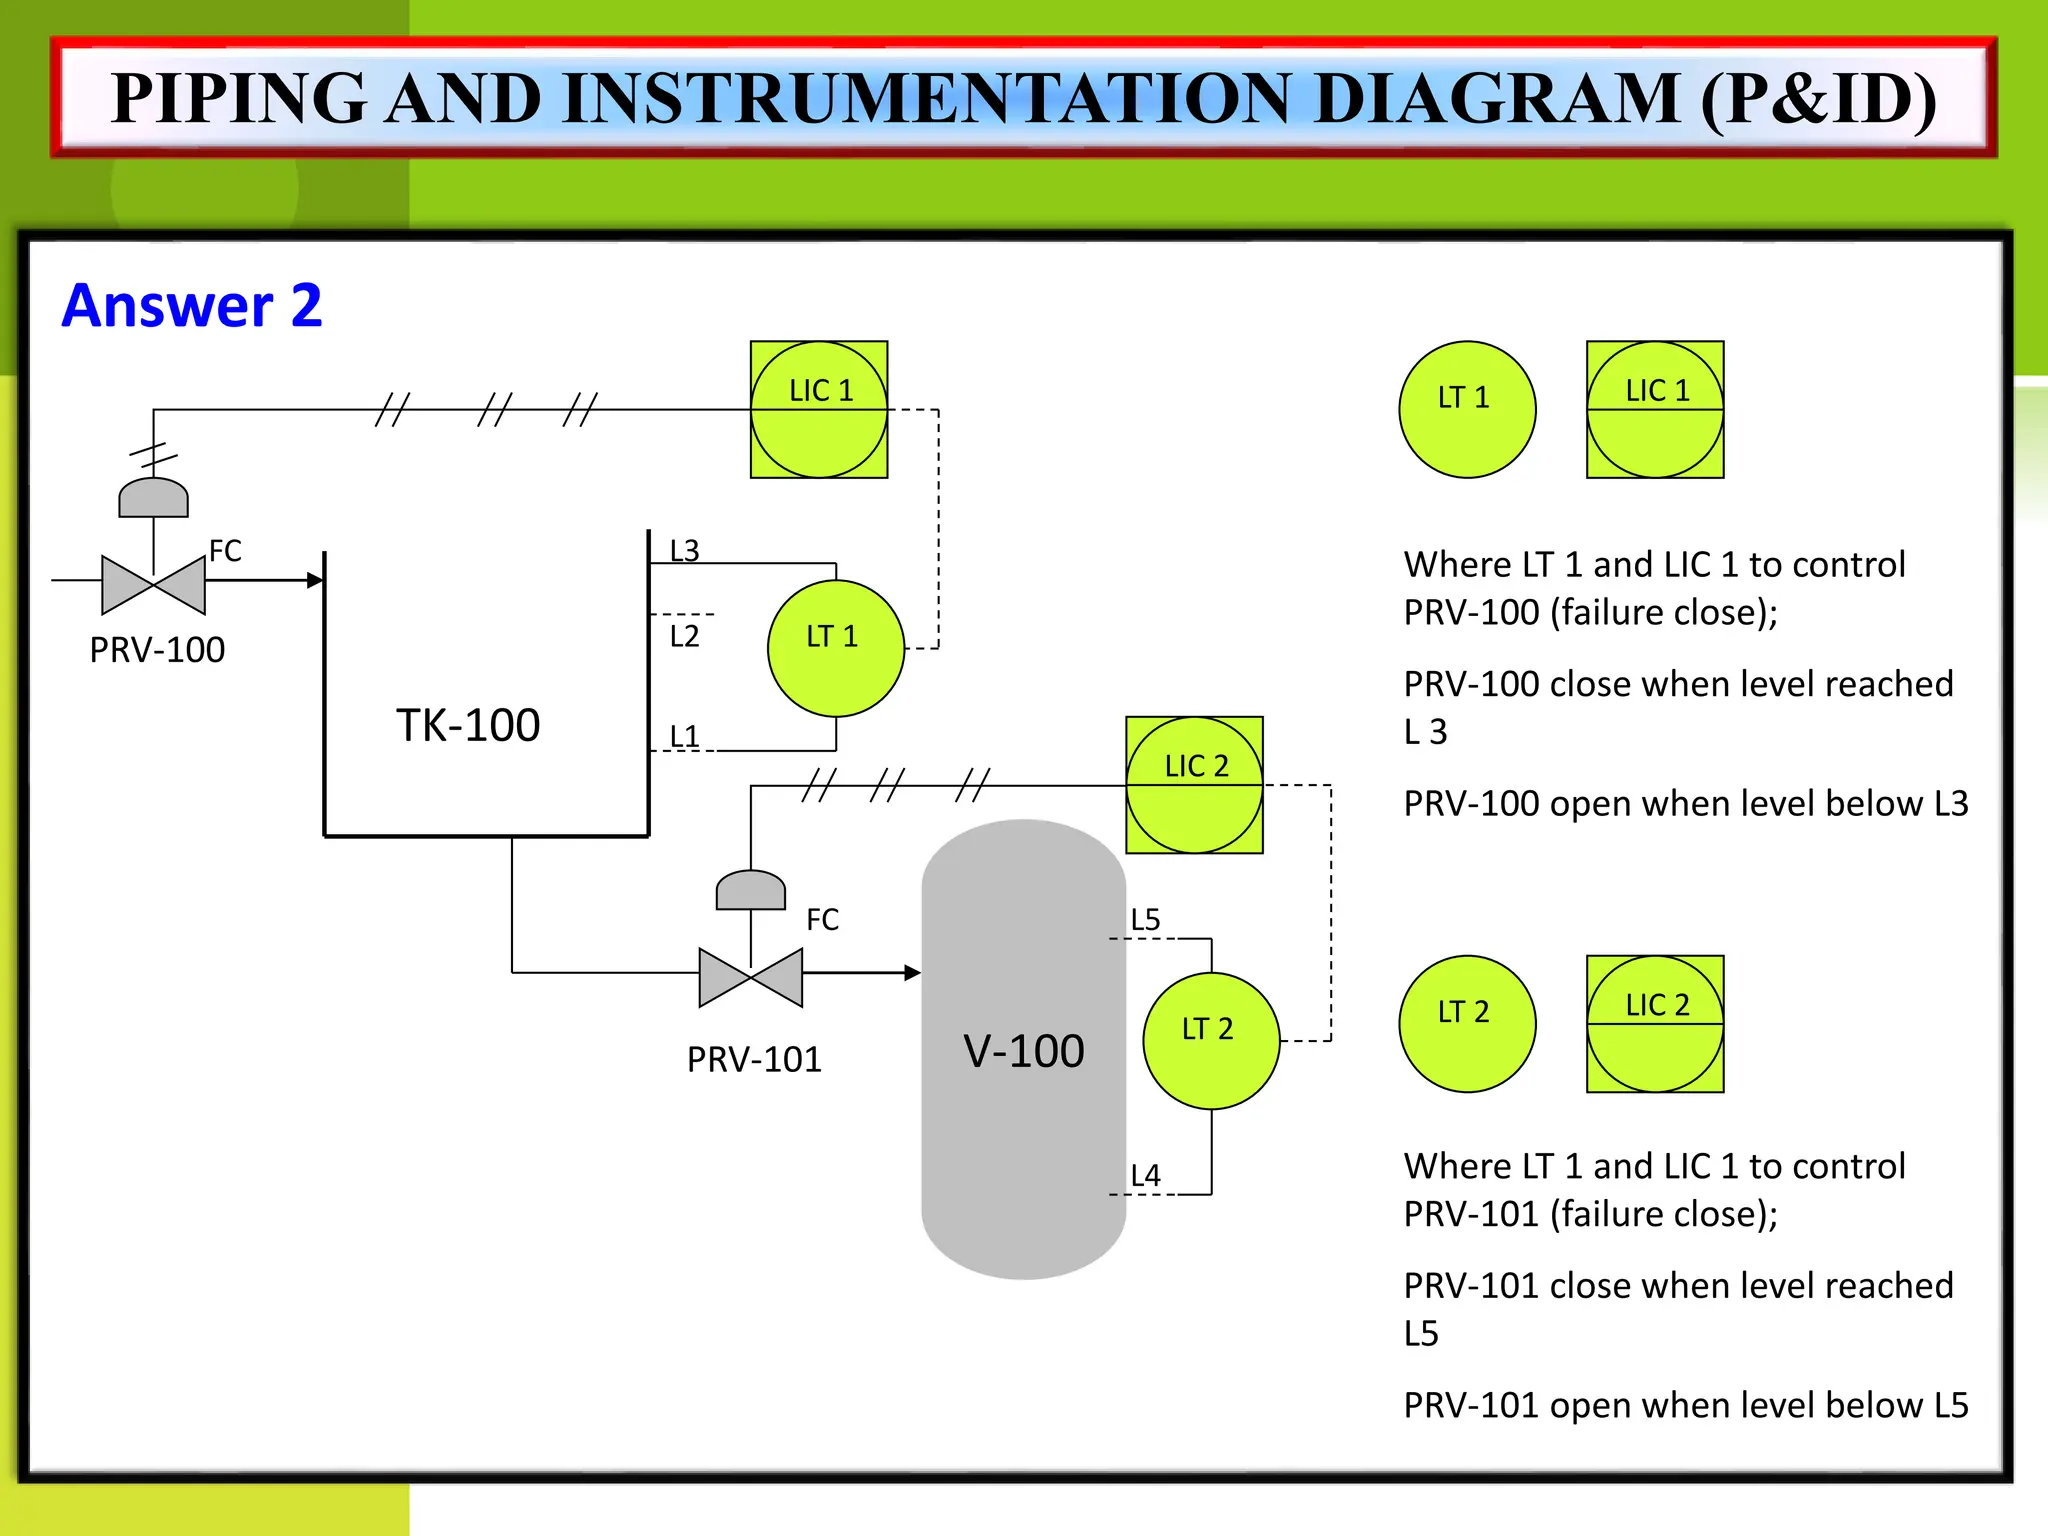
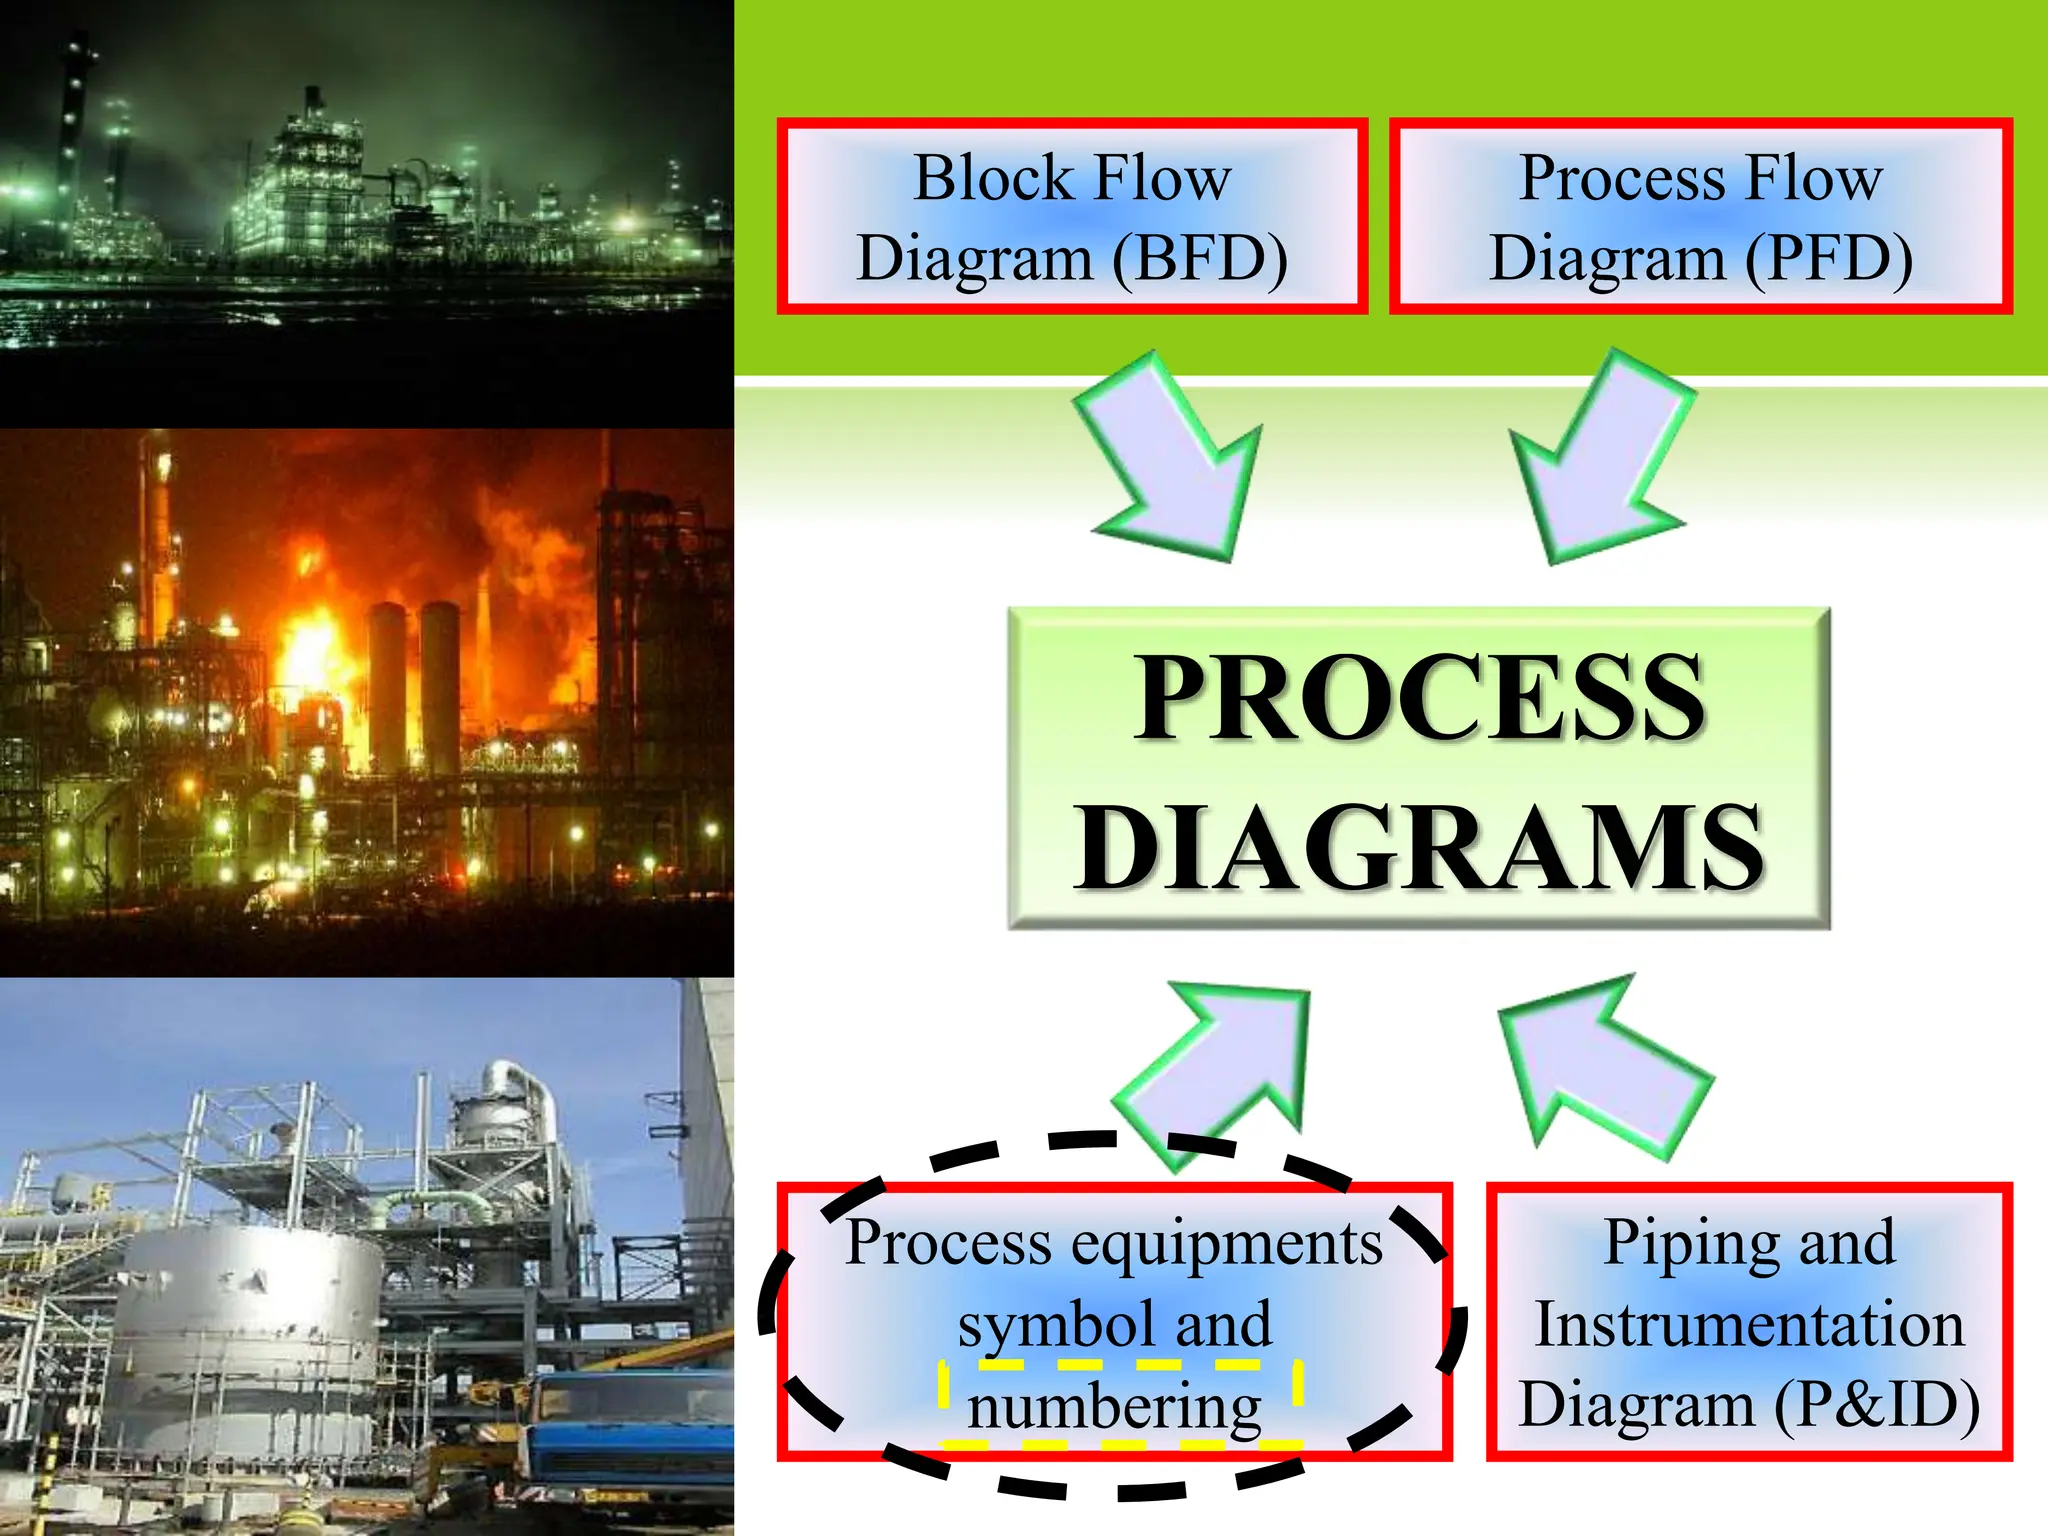
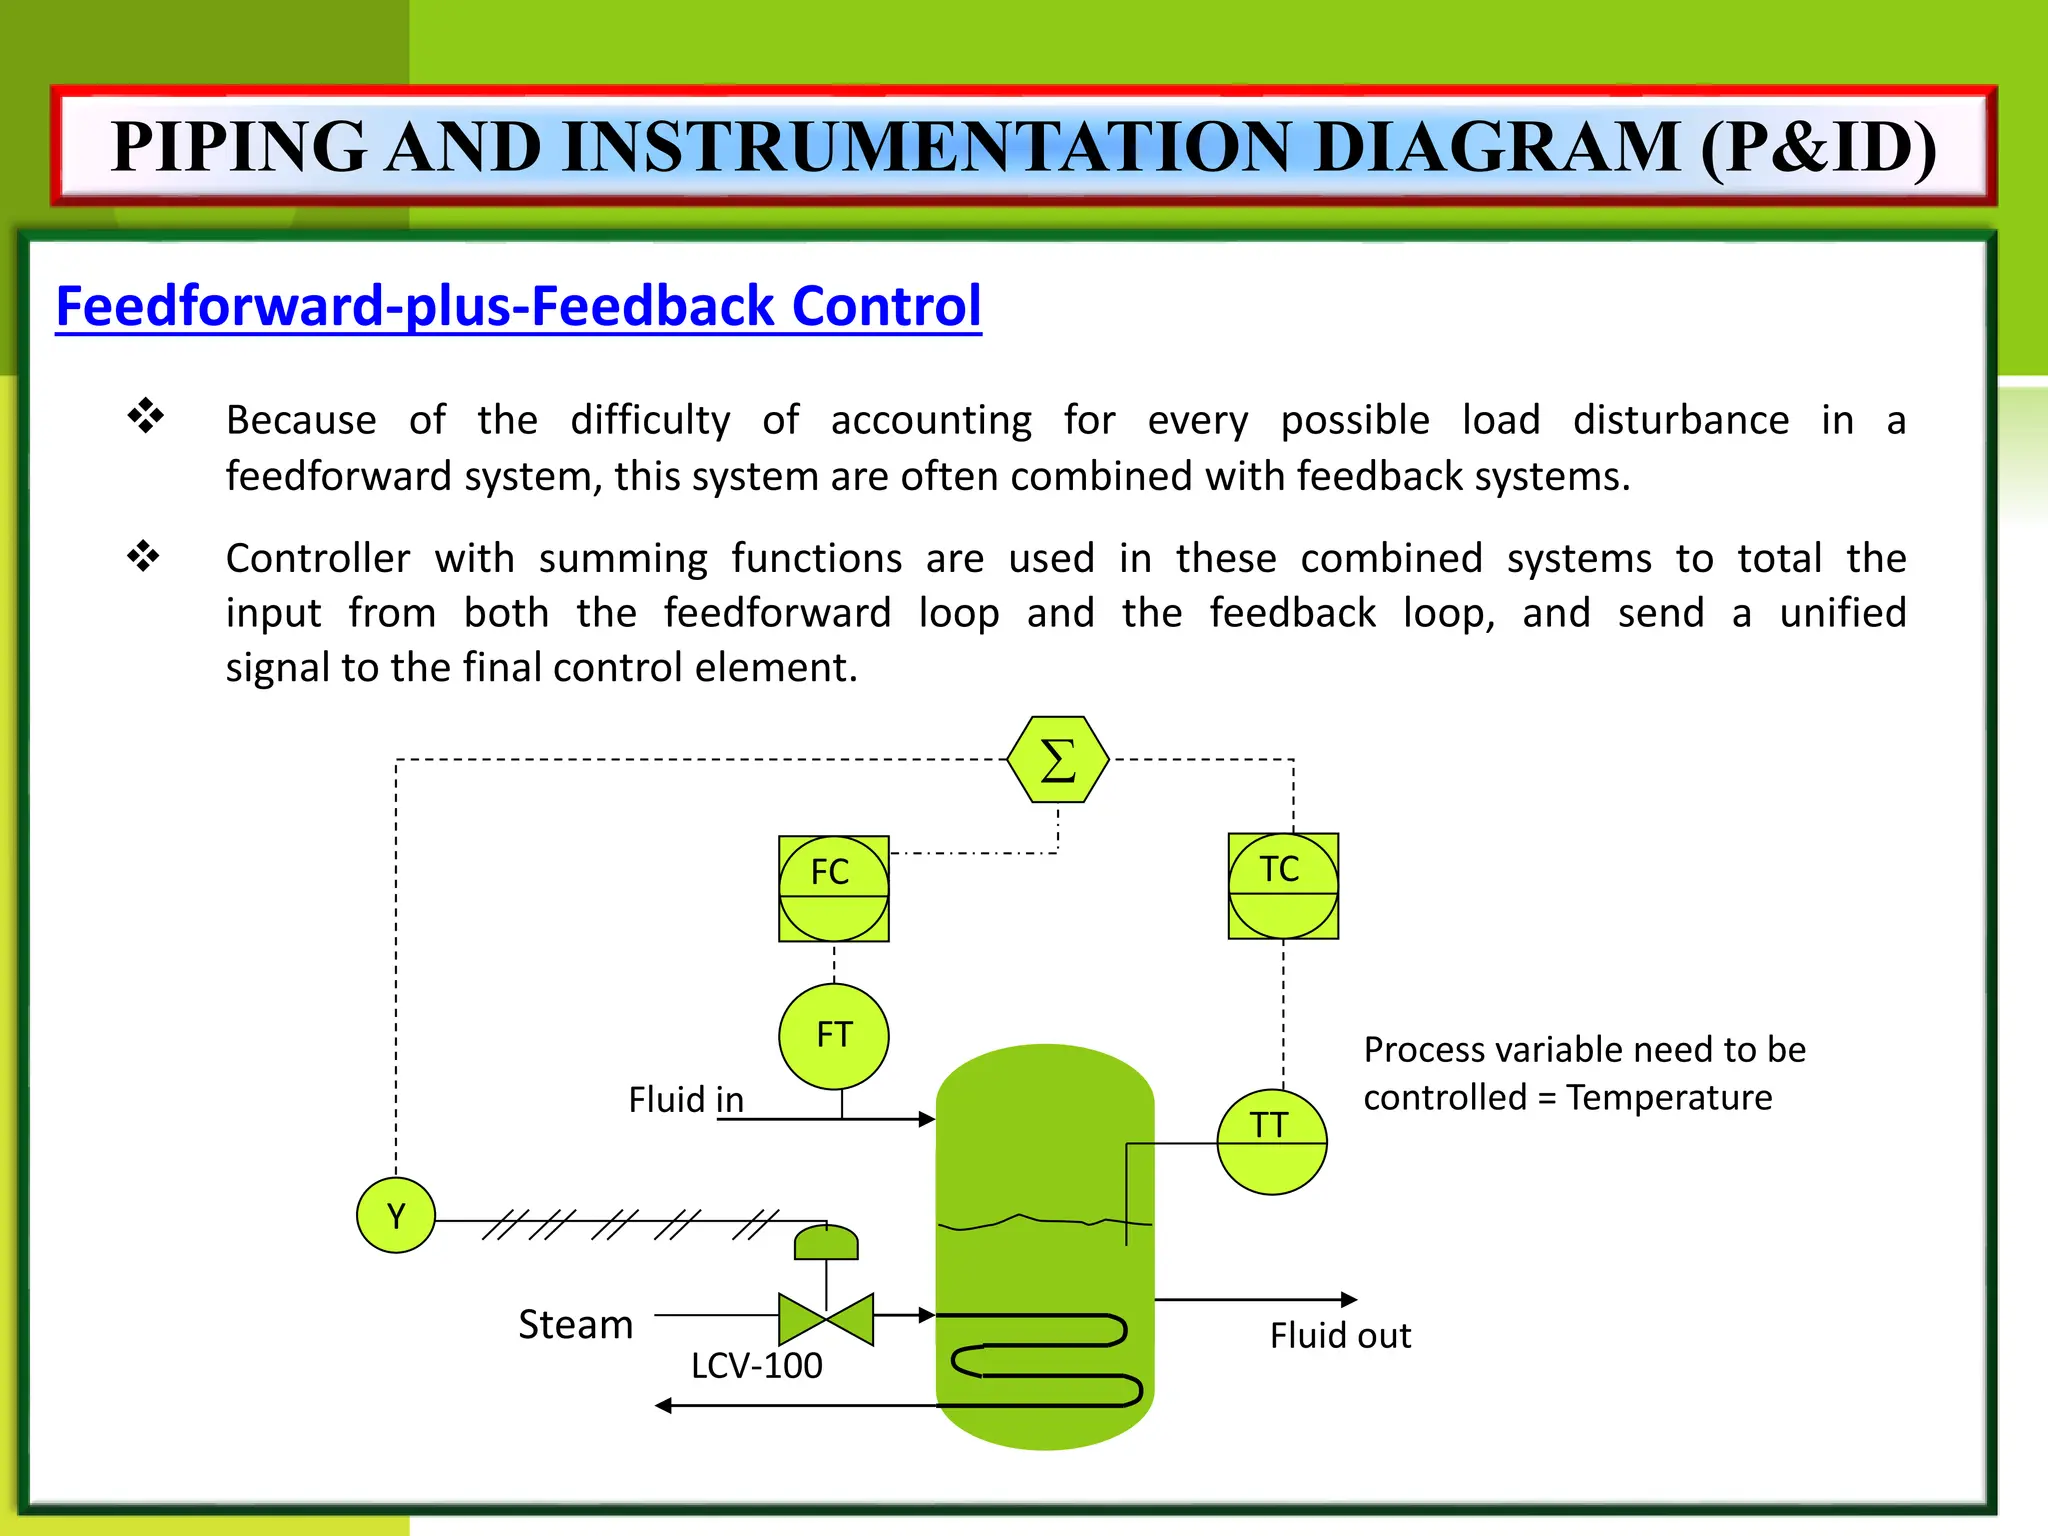
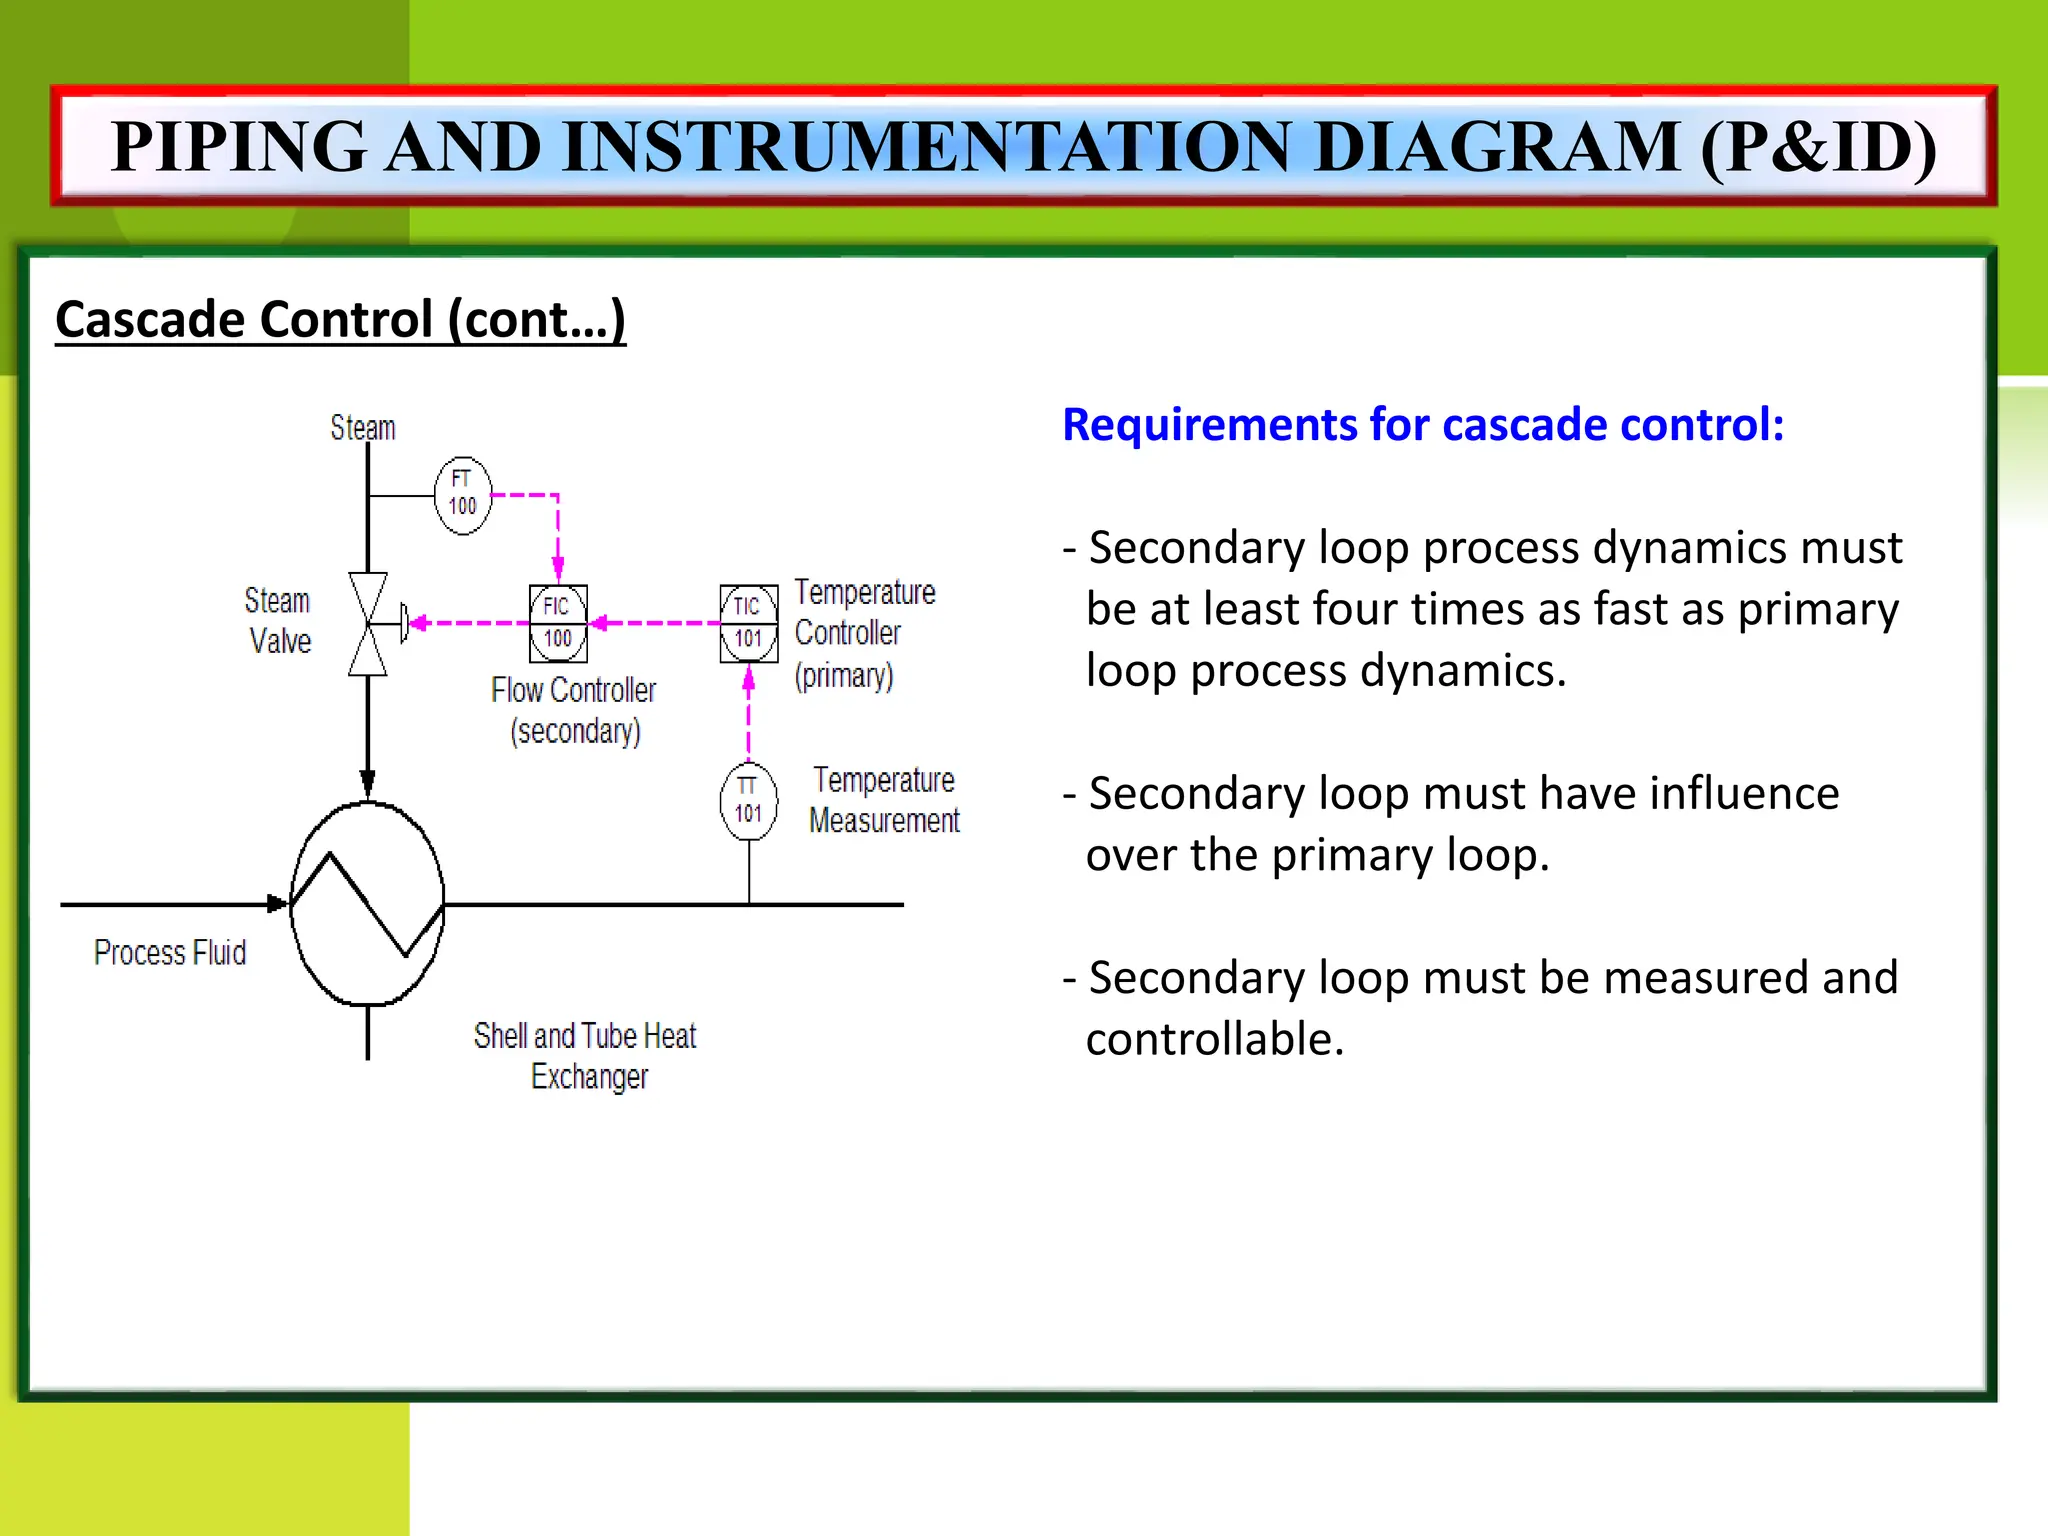
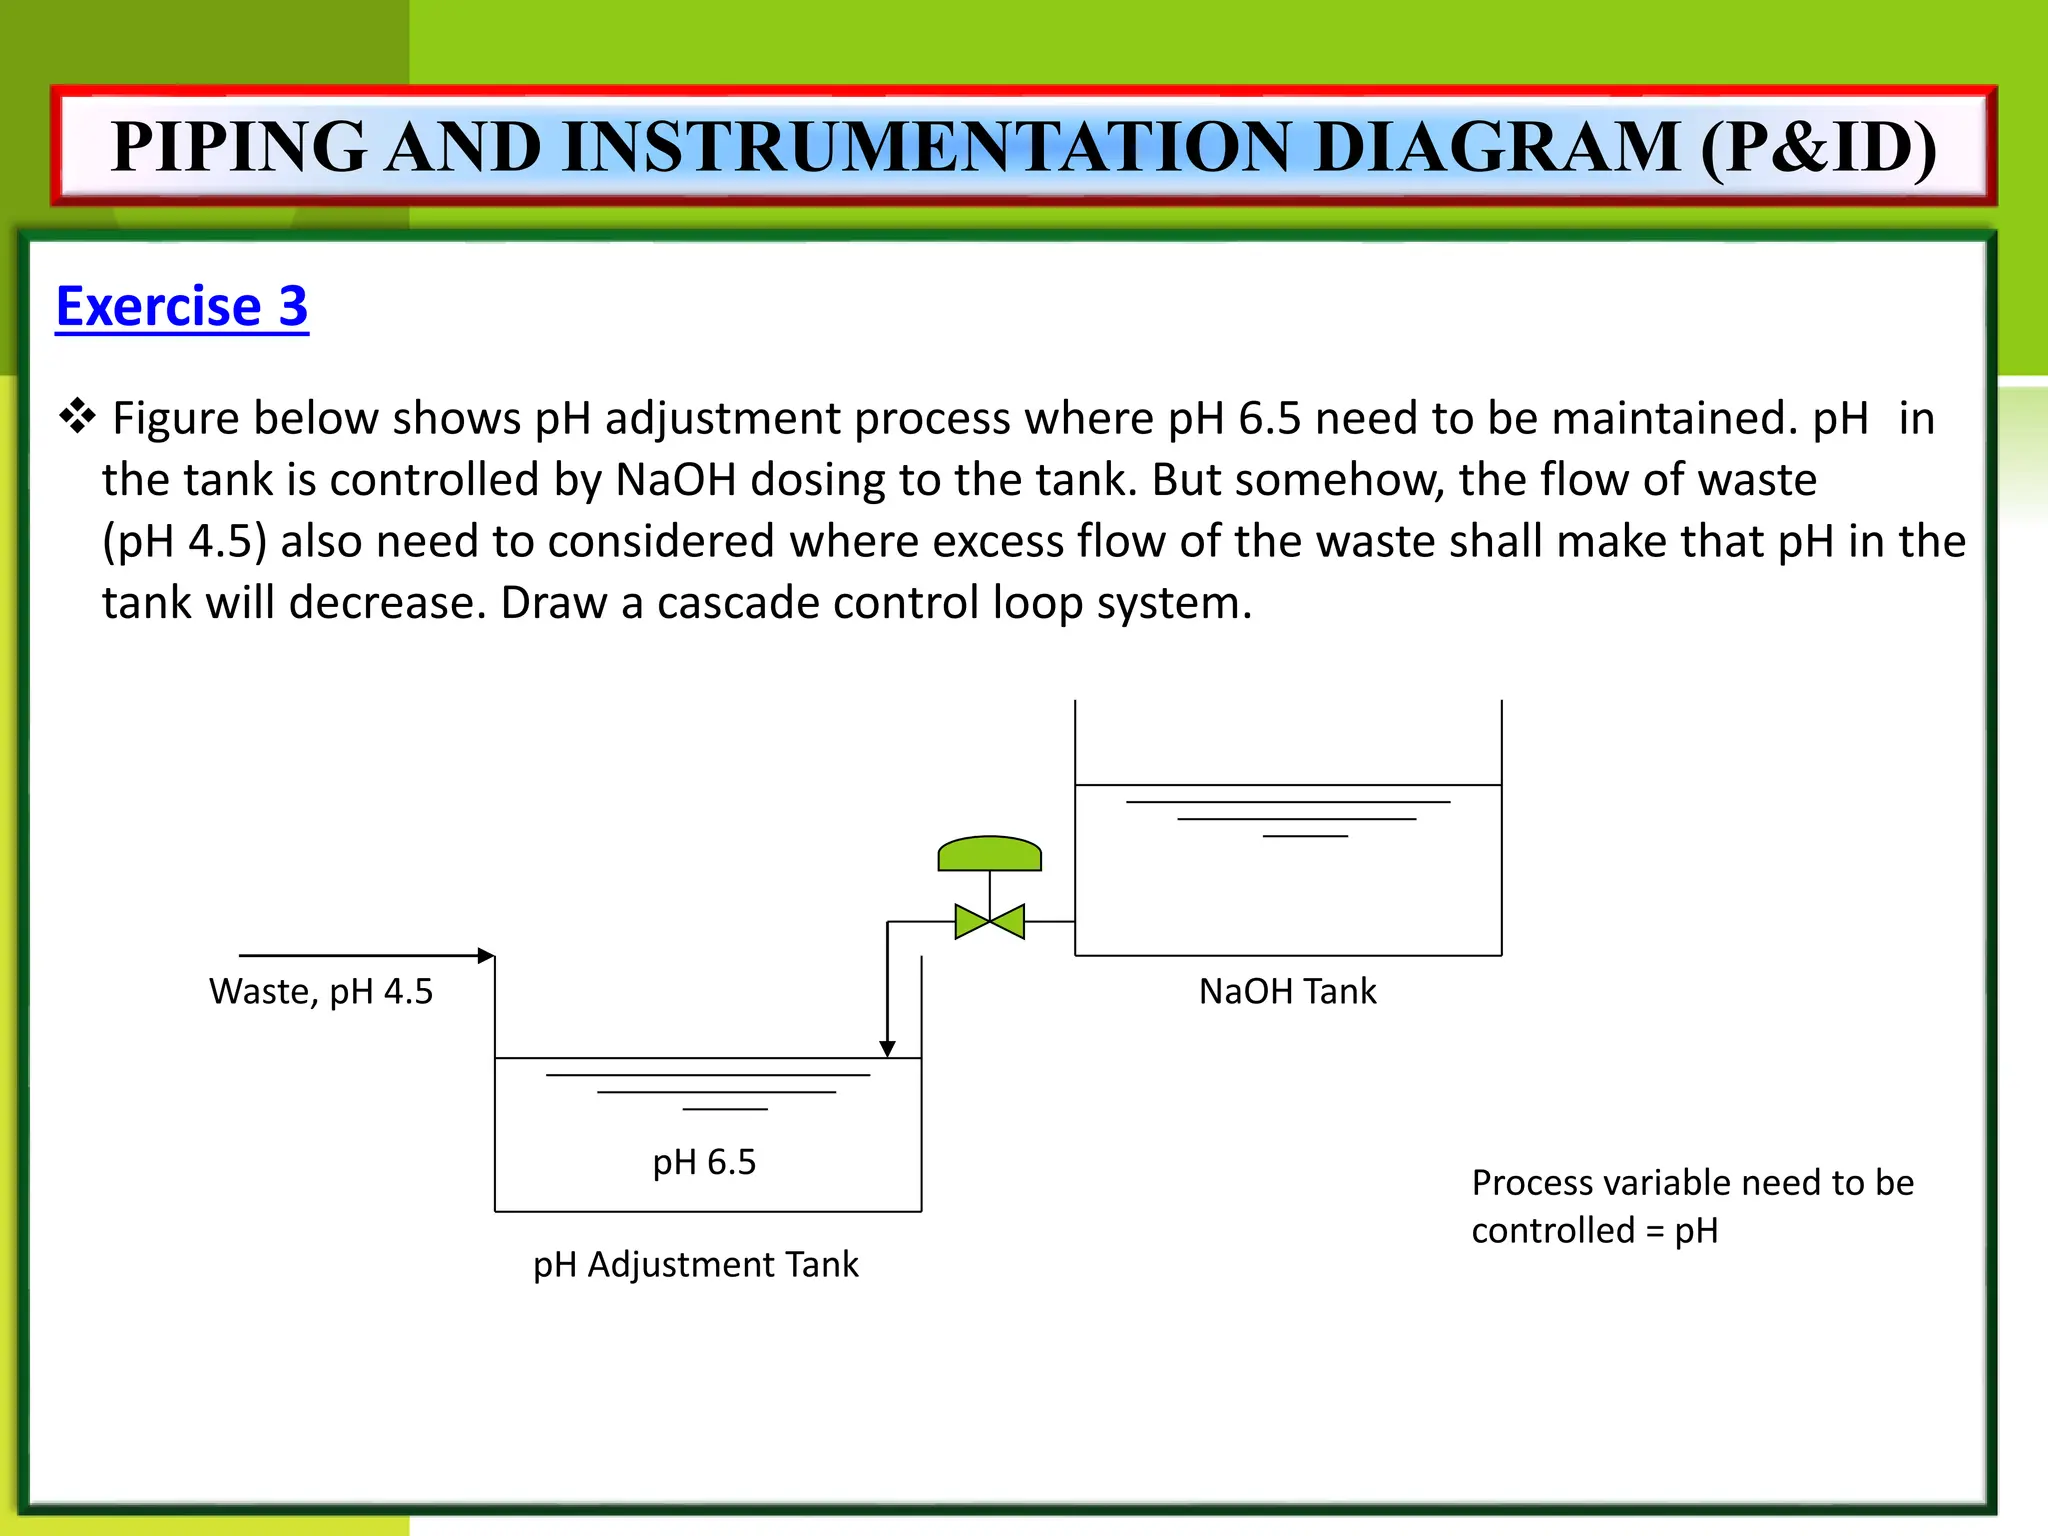
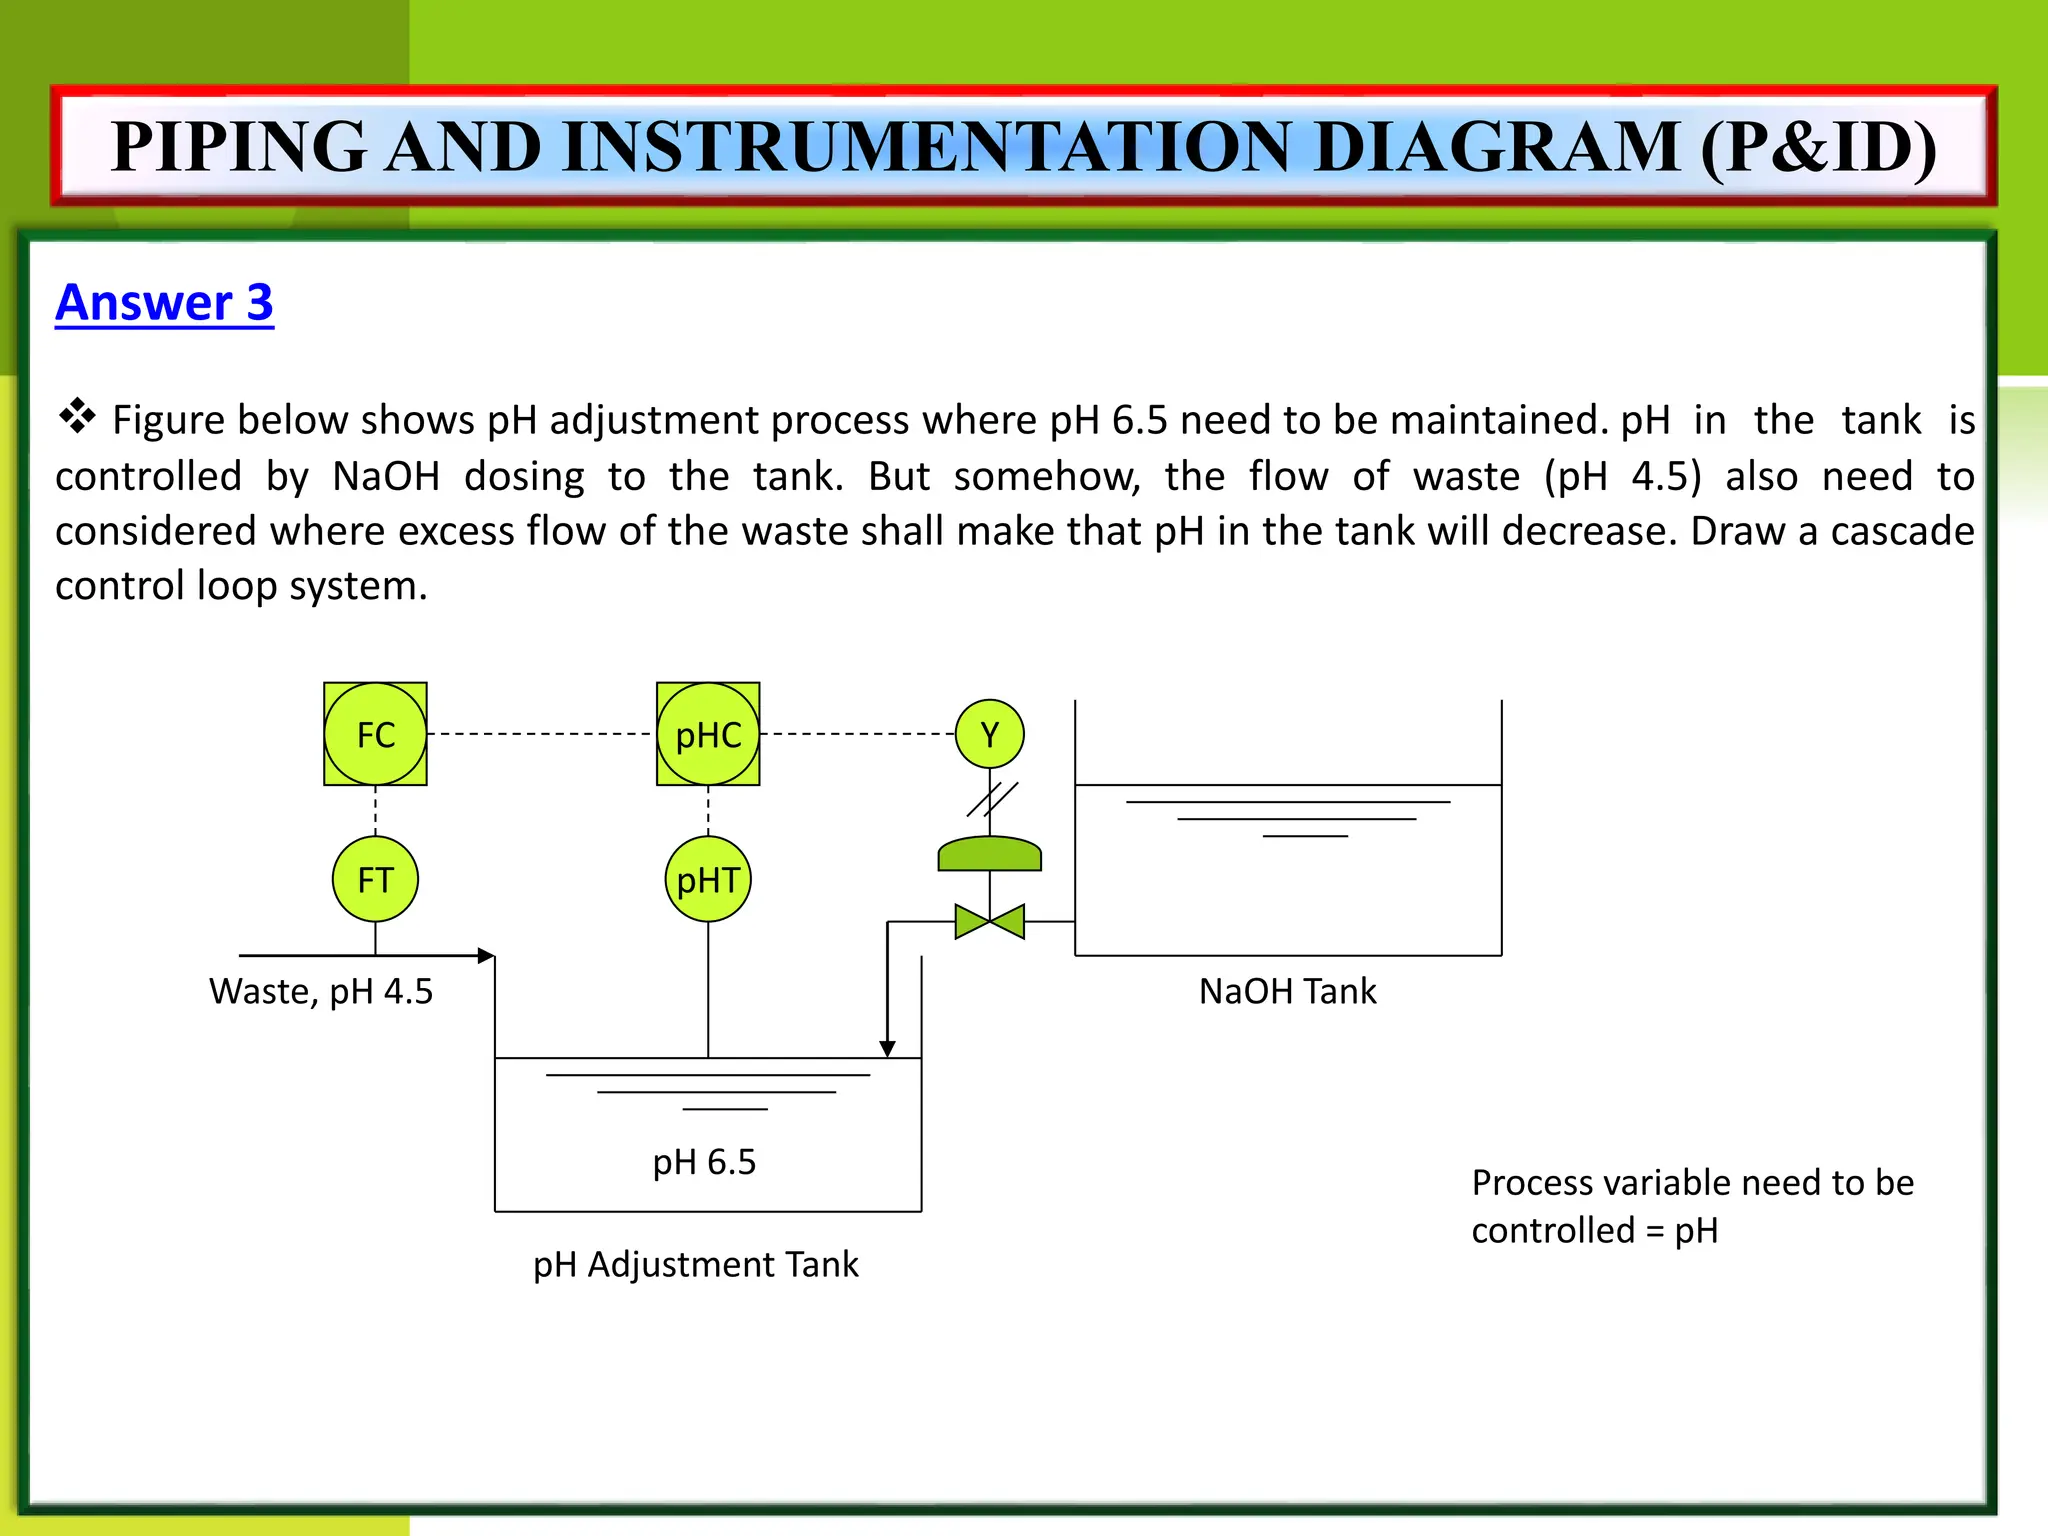
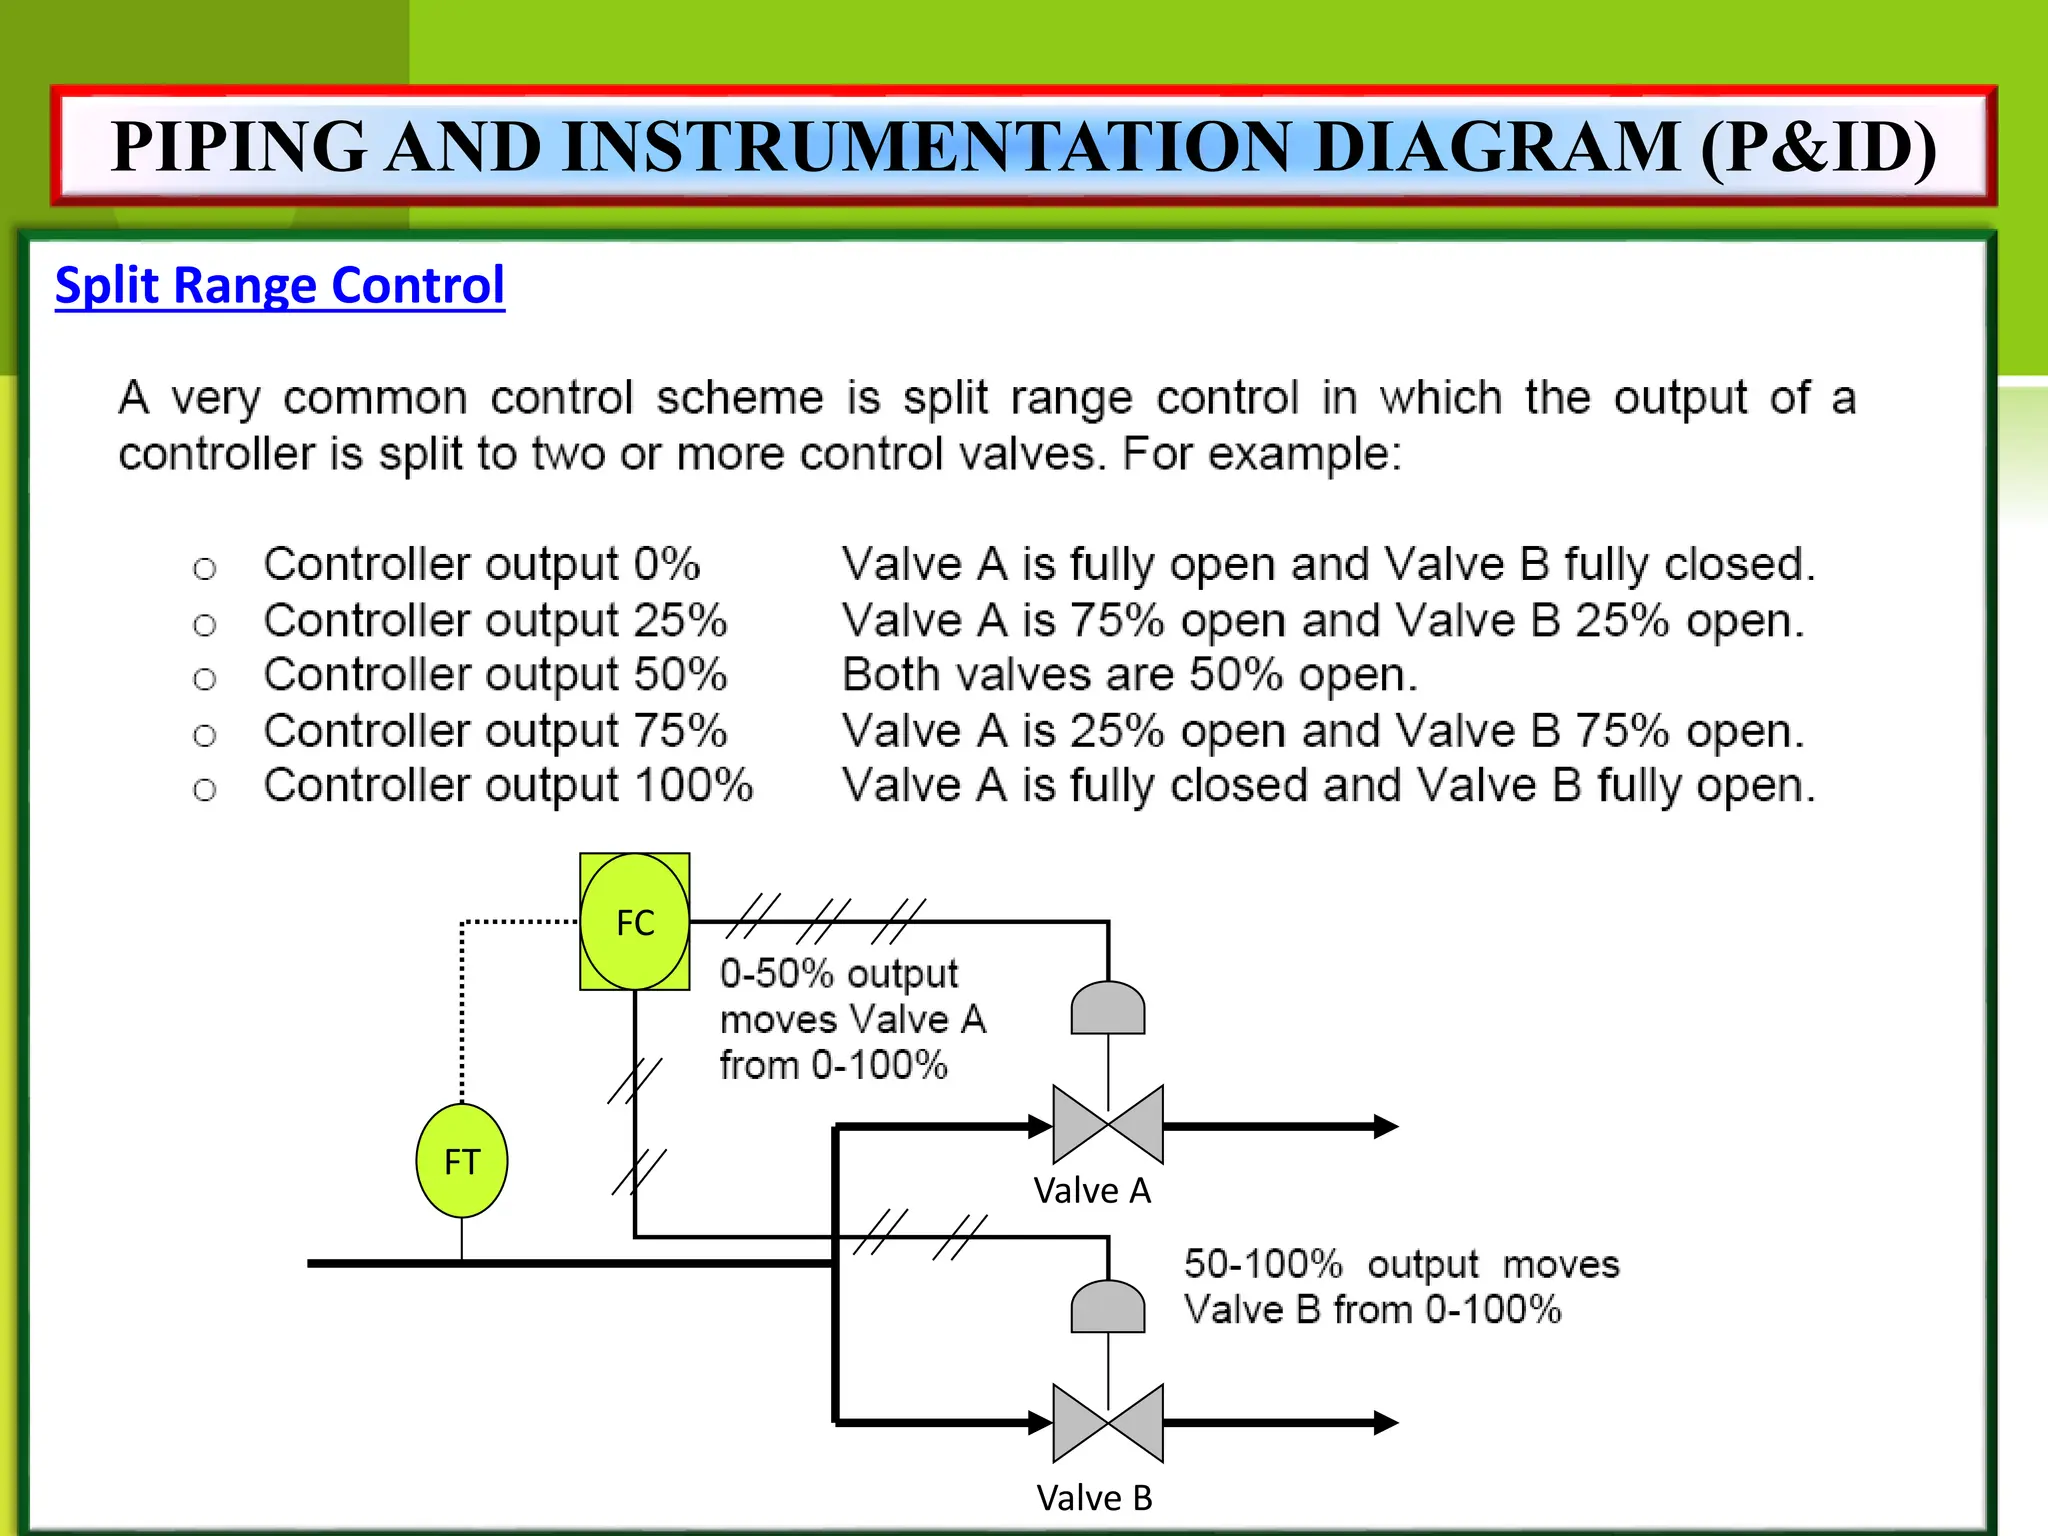
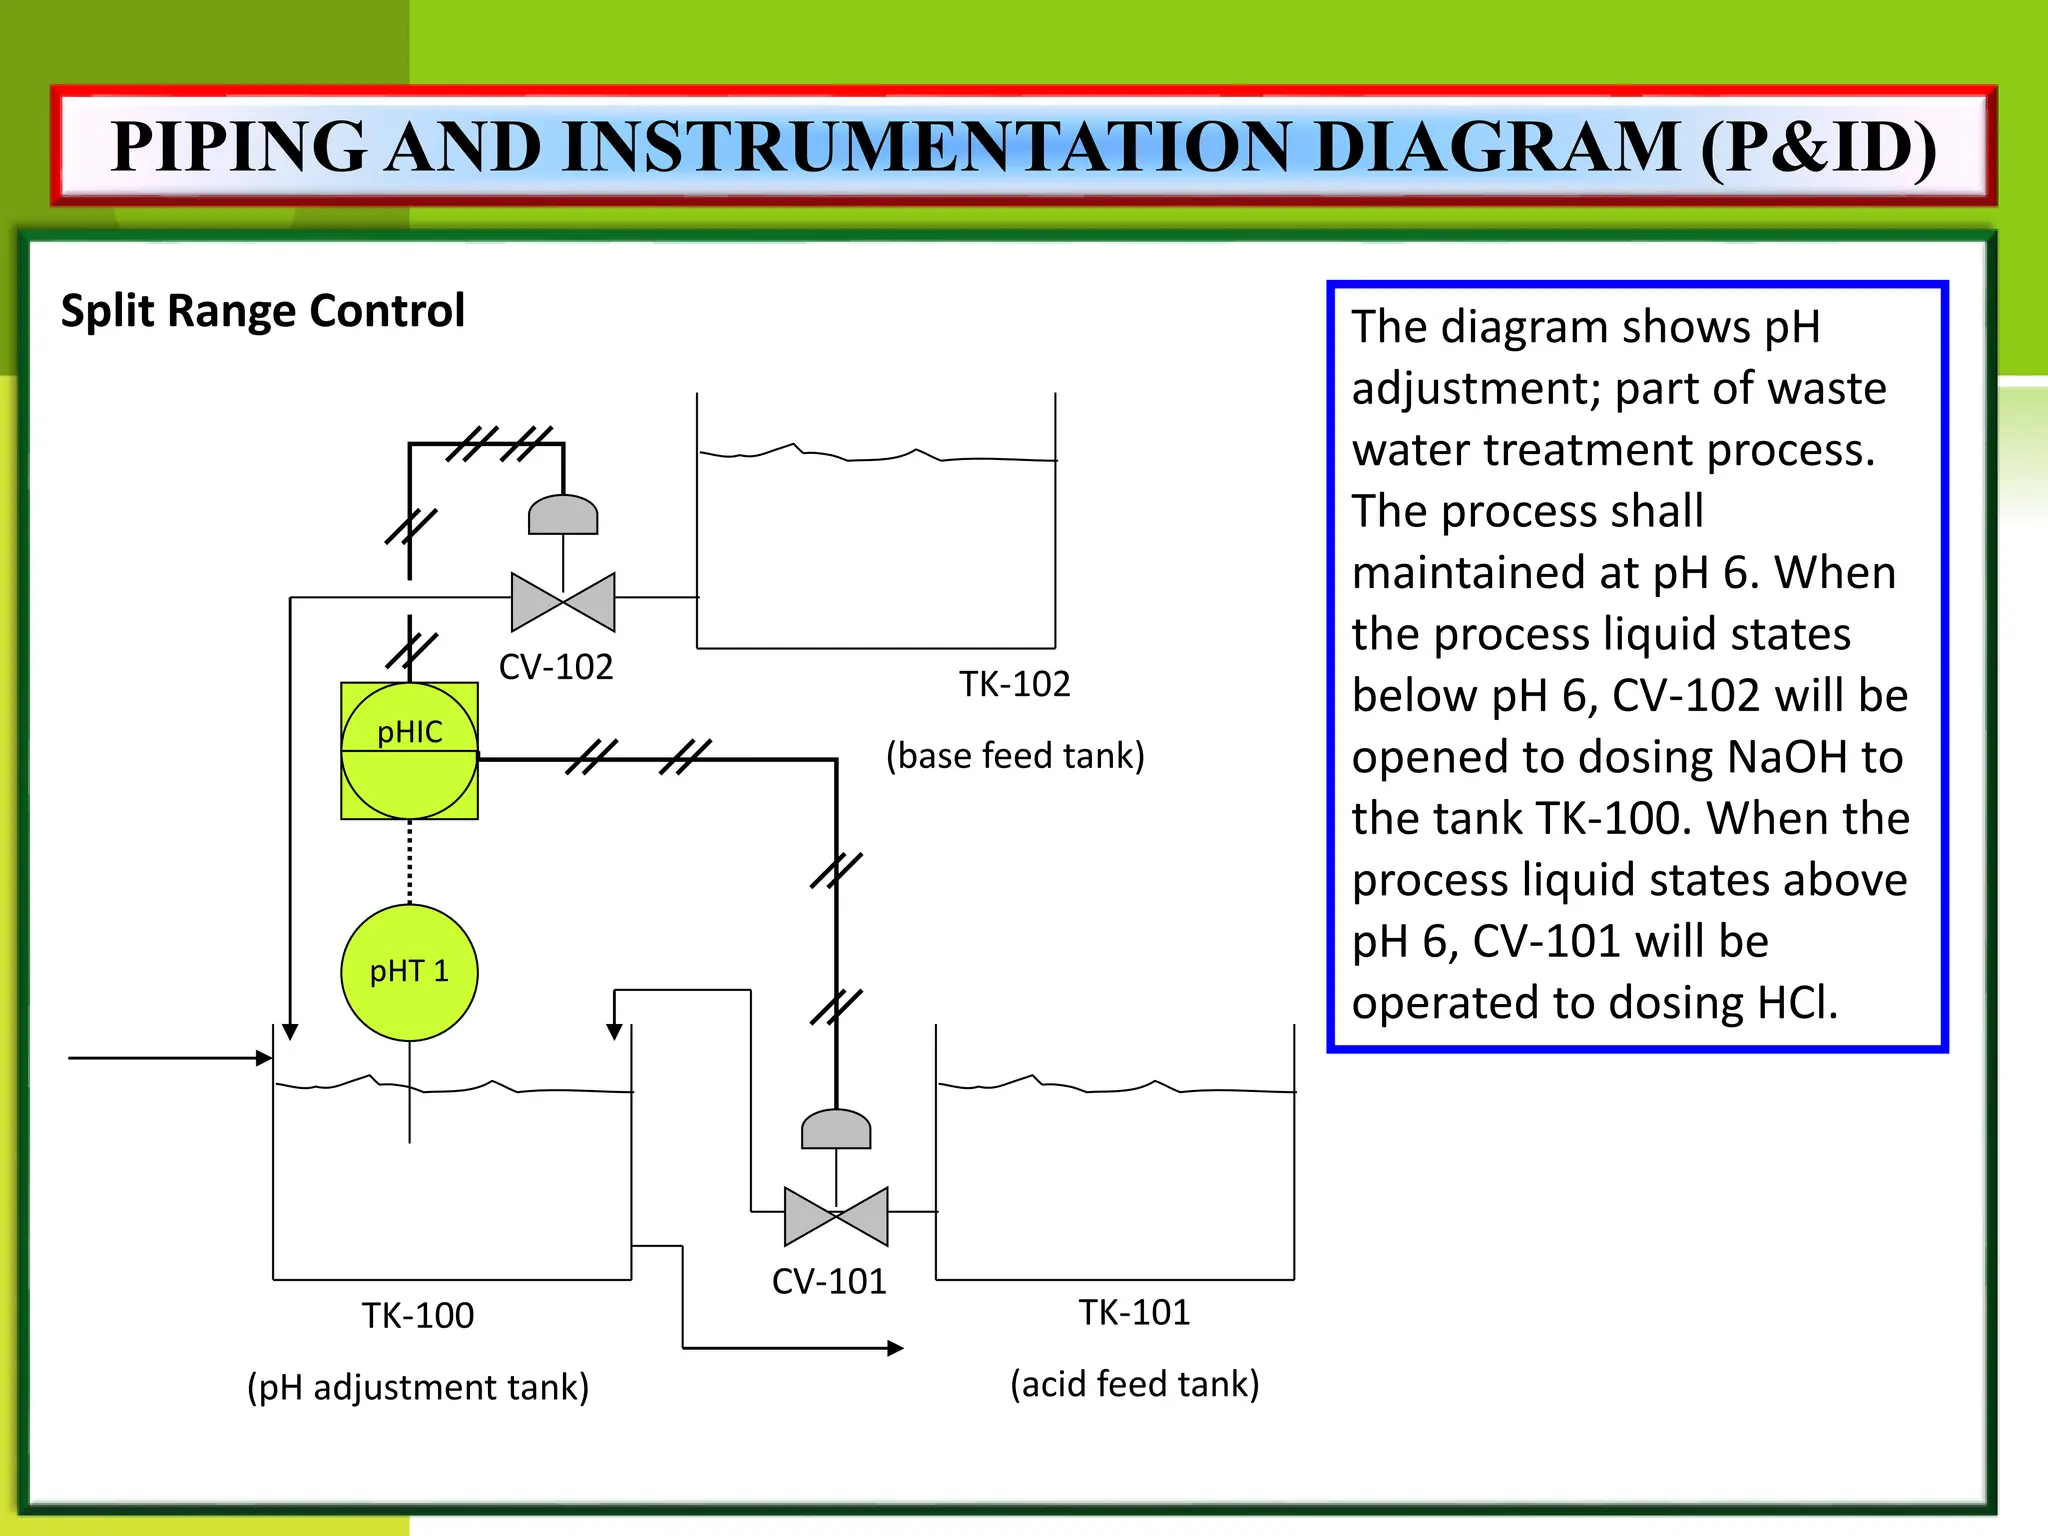
SlideShare a Scribd company logo
1 of 101
ERT 422/4
Piping and instrumentation diagram (P&id)
MISS. RAHIMAH BINTI OTHMAN
(Email: rahimah@unimap.edu.my)
COURSE OUTCOMES
CO
RECOGNIZE all the piping and
instrumentation symbols, CHOOSE suitable
symbols and DEVELOP the piping systems and
the specification of the process instrumentation,
equipment, piping, valves, fittings; and their
arrangement in P&ID for the bioprocess plant
design.
OUTLINES
 TYPES of piping and
instrumentation symbols.
 How to CHOOSE the suitable
symbols in control system?
 How to DEVELOP the piping
systems and the specification of the
process instrumentation,
equipment, piping, valves, fittings.
 The ARRANGEMENT in P&ID
for the bioprocess plant design.
PROCESS
DIAGRAMS
Block Flow
Diagram (BFD)
Process Flow
Diagram (PFD)
Piping and
Instrumentation
Diagram (P&ID)
Process equipments
symbol and
numbering
PROCESS
DIAGRAMS
Block Flow
Diagram (BFD)
Process Flow
Diagram (PFD)
Piping and
Instrumentation
Diagram (P&ID)
Process equipments
symbol and
numbering
BLOCK FLOW DIAGRAM (BFD)
 Is the simplest flowsheet.
 Process engineer begins the process design with a block diagram in
which only the feed and product streams are identified.
 Input-output diagrams are not very detailed and are most useful in
early stages of process development.
 Flow of raw materials and products may be included on a BFD.
 The processes described in the BFD, are then broken down into
basic functional elements such as reaction and separation sections.
 Also identify the recycle streams and additional unit operations to
achieve the desired operating conditions.
Reactor Gas Separator
Toluene, C7H8
10,000 kg/hr
Hydrogen H2
820 kg/hr
Mixed Liquid
75% Conversion of
Toluene
Mixed Gas
2610 kg/hr
Benzene, C6H6
8,210 kg/hr
Reaction : C7H8 + H2 C6H6 + CH4
Figure 1: Block Flow Diagram for the Production of Benzene
C6H6
CH4
C7H8
Example 1:
BLOCK FLOW DIAGRAM (BFD)
Production of Ethane from Ethanol
Ethanol is feed to continuous reactor with presence of Acid Sulphuric catalyzer
to produce ethylene. Distillation process then will be applied to separate
ethylene-H2O mixture. Ethylene as a top product is then condensate with
condenser to perform liquid ethylene. Hydrogenation of ethylene applies in
another reactor with presence of Nickel catalyzer to produce ethane as a final
product. Develop BFD for these processes.
Reactor 1
Ethanol,
C2H5OH
H2SO4
Reactor 2
Distillation
column
Ethylene,
CH2CH2 (g)
Ethane,
CH3CH3
CH3CH2OH H2SO4 CH2=CH2 + H2O
CH2=CH2 + H2
Ni
CH3CH3
Ni
Hydrogen,
H2
Cold
water in
Hot water
out
H2O
CH2CH2
H2O
Ethylene liq.
CH2CH2 (l)
Example 2:
Answer:
Ammonia-air mixture is feed to the bottom stream of an absorber with flow rate of 10L/min.
Water then feed to the upper stream of the same absorber with desired flow rate of 5L/min.
There are two outputs from the absorber where upper stream is insoluble NH3 and bottom
stream is NH3-Water mixture. This NH3-water mixture then feed up to a batch distillation
column. The column produces ammonia gas as a top product which this product then will be
condensate with a condenser to produce liquid ammonia. Develop Block Flow Diagram (BFD)
for this process.
Example 3:
Absorber
Batch
Distillation
Water 5 L/min
Ammonia-air mixture 10 L/min
Insoluble
ammonia
Ammonia-water mixture
Ammonia gas
Cold water
in
Hot water
out
Ammonia
liquid
Condenser
PROCESS
DIAGRAMS
Block Flow
Diagram (BFD)
Process Flow
Diagram (PFD)
Piping and
Instrumentation
Diagram (P&ID)
Process equipments
symbol and
numbering
A Process Flow Diagram generally includes following information;
a) Flow rate of each stream in case of continuous process or
quality of each reactant in case of a batch process.
b) Composition streams.
c) Operating conditions of each stream such as pressure ,
temperature, concentration, etc.
d) Heat added or removed in a particular equipment.
e) Flows of utilities such as stream, cooling water, brine, hot oil,
chilled water, thermal fluid, etc.
f) Major equipment symbols, names and identification.
g) Any specific information which is useful in understanding the
process. For example, symbolic presentation of a hazard,
safety precautions, sequence of flow, etc.
PROCESS FLOW DIAGRAM (PFD)
PFD
1. Major Pieces Of
Equipment
2. Utility
Streams
3. Process Flow
Streams
4. Basic Control
Loops
PROCESS FLOW DIAGRAM (PFD)
PFD
1. Major Pieces Of
Equipment
2. Utility
Streams
3. Process Flow
Streams
4. Basic Control
Loops
PFD will contains the following information:-
1. All major pieces of equipment (descriptive
name, unique equipment no.), pumps and valves.
2. All the utility streams supplied to major
equipments such as steam lines, compressed air
lines, electricity, etc.
PROCESS FLOW DIAGRAM (PFD)
Process Unit Symbology
Symbol Description
Heat exchanger
H2O Water cooler
S Steam heater
Cooling coil
PROCESS FLOW DIAGRAM (PFD)
Process Unit Symbology
Symbol Description
Heater coil
Centrifugal pump
Turbine type compressor
Pressure gauge
PROCESS FLOW DIAGRAM (PFD)
Process Unit Symbology
Symbol Name
Stripper
Absorber
A separator unit used
commonly to liquid mixture
into gas phase.
Description
A separator unit used
commonly to extract mixture
gas into liquid phase.
PROCESS FLOW DIAGRAM (PFD)
Process Unit Symbology
Symbol Name
Distillation
column
Liquid mixer
A separator unit used
commonly to crack liquid
contains miscellaneous
component fractions.
Description
A process unit that used to
mix several components of
liquid.
or
PROCESS FLOW DIAGRAM (PFD)
Process Unit Symbology
Symbol Name
Reaction
chamber
Horizontal tank
or cylinder
A process unit where chemical
process reaction occurs
Description
A unit to store liquid or gas.
PROCESS FLOW DIAGRAM (PFD)
Process Unit Symbology
Symbol Name
Boiler
Centrifuge
A unit for heating.
Description
A separator unit that to
physically separated liquid
mixture. (exp: oil-liquid)
PROCESS FLOW DIAGRAM (PFD)
Valve Symbology
Symbol Name
Gate Valve
Check Valve
Globe Valve
Ball Valve
Butterfly Valve
PROCESS FLOW DIAGRAM (PFD)
Valve Symbology
Symbol Name
Relief Valve
Angle Valve
Needle Valve
3-Way Valve
Butterfly Valve
PROCESS FLOW DIAGRAM (PFD)
EXAMPLE 4
Production of Ethane from Ethanol
Ethanol is feed to continuous reactor with presence of Acid Sulphuric catalyzer to produce ethylene.
Distillation process then will be applied to separate ethylene-H2O mixture. Ethylene as a top product
is then condensate with condenser to perform liquid ethylene. Hydrogenation of ethylene applies in
another reactor with presence of Nickel catalyzer to produce ethane as a final product. Develop PFD
for these processes.
CH3CH2OH H2SO4 CH2=CH2 + H2O
CH2=CH2 + H2
Ni
CH3CH3
T-100
Distillation Column
Ethanol
H2SO4
Ethylene
Ethylene
liq.
Ethane
Ni
Hydrogen
Cold water in
Hot water out
H2O
R-100
Reactor
E-100
Condenser
R-101
Reactor
R-100
T-100
E-100
R-101
P-100
Pump
P-101
Pump
P-100
P-101
V-100 V-101 V-102
V-103
V-104
V-105
V-106
V-107
CV-101
CV-100
Ammonia-air mixture is feed to the bottom stream of an absorber with flow rate of
10L/min. Water then feed to the upper stream of the same absorber with desired
flow rate of 5L/min. There are two outputs from the absorber where upper stream
is insoluble NH3 and bottom stream is NH3-Water mixture. This NH3-water mixture
then feed up to a batch distillation column. The column produces ammonia gas as a
top product which this product then will be condensate with a condenser to
produce liquid ammonia. Develop Process Flow Diagram (PFD) for this process.
EXAMPLE 5
Water 5 L/min
Ammonia-air
mixture 10 L/min
Insoluble ammonia
gas
Ammonia-water mixture
Ammonia gas
Cold water in
Hot water out
Ammonia liquid
T-100
Absorber Column
T-101
Batch Distillation Column
E-100
Condenser
Process Equipment General Format XX-YZZ A/B
XX are the identification letters for the equipment classification
C - Compressor or Turbine
E - Heat Exchanger
H - Fired Heater
P - Pump
R - Reactor
T - Tower
TK - Storage Tank
V - Vessel
Y - designates an area within the plant
ZZ - are the number designation for each item in an equipment class
A/B - identifies parallel units or backup units not shown on a PFD
Supplemental Information Additional description of equipment given on top of PFD
Process Unit Tagging and Numbering
PROCESS FLOW DIAGRAM (PFD)
A/B Letter
Example
Ethanol
H2SO4
Ethylene
Ethylene liq.
Ethane
Ni
Hydrogen
Cold
water in
Hot water
out
H2O
P-100 A/B
In PFD
Ethylene
Ethylene liq.
Ethane
Ni
Hydrogen
Cold
water in
Hot water
out
H2O
P-100 A
P-100 B
In Real Plant
PROCESS FLOW DIAGRAM (PFD)
Ethanol
H2SO4
PFD
1. Major Pieces Of
Equipment
2. Utility
Streams
3. Process Flow
Streams
4. Basic Control
Loops
PFD will contains the following information:-
All process flow streams: identification by a
number, process condition, chemical composition.
PROCESS FLOW DIAGRAM (PFD)
Stream Numbering and Drawing
- Number streams from left to right as much as possible.
- Horizontal lines are dominant.
Yes No No
PROCESS FLOW DIAGRAM (PFD)
EXAMPLE 4- CONT’
T-100
Distillation Column
Ethanol
H2SO4
Ethylene Ethylene liq.
Ethane
Ni
Hydrogen
Cold water
in
Hot water
out
H2O
R-100
Reactor
E-100
Condenser
R-101
Reactor
R-100
T-100
E-100
R-101
P-100
Pump
P-101
Pump
1
2
3
4
5
6
7
8
9
10
V-100
V-101 V-102
V-103
V-104
V-105
V-106
V-107
CV-100
CV-101
P-100
P-101
Stream Information
-Since diagrams are small not much stream information
can be included.
-Include important data – around reactors and towers, etc.
 Flags are used
 Full stream data
PROCESS FLOW DIAGRAM (PFD)
1
2
3
4
5
6 7
8
11
9
10
12
13
600
24
24
300
Stream Information - Flag
600 Temperature
24 Pressure
10.3 Mass Flowrate
108 Molar Flowrate
Gas Flowrate
Liquid
Flowrate
PROCESS FLOW DIAGRAM (PFD)
EXAMPLE 4- CONT’
25
28
35
32.2
35
31.0
38 20
T-100
Distillation Column
Ethanol
H2SO4
Ethylene Ethylene liq.
Ethane
Ni
Hydrogen
Cold
water in
Hot water
out
H2O
R-100
Reactor
E-100
Condenser
R-101
Reactor
R-100
T-100
E-100
R-101
P-100
Pump
P-101
Pump
1
2
3
4
5
6
7
8
9
10
V-100
V-101 V-102
V-103
V-104
V-105
V-106
V-107
CV-100
CV-101
P-100
P-101
Stream
Number
1 2 3 4 5 6 7 8 9 10
Temperature
(oC)
25.0 35.0 35.0 35.0 35.0 60.3 41 38 54.0 45.1
Pressure (psi) 28 32.2 31.0 31.0 30.2 45.1 31.3 24.0 39.0 2.6
Vapor fraction
Mass flow
(tonne/hr)
10.3 13.3 0.82 20.5 6.41 20.5 0.36 9.2 20.9 11.6
Mole flow
(kmol/hr)
108 114.2 301.0 1204.0 758.8 1204.4 42.6 1100.8 142.2 244.0
Stream Information - Full stream data:
PROCESS FLOW DIAGRAM (PFD)
EXAMPLE 4- CONT’
Stream Number 1 2 3 4 5 6 7 8 9 10
Temperature (oC) 25.0 35.0 35.0 35.0 35.0 60.3 41 38 54 45.1
Pressure (psi) 28 32.2 31.0 31.0 30.2 45.1 31.3 24.0 39 2.6
Vapor fraction
Mass flow (tonne/hr) 10.3 13.3 0.82 20.5 6.41 20.5 0.36 9.2 20.9 11.6
Mole flow (kmol/hr) 108 114.2 301.0 1204.0 758.8 1204.4 42.6 1100.8 142.2 244.0
25
28
35
32.2
35
31.0
38
20
T-100
Distillation Column
Ethanol
H2SO4
Ethylene Ethylene liq.
Ethane
Ni
Hydrogen
Cold
water in
Hot water
out
H2O
R-100
Reactor
E-100
Condenser
R-101
Reactor
R-100
T-100
E-100
R-101
P-100
Pump
P-101
Pump
1
2
3
4
5
6
7
8
9
10
V-101 V-102
V-103
CV-100
V-100
V-104
V-105
V-106
V-107
CV-101
P-100
P-101
PFD
1. Major Pieces Of
Equipment
2. Utility
Streams
3. Process Flow
Streams
4. Basic Control
Loops
PFD will contains the following information:-
- Basic control loops: showing the control
strategy used to operate the process under
normal operations.
PROCESS FLOW DIAGRAM (PFD)
Stream Number 1 2 3 4 5 6 7 8 9 10
Temperature (oC) 25.0 35.0 35.0 35.0 35.0 60.3 41 38 54 45.1
Pressure (psi) 28 32.2 31.0 31.0 30.2 45.1 31.3 24.0 39 2.6
Vapor fraction
Mass flow (tonne/hr) 10.3 13.3 0.82 20.5 6.41 20.5 0.36 9.2 20.9 11.6
Mole flow (kmol/hr) 108 114.2 301.0 1204.0 758.8 1204.4 42.6 1100.8 142.2 244.0
T-100
Distillation Column
R-100
Reactor
E-100
Condenser
R-101
Reactor
P-100
Pump
P-101
Pump
25
28
35
32.2
35
31.0
38
20
Ethanol
H2SO4
Ethylene Ethylene liq.
Ethane
Ni
Hydrogen
Cold water in
Hot water
out
H2O
R-100
T-100
E-100
R-101
1
2
3
4
5
6
7
8
9
10
LIC
LIC
V-100
V-101
V-103
V-102
CV-100
V-104
V-105
V-106
CV-101
V-107
P-100
P-101
EXAMPLE 4- CONT’
FLYSIS CHEMICAL
(M) SDN. BHD
PROCESS FLOW
DIAGRAM
PRODUCTION OF
ETHANE FROM
ETHANOL
ISSUED :
PAGE : 1 OF 1
DRAWN BY :
APPROVED BY :
fs
244.0
142.2
1100.8
42.6
1204.4
758.8
1204.0
301.0
114.2
108
Mole flow (kmol/hr)
11.6
20.9
9.2
0.36
20.5
6.41
20.5
0.82
13.3
10.3
Mass flow (tonne/hr)
Vapor fraction
2.6
39
24.0
31.3
45.1
30.2
31.0
31.0
32.2
28
Pressure (psi)
45.1
54
38
41
60.3
35.0
35.0
35.0
35.0
25.0
Temperature (oC)
10
9
8
7
6
5
4
3
2
1
Stream Number
NOTE:
GATE VALVE
GLOBE VALVE
CHECK VALVE
PNEUMATIC DIAPHRAGM
VALVE
T-100
Distillation Column
R-100
Reactor
E-100
Condenser
R-101
Reactor
P-100
Pump
P-101
Pump
25
28
35
32.2
35
31.0
38
20
Ethanol
H2SO4
Ethylene Ethylene liq.
Ethane
Ni
Hydrogen
Cold water in
Hot water out
H2O
R-100
T-100
E-100
R-101
1
2
3
4
5
6
7
8
9
10
LIC
LIC
V-100
V-101
V-103
V-102
CV-100
V-104
V-105
V-106
CV-101
V-107
P-100
P-101
T-100
Distillation Column
R-100
Reactor
E-100
Condenser
R-101
Reactor
P-100
Pump
P-101
Pump
25
28
25
28
35
32.2
35
32.2
35
31.0
35
31.0
38
20
Ethanol
H2SO4
Ethylene Ethylene liq.
Ethane
Ni
Hydrogen
Cold water in
Hot water out
H2O
R-100
T-100
T-100
E-100
R-101
R-101
1
2
3
4
5
6
7
8
9
10
LIC
LIC
V-100
V-101
V-103
V-102
CV-100
V-104
V-105
V-106
CV-101
V-107
P-100
P-101
PROCESS
DIAGRAMS
Block Flow
Diagram (BFD)
Process Flow
Diagram (PFD)
Piping and
Instrumentation
Diagram (P&ID)
Process equipments
symbol and
numbering
 Also known as “PROCESS & INSTRUMENTATION DIAGRAM”
 Detailed graphical representation of a process including the
hardware and software (i.e piping, equipment, and
instrumentation) necessary to design, construct and
operate the facility.
 Common synonyms for P&IDs include Engineering Flow
Diagram (EFD), Utility Flow Diagram (UFD) and Mechanical
Flow Diagram (MFD).
PIPING AND INSTRUMENTATION
DIAGRAM (P&ID)
PIPING AND INSTRUMENTATION DIAGRAM (P&ID)
PFD
PIPING AND INSTRUMENTATION DIAGRAM (P&ID)
P&ID
Basic Loop
Process
Sensing Element
Measuring
Element
Transmit
Element
Control Element
Final Control
Element Transmitter
PIPING AND INSTRUMENTATION
DIAGRAM (P&ID)
Basic Loop
Transmitter
Controller
Orifice (Flow
Sensor)
Set point
Fluid Fluid
PIPING AND INSTRUMENTATION
DIAGRAM (P&ID)
SENSORS (Sensing Element)
 A device, such as a photoelectric cell, that receives and responds to a signal or
stimulus.
 A device, usually electronic, which detects a variable quantity and measures and
converts the measurement into a signal to be recorded elsewhere.
 A sensor is a device that measures a physical quantity and converts it into a signal
which can be read by an observer or by an instrument.
 For example, a mercury thermometer converts the measured temperature into
expansion and contraction of a liquid which can be read on a calibrated glass tube.
A thermocouple converts temperature to an output voltage which can be read by
a voltmeter.
 For accuracy, all sensors need to be calibrated against known standards.
PIPING AND INSTRUMENTATION
DIAGRAM (P&ID)
TEMPERATURE SENSOR
A thermocouple is a junction between two different metals that produces a voltage
related to a temperature difference. Thermocouples are a widely used type
of temperature sensor and can also be used to convert heat into electric power.
1. Thermocouple
PIPING AND INSTRUMENTATION
DIAGRAM (P&ID)
TEMPERATURE SENSOR
2. Resistance Temperature Detector (RTD)
Resistance Temperature Detectors (RTD), as the name implies, are sensors used to
measure temperature by correlating the resistance of the RTD element with
temperature.
Most RTD elements consist of a length of fine coiled wire wrapped around a ceramic
or glass core. The element is usually quite fragile, so it is often placed inside a
sheathed probe to protect it.
The RTD element is made from a pure material whose resistance at various
temperatures has been documented. The material has a predictable change in
resistance as the temperature changes; it is this predictable change that is used to
determine temperature.
PIPING AND INSTRUMENTATION
DIAGRAM (P&ID)
Accuracy for Standard OMEGA RTDs
Temperature
°C
Ohms °C
-200 ±056 ±1.3
-100 ±0.32 ±0.8
0 ±0.12 ±0.3
100 ±0.30 ±0.8
200 ±0.48 ±1.3
300 ±0.64 ±1.8
400 ±0.79 ±2.3
500 ±0.93 ±2.8
600 ±1.06 ±3.3
650 ±1.13 ±3.6
PIPING AND INSTRUMENTATION
DIAGRAM (P&ID)
FLOW SENSOR
1. Turbine Meter
In a turbine, the basic concept is that a meter is manufactured with a known cross
sectional area. A rotor is then installed inside the meter with its blades axial to the
product flow. When the product passes the rotor blades, they impart an angular
velocity to the blades and therefore to the rotor. This angular velocity is directly
proportional to the total volumetric flow rate.
Turbine meters are best suited to large, sustained flows as they are susceptible to
start/stop errors as well as errors caused by unsteady flow states.
PIPING AND INSTRUMENTATION
DIAGRAM (P&ID)
FLOW SENSOR
2. Magnetic Flow Meter
Measurement of slurries and of corrosive or abrasive or other difficult fluids is easily
made. There is no obstruction to fluid flow and pressure drop is minimal.
The meters are unaffected by viscosity, density, temperature, pressure and fluid
turbulence.
Magnetic flow meters utilize the principle of Faraday’s Law of Induction; similar
principle of an electrical generator.
When an electrical conductor moves at right angle to a magnetic field, a voltage is
induced.
PIPING AND INSTRUMENTATION
DIAGRAM (P&ID)
PIPING AND INSTRUMENTATION
DIAGRAM (P&ID)
FLOW
SENSOR
FLOW SENSOR
3. Orifice Meter
PIPING AND INSTRUMENTATION
DIAGRAM (P&ID)
• An orifice meter is a conduit and restriction to
create a pressure drop.
• A nozzle, venture or thin sharp edged orifice
can be used as the flow restriction.
• To use this type of device for measurement, it
is necessary to empirically calibrate this device.
• An orifice in a pipeline is shown in the figures
with a manometer for measuring the drop in
pressure (differential) as the fluid passes thru
the orifice.
FLOW SENSOR
4. Venturi Meter
A device for measuring flow of a fluid in terms of
the drop in pressure when the fluid flows into
the constriction of a Venturi tube.
A meter, developed by Clemens Herschel, for
measuring flow of water or other fluids through
closed conduits or pipes. It consists of a venturi tube
and one of several forms of flow registering devices.
PIPING AND INSTRUMENTATION
DIAGRAM (P&ID)
TRANSMITTER
Transmitter is a transducer* that responds to a measurement variable and
converts that input into a standardized transmission signal.
*Transducer is a device that receives output signal from sensors.
Pressure Transmitter
Differential Pressure
Transmitter
Pressure Level
Transmitter
PIPING AND INSTRUMENTATION
DIAGRAM (P&ID)
CONTROLLER
Controller is a device which monitors and affects the operational conditions of a
given dynamical system.
The operational conditions are typically referred to as output variables of the system
which can be affected by adjusting certain input variables.
Indicating Controller
Recording Controller
PIPING AND INSTRUMENTATION
DIAGRAM (P&ID)
FINAL CONTROL ELEMENT
Final Control Element is a device that directly controls the value of manipulated
variable of control loop.
Final control element may be control valves, pumps, heaters, etc.
Pump Control Valve Heater
PIPING AND INSTRUMENTATION
DIAGRAM (P&ID)
PROCESS
DIAGRAMS
Block Flow
Diagram (BFD)
Process Flow
Diagram (PFD)
Piping and
Instrumentation
Diagram (P&ID)
Process equipments
symbol and
numbering
Instrumentation Symbology
Instruments that are field mounted.
-Instruments that are mounted on process plant (i.e sensor that
mounted on pipeline or process equipments.
Field
mounted on
pipeline
PIPING AND INSTRUMENTATION
DIAGRAM (P&ID)
Instrumentation Symbology
Instruments that are board mounted
-Instruments that are mounted on control board.
PIPING AND INSTRUMENTATION
DIAGRAM (P&ID)
Instrumentation Symbology
Instruments that are board mounted (invisible).
-Instruments that are mounted behind a control panel board.
PIPING AND INSTRUMENTATION
DIAGRAM (P&ID)
Instrumentation Symbology
Instruments that are functioned in Distributed Control System (DCS)
- A distributed control system (DCS) refers to a control system usually of
a manufacturing system, process or any kind of dynamic system, in which
the controller elements are not central in location (like the brain) but are
distributed throughout the system with each component sub-system
controlled by one or more controllers. The entire system of controllers is
connected by networks for communication and monitoring.
PIPING AND INSTRUMENTATION
DIAGRAM (P&ID)
Instrumentation Symbology
PIPING AND INSTRUMENTATION
DIAGRAM (P&ID)
FC Flow Controller PT Pressure Transmitter
FE Flow Element PTD Pressure Transducer
FI Flow Indicator
FT Flow Transmitter LC Level Controller
FS Flow Switch LG Level Gauge
FIC Flow Indicating Controller LR Level Recorder
FCV Flow Control Valve LT Level Transmitter
FRC Flow Recording Controller LS Level Switch
LIC Level Indicating Controller
PC Pressure Controller LCV Level Control Valve
PG Pressure Gauge LRC Level Recording Controller
PI Pressure Indicator
PR Pressure Recorder TE Temperature Element
PIPING AND INSTRUMENTATION DIAGRAM (P&ID)
PS Pressure Switch TI Temperature Indicator
PIC Pressure Indicating Controller TR Temperature Recorder
PCV Pressure Control Valve TS Temperature Switch
PRC Pressure Recording Controller TC Temperature Controller
PDI Pressure Differential Indicator TT Temperature Transmitter
PDR Pressure Differential Recorder
PDS Pressure Differential Switch
PDT Pressure Differential Transmitter
PIPING AND INSTRUMENTATION
DIAGRAM (P&ID)
Signal Lines Symbology
PIPING AND INSTRUMENTATION
DIAGRAM (P&ID)
With using these following symbols;
Complete control loop for LCV 101
Principal of P&ID
Example 1
V-100
LCV 101
LV 100
LC
LC
LT
PIPING AND INSTRUMENTATION DIAGRAM (P&ID)
With using these following symbology;
Draw control loop to show that PRV-100
will be activated to relief pressure when
the pressure in the V-100 is higher than
desired value.
Example 2
V-100
PT Where PT is locally mounted
Where PIC is function in DCS
PRV-100
PT
PIC
PIC
PE Where PE is locally mounted
on V-100
PE
The Piping & Instrumentation Diagram (P&ID)
Sometimes also known as Process & Instrumentation Diagram
PIPING AND INSTRUMENTATION DIAGRAM (P&ID)
Exercise 1
TK-100
(pH adjustment tank)
TK-101
(acid feed tank)
The diagram shows pH
adjustment; part of waste water
treatment process. With using
above symbols, draw control
loop where the process need is:
The process shall maintained at
pH 6. When the process liquid
states below pH 6, CV-102 will
be opened to dosing NaOH to
the tank TK-100. When the
process liquid states above pH 6,
CV-101 will be operated to
dosing HCl.
TK-102
(base feed tank)
CV-101
CV-102
pHE 2 pHT 2
pHIC 2
pHE 1 pHT 1
pHIC 1
PIPING AND INSTRUMENTATION DIAGRAM (P&ID)
Answer 1
TK-100
(pH adjustment tank)
TK-101
(acid feed tank)
The diagram shows pH
adjustment; part of waste water
treatment process. With using
above symbols, draw control
loop where the process need is:
The process shall maintained at
pH 6. When the process liquid
states below pH 6, CV-102 will be
opened to dosing NaOH in the
base feed tank. When the
process liquid states above pH 6,
CV-101 will be operated to
dosing HCl in the acid fed tank.
TK-102
(base feed tank)
CV-101
CV-102
pHTE
2
pHT 2
pHIC 2
pHE 1 pHT 1
pHIC 1
pHE 1
pHT 1
pHIC 1
pHE 2
pHT 2
pHIC 2
PIPING AND INSTRUMENTATION DIAGRAM (P&ID)
Exercise 2
V-100
PCV-100
PCV-101
LT 1
TK-100
LIC 1
FC
FC
Where LT 1 and LIC 1 to control
PCV-100 (failure close);
PCV-100 close when level reached
L 3
PCV-100 open when level below L3
L1
L2
L3
LT 2 LIC 2
Where LT 2 and LIC 2 to control
PCV-101 (failure close);
PCV-101 close when level reached
L5
PCV-101 open when level below L5
L4
L5
PIPING AND INSTRUMENTATION DIAGRAM (P&ID)
Answer 2
V-100
PRV-100
PRV-101
LT 1
TK-100
LIC 1
FC
FC Where LT 1 and LIC 1 to control
PRV-100 (failure close);
PRV-100 close when level reached
L 3
PRV-100 open when level below L3
L1
L2
L3
LT 2 LIC 2
Where LT 1 and LIC 1 to control
PRV-101 (failure close);
PRV-101 close when level reached
L5
PRV-101 open when level below L5
L4
L5
LT 1
LIC 1
LT 2
LIC 2
PIPING AND INSTRUMENTATION DIAGRAM (P&ID)
PROCESS
DIAGRAMS
Block Flow
Diagram (BFD)
Process Flow
Diagram (PFD)
Piping and
Instrumentation
Diagram (P&ID)
Process equipments
symbol and
numbering
Instrumentation Numbering
 XYY CZZLL
X represents a process variable to be measured.
(T=temperature, F=flow, P=pressure, L=level)
YY represents type of instruments.
C designates the instruments area within the plant.
ZZ designates the process unit number.
LL designates the loop number.
PIPING AND INSTRUMENTATION DIAGRAM (P&ID)
Instrumentation Numbering
 LIC 10003
L = Level shall be measured.
IC = Indicating controller.
100 = Process unit no. 100 in the area of no. 1
03 = Loop number 3
PIPING AND INSTRUMENTATION DIAGRAM (P&ID)
Instrumentation Numbering
 FRC 82516
F = Flow shall be measured.
RC = Recording controller
825 = Process unit no. 825 in the area of no. 8.
16 = Loop number 16
PIPING AND INSTRUMENTATION DIAGRAM (P&ID)
PROCESS
DIAGRAMS
Block Flow
Diagram (BFD)
Process Flow
Diagram (PFD)
Piping and
Instrumentation
Diagram (P&ID)
Process equipments
symbol and
numbering
P&ID
PROCESS
CONTROL
VARIETY
Type of Process Control Loop
 Feedback Control
 Feedforward Control
 Feedforward-plus-Feedback Control
 Ratio Control
 Split Range Control
 Cascade Control
 Differential Control
PIPING AND INSTRUMENTATION
DIAGRAM (P&ID)
Feedback Control
 One of the simplest process control schemes.
 A feedback loop measures a process variable and sends the measurement to a
controller for comparison to set point. If the process variable is not at set point,
control action is taken to return the process variable to set point.
 The advantage of this control scheme is that it is simple using single transmitter.
 This control scheme does not take into consideration any of the other variables in
the process.
V-100
LCV-100
LC
V-100
Fluid in
Fluid out
LT
Y
PIPING AND INSTRUMENTATION DIAGRAM (P&ID)
Feedback Control (cont…)
 Feedback loop are commonly used in the process control industry.
 The advantage of a feedback loop is that directly controls the desired process variable.
 The disadvantage of feedback loops is that the process variable must leave set
point for action to be taken.
V-100
LCV-100
LC
V-100
Fluid in
Fluid out
LT
Y
PIPING AND INSTRUMENTATION DIAGRAM (P&ID)
Example 1
 Figure below shows the liquid vessel for boiler system. This system has to maximum desired
temperature of 120 oC (L2) where the heater will be cut off when the temperature reached desired
temperature. Draw feedback control loop for the system.
V-100
V 100
TC
Fluid in
Fluid out
TT
PIPING AND INSTRUMENTATION DIAGRAM (P&ID)
Feedforward Control
 Feedforward loop is a control system that anticipates load disturbances and controls
them before they can impact the process variable.
 For feedforward control to work, the user must have a mathematical understanding of how
the manipulated variables will impact the process variable.
LCV-100
FT
FC
Y
Steam
TI
Process variable need to be
controlled = Temperature
Fluid in
Fluid out
PIPING AND INSTRUMENTATION DIAGRAM (P&ID)
Feedforward Control (cont…)
 An advantage of feedforward control is that error is prevented, rather than corrected.
 However, it is difficult to account for all possible load disturbances in a system
through feedforward control.
 In general, feedforward system should be used in case where the controlled variable has the
potential of being a major load disturbance on the process variable ultimately being
controlled.
LCV-100
FT
FC
Y
Steam
TI
Process variable need to be
controlled = Temperature
Fluid in
Fluid out
PIPING AND INSTRUMENTATION DIAGRAM (P&ID)
Example 2
 Figure below shows compressed gas vessel. Process variable that need to be controlled is
pressure where the vessel should maintain pressure at 60 psi. This pressure controlled
through the gas flow measurement into the vessel. By using feedforward control system,
draw the loop.
V-100
FT Process variable need to be
controlled = Pressure
FC
Y
PI
PIPING AND INSTRUMENTATION DIAGRAM (P&ID)
Feedforward-plus-Feedback Control
 Because of the difficulty of accounting for every possible load disturbance in a
feedforward system, this system are often combined with feedback systems.
 Controller with summing functions are used in these combined systems to total the
input from both the feedforward loop and the feedback loop, and send a unified
signal to the final control element.
LCV-100
FT
FC
Y
Steam
TT
Process variable need to be
controlled = Temperature
Fluid in
Fluid out
TC

PIPING AND INSTRUMENTATION DIAGRAM (P&ID)
Example 3
 Figure below shows compressed gas vessel. Process variable that need to be controlled is pressure
where the vessel should maintain pressure at 60 psi. By using pressure controlled through both the gas
flow measurement into the vessel and vessel pressure itself, draw a feedforward-plus-feedback control
loop system.
V-100
FT Process variable need to be
controlled = Pressure
FC
Y
PT

PIC
PIPING AND INSTRUMENTATION DIAGRAM (P&ID)
Exercise 2
 Figure below shows the boiler system that used to supply hot steam to a turbine. This
system need to supply 100 psi hot steam to the turbine where the PCV-100 will be opened
when the pressure reached that desired pressure. With using pressure control through
temperature and pressure measurement in the boiler, draw a feedforward-plus-feedback
control loop system.
BOILER
Process variable need to be
controlled = Pressure
Water Hot steam
PIPING AND INSTRUMENTATION DIAGRAM (P&ID)
Answer 2
BOILER
TT
Process variable need to be
controlled = Pressure
TIC
Y
Water Hot steam
PIC
 Figure below shows the boiler system that used to supply hot steam to a turbine. This system need
to supply 100 psi hot steam to the turbine where the PCV-100 will be opened when the pressure
reached that desired pressure. With using pressure control through temperature and pressure
measurement in the boiler, draw a feedforward-plus-feedback control loop system.
PT

PIPING AND INSTRUMENTATION DIAGRAM (P&ID)
Ratio Control
 Ratio control is used to ensure that two or more flows are kept at
the same ratio even if the flows are changing.
Water Acid
2 part of water
1 part of acid
FT
FT
FF
FIC
PIPING AND INSTRUMENTATION DIAGRAM (P&ID)
Ratio Control (cont…)
Application: - Blending two or more flows to produce a mixture with
specified composition.
- Blending two or more flows to produce a mixture with
specified physical properties.
- Maintaining correct air and fuel mixture to combustion.
Water Acid
2 part of water
1 part of acid
FT
FT
FF
FIC
PIPING AND INSTRUMENTATION DIAGRAM (P&ID)
Ratio Control (Auto Adjusted)
- If the physical characteristic of the mixed flow is measured, a PID controller can be used
to manipulate the ratio value.
- For example, a measurement of the density, gasoline octane rating, color, or other
characteristic could be used to control that characteristic by manipulating the ratio.
Water Acid
2 part of water
1 part of acid
FT
FT
FF
FIC
AIC
Remote Ratio
Adjustment
Remote Set Point
Physical Property
Measurement
PIPING AND INSTRUMENTATION DIAGRAM (P&ID)
Cascade Control
 Cascade Control uses the output of the primary controller to manipulate the set point of
the secondary controller as if it were the final control element.
Reasons for cascade control:
- Allow faster secondary controller to
handle disturbances in the secondary
loop.
- Allow secondary controller to handle
non-linear valve and other final control
element problems.
- Allow operator to directly control
secondary loop during certain modes of
operation (such as startup).
PIPING AND INSTRUMENTATION DIAGRAM (P&ID)
Cascade Control (cont…)
Requirements for cascade control:
- Secondary loop process dynamics must
be at least four times as fast as primary
loop process dynamics.
- Secondary loop must have influence
over the primary loop.
- Secondary loop must be measured and
controllable.
PIPING AND INSTRUMENTATION DIAGRAM (P&ID)
Exercise 3
 Figure below shows pH adjustment process where pH 6.5 need to be maintained. pH in
the tank is controlled by NaOH dosing to the tank. But somehow, the flow of waste
(pH 4.5) also need to considered where excess flow of the waste shall make that pH in the
tank will decrease. Draw a cascade control loop system.
Process variable need to be
controlled = pH
NaOH Tank
pH Adjustment Tank
Waste, pH 4.5
pH 6.5
PIPING AND INSTRUMENTATION DIAGRAM (P&ID)
Answer 3
 Figure below shows pH adjustment process where pH 6.5 need to be maintained. pH in the tank is
controlled by NaOH dosing to the tank. But somehow, the flow of waste (pH 4.5) also need to
considered where excess flow of the waste shall make that pH in the tank will decrease. Draw a cascade
control loop system.
Process variable need to be
controlled = pH
pHT
FT
pHC
FC Y
NaOH Tank
pH Adjustment Tank
Waste, pH 4.5
pH 6.5
PIPING AND INSTRUMENTATION DIAGRAM (P&ID)
Split Range Control
FC
FT
Valve A
Valve B
PIPING AND INSTRUMENTATION DIAGRAM (P&ID)
Split Range Control
TK-100
(pH adjustment tank)
TK-101
(acid feed tank)
The diagram shows pH
adjustment; part of waste
water treatment process.
The process shall
maintained at pH 6. When
the process liquid states
below pH 6, CV-102 will be
opened to dosing NaOH to
the tank TK-100. When the
process liquid states above
pH 6, CV-101 will be
operated to dosing HCl.
TK-102
(base feed tank)
CV-101
CV-102
pHT 1
pHIC
PIPING AND INSTRUMENTATION DIAGRAM (P&ID)
Prepared by,
MISS RAHIMAH OTHMAN
THANK YOU

More Related Content

Similar to Piping and Instrumentation drawings basics

Internship_Report
Internship_ReportInternship_Report
Internship_Report
Fasih Ahmed
 
Load Match Next Generation
Load Match Next GenerationLoad Match Next Generation
Load Match Next Generation
kiakaha
 

Similar to Piping and Instrumentation drawings basics (20)

Urhe cf y-un50_00
Urhe cf y-un50_00Urhe cf y-un50_00
Urhe cf y-un50_00
 
Urhe cf y-un50_00
Urhe cf y-un50_00Urhe cf y-un50_00
Urhe cf y-un50_00
 
Dvm hydro sales Presentation
Dvm hydro sales PresentationDvm hydro sales Presentation
Dvm hydro sales Presentation
 
Internship_Report
Internship_ReportInternship_Report
Internship_Report
 
1 Hoja especificaciones.pdf
1 Hoja especificaciones.pdf1 Hoja especificaciones.pdf
1 Hoja especificaciones.pdf
 
Introduction to Oil Facility Layout.ppt
Introduction to Oil Facility Layout.pptIntroduction to Oil Facility Layout.ppt
Introduction to Oil Facility Layout.ppt
 
Load Match Next Generation
Load Match Next GenerationLoad Match Next Generation
Load Match Next Generation
 
Ank y na60_00
Ank y na60_00Ank y na60_00
Ank y na60_00
 
fundamentals of Piping engineering
fundamentals of Piping engineeringfundamentals of Piping engineering
fundamentals of Piping engineering
 
Chem Chapter.ppt
Chem Chapter.pptChem Chapter.ppt
Chem Chapter.ppt
 
Flow proses aseton
Flow proses asetonFlow proses aseton
Flow proses aseton
 
System_Guide_GB_low.pdf
System_Guide_GB_low.pdfSystem_Guide_GB_low.pdf
System_Guide_GB_low.pdf
 
Fabrication of Ranque Hilsch Vortex Tube
Fabrication of Ranque Hilsch Vortex TubeFabrication of Ranque Hilsch Vortex Tube
Fabrication of Ranque Hilsch Vortex Tube
 
Cge666 chapter 1-wk 1-2
Cge666 chapter 1-wk 1-2Cge666 chapter 1-wk 1-2
Cge666 chapter 1-wk 1-2
 
Lectures-CLL361.pdf
Lectures-CLL361.pdfLectures-CLL361.pdf
Lectures-CLL361.pdf
 
RUDRA 7 portfolio
RUDRA 7 portfolioRUDRA 7 portfolio
RUDRA 7 portfolio
 
Product
ProductProduct
Product
 
Bfd pfd-pid
Bfd pfd-pidBfd pfd-pid
Bfd pfd-pid
 
Shell and tube heat exchanger design comparison
Shell and tube heat exchanger design comparisonShell and tube heat exchanger design comparison
Shell and tube heat exchanger design comparison
 
AFWF Cooling System
AFWF Cooling SystemAFWF Cooling System
AFWF Cooling System
 

Recently uploaded

Cara Menggugurkan Sperma Yang Masuk Rahim Biyar Tidak Hamil
Cara Menggugurkan Sperma Yang Masuk Rahim Biyar Tidak HamilCara Menggugurkan Sperma Yang Masuk Rahim Biyar Tidak Hamil
Cara Menggugurkan Sperma Yang Masuk Rahim Biyar Tidak Hamil
Cara Menggugurkan Kandungan 087776558899
 
XXXXXXXXXXXXXXXXXXXXXXXXXXXXXXXXXXXXXXXXXXXXXXXXXXXX
XXXXXXXXXXXXXXXXXXXXXXXXXXXXXXXXXXXXXXXXXXXXXXXXXXXXXXXXXXXXXXXXXXXXXXXXXXXXXXXXXXXXXXXXXXXXXXXXXXXXXXXX
XXXXXXXXXXXXXXXXXXXXXXXXXXXXXXXXXXXXXXXXXXXXXXXXXXXX
ssuser89054b
 
1_Introduction + EAM Vocabulary + how to navigate in EAM.pdf
1_Introduction + EAM Vocabulary + how to navigate in EAM.pdf1_Introduction + EAM Vocabulary + how to navigate in EAM.pdf
1_Introduction + EAM Vocabulary + how to navigate in EAM.pdf
AldoGarca30
 
Standard vs Custom Battery Packs - Decoding the Power Play
Standard vs Custom Battery Packs - Decoding the Power PlayStandard vs Custom Battery Packs - Decoding the Power Play
Standard vs Custom Battery Packs - Decoding the Power Play
Epec Engineered Technologies
 
Verification of thevenin's theorem for BEEE Lab (1).pptx
Verification of thevenin's theorem for BEEE Lab (1).pptxVerification of thevenin's theorem for BEEE Lab (1).pptx
Verification of thevenin's theorem for BEEE Lab (1).pptx
chumtiyababu
 
Call Girls in South Ex (delhi) call me [🔝9953056974🔝] escort service 24X7
Call Girls in South Ex (delhi) call me [🔝9953056974🔝] escort service 24X7Call Girls in South Ex (delhi) call me [🔝9953056974🔝] escort service 24X7
Call Girls in South Ex (delhi) call me [🔝9953056974🔝] escort service 24X7
9953056974 Low Rate Call Girls In Saket, Delhi NCR
 

Recently uploaded (20)

AIRCANVAS[1].pdf mini project for btech students
AIRCANVAS[1].pdf mini project for btech studentsAIRCANVAS[1].pdf mini project for btech students
AIRCANVAS[1].pdf mini project for btech students
 
NO1 Top No1 Amil Baba In Azad Kashmir, Kashmir Black Magic Specialist Expert ...
NO1 Top No1 Amil Baba In Azad Kashmir, Kashmir Black Magic Specialist Expert ...NO1 Top No1 Amil Baba In Azad Kashmir, Kashmir Black Magic Specialist Expert ...
NO1 Top No1 Amil Baba In Azad Kashmir, Kashmir Black Magic Specialist Expert ...
 
Cara Menggugurkan Sperma Yang Masuk Rahim Biyar Tidak Hamil
Cara Menggugurkan Sperma Yang Masuk Rahim Biyar Tidak HamilCara Menggugurkan Sperma Yang Masuk Rahim Biyar Tidak Hamil
Cara Menggugurkan Sperma Yang Masuk Rahim Biyar Tidak Hamil
 
XXXXXXXXXXXXXXXXXXXXXXXXXXXXXXXXXXXXXXXXXXXXXXXXXXXX
XXXXXXXXXXXXXXXXXXXXXXXXXXXXXXXXXXXXXXXXXXXXXXXXXXXXXXXXXXXXXXXXXXXXXXXXXXXXXXXXXXXXXXXXXXXXXXXXXXXXXXXX
XXXXXXXXXXXXXXXXXXXXXXXXXXXXXXXXXXXXXXXXXXXXXXXXXXXX
 
Wadi Rum luxhotel lodge Analysis case study.pptx
Wadi Rum luxhotel lodge Analysis case study.pptxWadi Rum luxhotel lodge Analysis case study.pptx
Wadi Rum luxhotel lodge Analysis case study.pptx
 
S1S2 B.Arch MGU - HOA1&2 Module 3 -Temple Architecture of Kerala.pptx
S1S2 B.Arch MGU - HOA1&2 Module 3 -Temple Architecture of Kerala.pptxS1S2 B.Arch MGU - HOA1&2 Module 3 -Temple Architecture of Kerala.pptx
S1S2 B.Arch MGU - HOA1&2 Module 3 -Temple Architecture of Kerala.pptx
 
FEA Based Level 3 Assessment of Deformed Tanks with Fluid Induced Loads
FEA Based Level 3 Assessment of Deformed Tanks with Fluid Induced LoadsFEA Based Level 3 Assessment of Deformed Tanks with Fluid Induced Loads
FEA Based Level 3 Assessment of Deformed Tanks with Fluid Induced Loads
 
1_Introduction + EAM Vocabulary + how to navigate in EAM.pdf
1_Introduction + EAM Vocabulary + how to navigate in EAM.pdf1_Introduction + EAM Vocabulary + how to navigate in EAM.pdf
1_Introduction + EAM Vocabulary + how to navigate in EAM.pdf
 
Design For Accessibility: Getting it right from the start
Design For Accessibility: Getting it right from the startDesign For Accessibility: Getting it right from the start
Design For Accessibility: Getting it right from the start
 
Introduction to Serverless with AWS Lambda
Introduction to Serverless with AWS LambdaIntroduction to Serverless with AWS Lambda
Introduction to Serverless with AWS Lambda
 
Standard vs Custom Battery Packs - Decoding the Power Play
Standard vs Custom Battery Packs - Decoding the Power PlayStandard vs Custom Battery Packs - Decoding the Power Play
Standard vs Custom Battery Packs - Decoding the Power Play
 
Generative AI or GenAI technology based PPT
Generative AI or GenAI technology based PPTGenerative AI or GenAI technology based PPT
Generative AI or GenAI technology based PPT
 
Verification of thevenin's theorem for BEEE Lab (1).pptx
Verification of thevenin's theorem for BEEE Lab (1).pptxVerification of thevenin's theorem for BEEE Lab (1).pptx
Verification of thevenin's theorem for BEEE Lab (1).pptx
 
Call Girls in South Ex (delhi) call me [🔝9953056974🔝] escort service 24X7
Call Girls in South Ex (delhi) call me [🔝9953056974🔝] escort service 24X7Call Girls in South Ex (delhi) call me [🔝9953056974🔝] escort service 24X7
Call Girls in South Ex (delhi) call me [🔝9953056974🔝] escort service 24X7
 
Unit 4_Part 1 CSE2001 Exception Handling and Function Template and Class Temp...
Unit 4_Part 1 CSE2001 Exception Handling and Function Template and Class Temp...Unit 4_Part 1 CSE2001 Exception Handling and Function Template and Class Temp...
Unit 4_Part 1 CSE2001 Exception Handling and Function Template and Class Temp...
 
Bhubaneswar🌹Call Girls Bhubaneswar ❤Komal 9777949614 💟 Full Trusted CALL GIRL...
Bhubaneswar🌹Call Girls Bhubaneswar ❤Komal 9777949614 💟 Full Trusted CALL GIRL...Bhubaneswar🌹Call Girls Bhubaneswar ❤Komal 9777949614 💟 Full Trusted CALL GIRL...
Bhubaneswar🌹Call Girls Bhubaneswar ❤Komal 9777949614 💟 Full Trusted CALL GIRL...
 
DC MACHINE-Motoring and generation, Armature circuit equation
DC MACHINE-Motoring and generation, Armature circuit equationDC MACHINE-Motoring and generation, Armature circuit equation
DC MACHINE-Motoring and generation, Armature circuit equation
 
data_management_and _data_science_cheat_sheet.pdf
data_management_and _data_science_cheat_sheet.pdfdata_management_and _data_science_cheat_sheet.pdf
data_management_and _data_science_cheat_sheet.pdf
 
Online electricity billing project report..pdf
Online electricity billing project report..pdfOnline electricity billing project report..pdf
Online electricity billing project report..pdf
 
Thermal Engineering Unit - I & II . ppt
Thermal Engineering  Unit - I & II . pptThermal Engineering  Unit - I & II . ppt
Thermal Engineering Unit - I & II . ppt
 

Piping and Instrumentation drawings basics

  • 1. ERT 422/4 Piping and instrumentation diagram (P&id) MISS. RAHIMAH BINTI OTHMAN (Email: rahimah@unimap.edu.my)
  • 2. COURSE OUTCOMES CO RECOGNIZE all the piping and instrumentation symbols, CHOOSE suitable symbols and DEVELOP the piping systems and the specification of the process instrumentation, equipment, piping, valves, fittings; and their arrangement in P&ID for the bioprocess plant design.
  • 3. OUTLINES  TYPES of piping and instrumentation symbols.  How to CHOOSE the suitable symbols in control system?  How to DEVELOP the piping systems and the specification of the process instrumentation, equipment, piping, valves, fittings.  The ARRANGEMENT in P&ID for the bioprocess plant design.
  • 4. PROCESS DIAGRAMS Block Flow Diagram (BFD) Process Flow Diagram (PFD) Piping and Instrumentation Diagram (P&ID) Process equipments symbol and numbering
  • 5. PROCESS DIAGRAMS Block Flow Diagram (BFD) Process Flow Diagram (PFD) Piping and Instrumentation Diagram (P&ID) Process equipments symbol and numbering
  • 6. BLOCK FLOW DIAGRAM (BFD)  Is the simplest flowsheet.  Process engineer begins the process design with a block diagram in which only the feed and product streams are identified.  Input-output diagrams are not very detailed and are most useful in early stages of process development.  Flow of raw materials and products may be included on a BFD.  The processes described in the BFD, are then broken down into basic functional elements such as reaction and separation sections.  Also identify the recycle streams and additional unit operations to achieve the desired operating conditions.
  • 7. Reactor Gas Separator Toluene, C7H8 10,000 kg/hr Hydrogen H2 820 kg/hr Mixed Liquid 75% Conversion of Toluene Mixed Gas 2610 kg/hr Benzene, C6H6 8,210 kg/hr Reaction : C7H8 + H2 C6H6 + CH4 Figure 1: Block Flow Diagram for the Production of Benzene C6H6 CH4 C7H8 Example 1: BLOCK FLOW DIAGRAM (BFD)
  • 8. Production of Ethane from Ethanol Ethanol is feed to continuous reactor with presence of Acid Sulphuric catalyzer to produce ethylene. Distillation process then will be applied to separate ethylene-H2O mixture. Ethylene as a top product is then condensate with condenser to perform liquid ethylene. Hydrogenation of ethylene applies in another reactor with presence of Nickel catalyzer to produce ethane as a final product. Develop BFD for these processes. Reactor 1 Ethanol, C2H5OH H2SO4 Reactor 2 Distillation column Ethylene, CH2CH2 (g) Ethane, CH3CH3 CH3CH2OH H2SO4 CH2=CH2 + H2O CH2=CH2 + H2 Ni CH3CH3 Ni Hydrogen, H2 Cold water in Hot water out H2O CH2CH2 H2O Ethylene liq. CH2CH2 (l) Example 2: Answer:
  • 9. Ammonia-air mixture is feed to the bottom stream of an absorber with flow rate of 10L/min. Water then feed to the upper stream of the same absorber with desired flow rate of 5L/min. There are two outputs from the absorber where upper stream is insoluble NH3 and bottom stream is NH3-Water mixture. This NH3-water mixture then feed up to a batch distillation column. The column produces ammonia gas as a top product which this product then will be condensate with a condenser to produce liquid ammonia. Develop Block Flow Diagram (BFD) for this process. Example 3: Absorber Batch Distillation Water 5 L/min Ammonia-air mixture 10 L/min Insoluble ammonia Ammonia-water mixture Ammonia gas Cold water in Hot water out Ammonia liquid Condenser
  • 10. PROCESS DIAGRAMS Block Flow Diagram (BFD) Process Flow Diagram (PFD) Piping and Instrumentation Diagram (P&ID) Process equipments symbol and numbering
  • 11. A Process Flow Diagram generally includes following information; a) Flow rate of each stream in case of continuous process or quality of each reactant in case of a batch process. b) Composition streams. c) Operating conditions of each stream such as pressure , temperature, concentration, etc. d) Heat added or removed in a particular equipment. e) Flows of utilities such as stream, cooling water, brine, hot oil, chilled water, thermal fluid, etc. f) Major equipment symbols, names and identification. g) Any specific information which is useful in understanding the process. For example, symbolic presentation of a hazard, safety precautions, sequence of flow, etc. PROCESS FLOW DIAGRAM (PFD)
  • 12. PFD 1. Major Pieces Of Equipment 2. Utility Streams 3. Process Flow Streams 4. Basic Control Loops
  • 14. PFD 1. Major Pieces Of Equipment 2. Utility Streams 3. Process Flow Streams 4. Basic Control Loops
  • 15. PFD will contains the following information:- 1. All major pieces of equipment (descriptive name, unique equipment no.), pumps and valves. 2. All the utility streams supplied to major equipments such as steam lines, compressed air lines, electricity, etc. PROCESS FLOW DIAGRAM (PFD)
  • 16. Process Unit Symbology Symbol Description Heat exchanger H2O Water cooler S Steam heater Cooling coil PROCESS FLOW DIAGRAM (PFD)
  • 17. Process Unit Symbology Symbol Description Heater coil Centrifugal pump Turbine type compressor Pressure gauge PROCESS FLOW DIAGRAM (PFD)
  • 18. Process Unit Symbology Symbol Name Stripper Absorber A separator unit used commonly to liquid mixture into gas phase. Description A separator unit used commonly to extract mixture gas into liquid phase. PROCESS FLOW DIAGRAM (PFD)
  • 19. Process Unit Symbology Symbol Name Distillation column Liquid mixer A separator unit used commonly to crack liquid contains miscellaneous component fractions. Description A process unit that used to mix several components of liquid. or PROCESS FLOW DIAGRAM (PFD)
  • 20. Process Unit Symbology Symbol Name Reaction chamber Horizontal tank or cylinder A process unit where chemical process reaction occurs Description A unit to store liquid or gas. PROCESS FLOW DIAGRAM (PFD)
  • 21. Process Unit Symbology Symbol Name Boiler Centrifuge A unit for heating. Description A separator unit that to physically separated liquid mixture. (exp: oil-liquid) PROCESS FLOW DIAGRAM (PFD)
  • 22. Valve Symbology Symbol Name Gate Valve Check Valve Globe Valve Ball Valve Butterfly Valve PROCESS FLOW DIAGRAM (PFD)
  • 23. Valve Symbology Symbol Name Relief Valve Angle Valve Needle Valve 3-Way Valve Butterfly Valve PROCESS FLOW DIAGRAM (PFD)
  • 24. EXAMPLE 4 Production of Ethane from Ethanol Ethanol is feed to continuous reactor with presence of Acid Sulphuric catalyzer to produce ethylene. Distillation process then will be applied to separate ethylene-H2O mixture. Ethylene as a top product is then condensate with condenser to perform liquid ethylene. Hydrogenation of ethylene applies in another reactor with presence of Nickel catalyzer to produce ethane as a final product. Develop PFD for these processes. CH3CH2OH H2SO4 CH2=CH2 + H2O CH2=CH2 + H2 Ni CH3CH3 T-100 Distillation Column Ethanol H2SO4 Ethylene Ethylene liq. Ethane Ni Hydrogen Cold water in Hot water out H2O R-100 Reactor E-100 Condenser R-101 Reactor R-100 T-100 E-100 R-101 P-100 Pump P-101 Pump P-100 P-101 V-100 V-101 V-102 V-103 V-104 V-105 V-106 V-107 CV-101 CV-100
  • 25. Ammonia-air mixture is feed to the bottom stream of an absorber with flow rate of 10L/min. Water then feed to the upper stream of the same absorber with desired flow rate of 5L/min. There are two outputs from the absorber where upper stream is insoluble NH3 and bottom stream is NH3-Water mixture. This NH3-water mixture then feed up to a batch distillation column. The column produces ammonia gas as a top product which this product then will be condensate with a condenser to produce liquid ammonia. Develop Process Flow Diagram (PFD) for this process. EXAMPLE 5 Water 5 L/min Ammonia-air mixture 10 L/min Insoluble ammonia gas Ammonia-water mixture Ammonia gas Cold water in Hot water out Ammonia liquid T-100 Absorber Column T-101 Batch Distillation Column E-100 Condenser
  • 26. Process Equipment General Format XX-YZZ A/B XX are the identification letters for the equipment classification C - Compressor or Turbine E - Heat Exchanger H - Fired Heater P - Pump R - Reactor T - Tower TK - Storage Tank V - Vessel Y - designates an area within the plant ZZ - are the number designation for each item in an equipment class A/B - identifies parallel units or backup units not shown on a PFD Supplemental Information Additional description of equipment given on top of PFD Process Unit Tagging and Numbering PROCESS FLOW DIAGRAM (PFD)
  • 27. A/B Letter Example Ethanol H2SO4 Ethylene Ethylene liq. Ethane Ni Hydrogen Cold water in Hot water out H2O P-100 A/B In PFD Ethylene Ethylene liq. Ethane Ni Hydrogen Cold water in Hot water out H2O P-100 A P-100 B In Real Plant PROCESS FLOW DIAGRAM (PFD) Ethanol H2SO4
  • 28. PFD 1. Major Pieces Of Equipment 2. Utility Streams 3. Process Flow Streams 4. Basic Control Loops
  • 29. PFD will contains the following information:- All process flow streams: identification by a number, process condition, chemical composition. PROCESS FLOW DIAGRAM (PFD)
  • 30. Stream Numbering and Drawing - Number streams from left to right as much as possible. - Horizontal lines are dominant. Yes No No PROCESS FLOW DIAGRAM (PFD)
  • 31. EXAMPLE 4- CONT’ T-100 Distillation Column Ethanol H2SO4 Ethylene Ethylene liq. Ethane Ni Hydrogen Cold water in Hot water out H2O R-100 Reactor E-100 Condenser R-101 Reactor R-100 T-100 E-100 R-101 P-100 Pump P-101 Pump 1 2 3 4 5 6 7 8 9 10 V-100 V-101 V-102 V-103 V-104 V-105 V-106 V-107 CV-100 CV-101 P-100 P-101
  • 32. Stream Information -Since diagrams are small not much stream information can be included. -Include important data – around reactors and towers, etc.  Flags are used  Full stream data PROCESS FLOW DIAGRAM (PFD)
  • 33. 1 2 3 4 5 6 7 8 11 9 10 12 13 600 24 24 300 Stream Information - Flag 600 Temperature 24 Pressure 10.3 Mass Flowrate 108 Molar Flowrate Gas Flowrate Liquid Flowrate PROCESS FLOW DIAGRAM (PFD)
  • 34. EXAMPLE 4- CONT’ 25 28 35 32.2 35 31.0 38 20 T-100 Distillation Column Ethanol H2SO4 Ethylene Ethylene liq. Ethane Ni Hydrogen Cold water in Hot water out H2O R-100 Reactor E-100 Condenser R-101 Reactor R-100 T-100 E-100 R-101 P-100 Pump P-101 Pump 1 2 3 4 5 6 7 8 9 10 V-100 V-101 V-102 V-103 V-104 V-105 V-106 V-107 CV-100 CV-101 P-100 P-101
  • 35. Stream Number 1 2 3 4 5 6 7 8 9 10 Temperature (oC) 25.0 35.0 35.0 35.0 35.0 60.3 41 38 54.0 45.1 Pressure (psi) 28 32.2 31.0 31.0 30.2 45.1 31.3 24.0 39.0 2.6 Vapor fraction Mass flow (tonne/hr) 10.3 13.3 0.82 20.5 6.41 20.5 0.36 9.2 20.9 11.6 Mole flow (kmol/hr) 108 114.2 301.0 1204.0 758.8 1204.4 42.6 1100.8 142.2 244.0 Stream Information - Full stream data: PROCESS FLOW DIAGRAM (PFD)
  • 36. EXAMPLE 4- CONT’ Stream Number 1 2 3 4 5 6 7 8 9 10 Temperature (oC) 25.0 35.0 35.0 35.0 35.0 60.3 41 38 54 45.1 Pressure (psi) 28 32.2 31.0 31.0 30.2 45.1 31.3 24.0 39 2.6 Vapor fraction Mass flow (tonne/hr) 10.3 13.3 0.82 20.5 6.41 20.5 0.36 9.2 20.9 11.6 Mole flow (kmol/hr) 108 114.2 301.0 1204.0 758.8 1204.4 42.6 1100.8 142.2 244.0 25 28 35 32.2 35 31.0 38 20 T-100 Distillation Column Ethanol H2SO4 Ethylene Ethylene liq. Ethane Ni Hydrogen Cold water in Hot water out H2O R-100 Reactor E-100 Condenser R-101 Reactor R-100 T-100 E-100 R-101 P-100 Pump P-101 Pump 1 2 3 4 5 6 7 8 9 10 V-101 V-102 V-103 CV-100 V-100 V-104 V-105 V-106 V-107 CV-101 P-100 P-101
  • 37. PFD 1. Major Pieces Of Equipment 2. Utility Streams 3. Process Flow Streams 4. Basic Control Loops
  • 38. PFD will contains the following information:- - Basic control loops: showing the control strategy used to operate the process under normal operations. PROCESS FLOW DIAGRAM (PFD)
  • 39. Stream Number 1 2 3 4 5 6 7 8 9 10 Temperature (oC) 25.0 35.0 35.0 35.0 35.0 60.3 41 38 54 45.1 Pressure (psi) 28 32.2 31.0 31.0 30.2 45.1 31.3 24.0 39 2.6 Vapor fraction Mass flow (tonne/hr) 10.3 13.3 0.82 20.5 6.41 20.5 0.36 9.2 20.9 11.6 Mole flow (kmol/hr) 108 114.2 301.0 1204.0 758.8 1204.4 42.6 1100.8 142.2 244.0 T-100 Distillation Column R-100 Reactor E-100 Condenser R-101 Reactor P-100 Pump P-101 Pump 25 28 35 32.2 35 31.0 38 20 Ethanol H2SO4 Ethylene Ethylene liq. Ethane Ni Hydrogen Cold water in Hot water out H2O R-100 T-100 E-100 R-101 1 2 3 4 5 6 7 8 9 10 LIC LIC V-100 V-101 V-103 V-102 CV-100 V-104 V-105 V-106 CV-101 V-107 P-100 P-101 EXAMPLE 4- CONT’
  • 40. FLYSIS CHEMICAL (M) SDN. BHD PROCESS FLOW DIAGRAM PRODUCTION OF ETHANE FROM ETHANOL ISSUED : PAGE : 1 OF 1 DRAWN BY : APPROVED BY : fs 244.0 142.2 1100.8 42.6 1204.4 758.8 1204.0 301.0 114.2 108 Mole flow (kmol/hr) 11.6 20.9 9.2 0.36 20.5 6.41 20.5 0.82 13.3 10.3 Mass flow (tonne/hr) Vapor fraction 2.6 39 24.0 31.3 45.1 30.2 31.0 31.0 32.2 28 Pressure (psi) 45.1 54 38 41 60.3 35.0 35.0 35.0 35.0 25.0 Temperature (oC) 10 9 8 7 6 5 4 3 2 1 Stream Number 244.0 142.2 1100.8 42.6 1204.4 758.8 1204.0 301.0 114.2 108 Mole flow (kmol/hr) 11.6 20.9 9.2 0.36 20.5 6.41 20.5 0.82 13.3 10.3 Mass flow (tonne/hr) Vapor fraction 2.6 39 24.0 31.3 45.1 30.2 31.0 31.0 32.2 28 Pressure (psi) 45.1 54 38 41 60.3 35.0 35.0 35.0 35.0 25.0 Temperature (oC) 10 9 8 7 6 5 4 3 2 1 Stream Number NOTE: GATE VALVE GLOBE VALVE CHECK VALVE PNEUMATIC DIAPHRAGM VALVE T-100 Distillation Column R-100 Reactor E-100 Condenser R-101 Reactor P-100 Pump P-101 Pump 25 28 35 32.2 35 31.0 38 20 Ethanol H2SO4 Ethylene Ethylene liq. Ethane Ni Hydrogen Cold water in Hot water out H2O R-100 T-100 E-100 R-101 1 2 3 4 5 6 7 8 9 10 LIC LIC V-100 V-101 V-103 V-102 CV-100 V-104 V-105 V-106 CV-101 V-107 P-100 P-101 T-100 Distillation Column R-100 Reactor E-100 Condenser R-101 Reactor P-100 Pump P-101 Pump 25 28 25 28 35 32.2 35 32.2 35 31.0 35 31.0 38 20 Ethanol H2SO4 Ethylene Ethylene liq. Ethane Ni Hydrogen Cold water in Hot water out H2O R-100 T-100 T-100 E-100 R-101 R-101 1 2 3 4 5 6 7 8 9 10 LIC LIC V-100 V-101 V-103 V-102 CV-100 V-104 V-105 V-106 CV-101 V-107 P-100 P-101
  • 41. PROCESS DIAGRAMS Block Flow Diagram (BFD) Process Flow Diagram (PFD) Piping and Instrumentation Diagram (P&ID) Process equipments symbol and numbering
  • 42.  Also known as “PROCESS & INSTRUMENTATION DIAGRAM”  Detailed graphical representation of a process including the hardware and software (i.e piping, equipment, and instrumentation) necessary to design, construct and operate the facility.  Common synonyms for P&IDs include Engineering Flow Diagram (EFD), Utility Flow Diagram (UFD) and Mechanical Flow Diagram (MFD). PIPING AND INSTRUMENTATION DIAGRAM (P&ID)
  • 43. PIPING AND INSTRUMENTATION DIAGRAM (P&ID) PFD
  • 44. PIPING AND INSTRUMENTATION DIAGRAM (P&ID) P&ID
  • 45. Basic Loop Process Sensing Element Measuring Element Transmit Element Control Element Final Control Element Transmitter PIPING AND INSTRUMENTATION DIAGRAM (P&ID)
  • 46. Basic Loop Transmitter Controller Orifice (Flow Sensor) Set point Fluid Fluid PIPING AND INSTRUMENTATION DIAGRAM (P&ID)
  • 47. SENSORS (Sensing Element)  A device, such as a photoelectric cell, that receives and responds to a signal or stimulus.  A device, usually electronic, which detects a variable quantity and measures and converts the measurement into a signal to be recorded elsewhere.  A sensor is a device that measures a physical quantity and converts it into a signal which can be read by an observer or by an instrument.  For example, a mercury thermometer converts the measured temperature into expansion and contraction of a liquid which can be read on a calibrated glass tube. A thermocouple converts temperature to an output voltage which can be read by a voltmeter.  For accuracy, all sensors need to be calibrated against known standards. PIPING AND INSTRUMENTATION DIAGRAM (P&ID)
  • 48. TEMPERATURE SENSOR A thermocouple is a junction between two different metals that produces a voltage related to a temperature difference. Thermocouples are a widely used type of temperature sensor and can also be used to convert heat into electric power. 1. Thermocouple PIPING AND INSTRUMENTATION DIAGRAM (P&ID)
  • 49. TEMPERATURE SENSOR 2. Resistance Temperature Detector (RTD) Resistance Temperature Detectors (RTD), as the name implies, are sensors used to measure temperature by correlating the resistance of the RTD element with temperature. Most RTD elements consist of a length of fine coiled wire wrapped around a ceramic or glass core. The element is usually quite fragile, so it is often placed inside a sheathed probe to protect it. The RTD element is made from a pure material whose resistance at various temperatures has been documented. The material has a predictable change in resistance as the temperature changes; it is this predictable change that is used to determine temperature. PIPING AND INSTRUMENTATION DIAGRAM (P&ID)
  • 50. Accuracy for Standard OMEGA RTDs Temperature °C Ohms °C -200 ±056 ±1.3 -100 ±0.32 ±0.8 0 ±0.12 ±0.3 100 ±0.30 ±0.8 200 ±0.48 ±1.3 300 ±0.64 ±1.8 400 ±0.79 ±2.3 500 ±0.93 ±2.8 600 ±1.06 ±3.3 650 ±1.13 ±3.6 PIPING AND INSTRUMENTATION DIAGRAM (P&ID)
  • 51. FLOW SENSOR 1. Turbine Meter In a turbine, the basic concept is that a meter is manufactured with a known cross sectional area. A rotor is then installed inside the meter with its blades axial to the product flow. When the product passes the rotor blades, they impart an angular velocity to the blades and therefore to the rotor. This angular velocity is directly proportional to the total volumetric flow rate. Turbine meters are best suited to large, sustained flows as they are susceptible to start/stop errors as well as errors caused by unsteady flow states. PIPING AND INSTRUMENTATION DIAGRAM (P&ID)
  • 52. FLOW SENSOR 2. Magnetic Flow Meter Measurement of slurries and of corrosive or abrasive or other difficult fluids is easily made. There is no obstruction to fluid flow and pressure drop is minimal. The meters are unaffected by viscosity, density, temperature, pressure and fluid turbulence. Magnetic flow meters utilize the principle of Faraday’s Law of Induction; similar principle of an electrical generator. When an electrical conductor moves at right angle to a magnetic field, a voltage is induced. PIPING AND INSTRUMENTATION DIAGRAM (P&ID)
  • 54. FLOW SENSOR 3. Orifice Meter PIPING AND INSTRUMENTATION DIAGRAM (P&ID) • An orifice meter is a conduit and restriction to create a pressure drop. • A nozzle, venture or thin sharp edged orifice can be used as the flow restriction. • To use this type of device for measurement, it is necessary to empirically calibrate this device. • An orifice in a pipeline is shown in the figures with a manometer for measuring the drop in pressure (differential) as the fluid passes thru the orifice.
  • 55. FLOW SENSOR 4. Venturi Meter A device for measuring flow of a fluid in terms of the drop in pressure when the fluid flows into the constriction of a Venturi tube. A meter, developed by Clemens Herschel, for measuring flow of water or other fluids through closed conduits or pipes. It consists of a venturi tube and one of several forms of flow registering devices. PIPING AND INSTRUMENTATION DIAGRAM (P&ID)
  • 56. TRANSMITTER Transmitter is a transducer* that responds to a measurement variable and converts that input into a standardized transmission signal. *Transducer is a device that receives output signal from sensors. Pressure Transmitter Differential Pressure Transmitter Pressure Level Transmitter PIPING AND INSTRUMENTATION DIAGRAM (P&ID)
  • 57. CONTROLLER Controller is a device which monitors and affects the operational conditions of a given dynamical system. The operational conditions are typically referred to as output variables of the system which can be affected by adjusting certain input variables. Indicating Controller Recording Controller PIPING AND INSTRUMENTATION DIAGRAM (P&ID)
  • 58. FINAL CONTROL ELEMENT Final Control Element is a device that directly controls the value of manipulated variable of control loop. Final control element may be control valves, pumps, heaters, etc. Pump Control Valve Heater PIPING AND INSTRUMENTATION DIAGRAM (P&ID)
  • 59. PROCESS DIAGRAMS Block Flow Diagram (BFD) Process Flow Diagram (PFD) Piping and Instrumentation Diagram (P&ID) Process equipments symbol and numbering
  • 60. Instrumentation Symbology Instruments that are field mounted. -Instruments that are mounted on process plant (i.e sensor that mounted on pipeline or process equipments. Field mounted on pipeline PIPING AND INSTRUMENTATION DIAGRAM (P&ID)
  • 61. Instrumentation Symbology Instruments that are board mounted -Instruments that are mounted on control board. PIPING AND INSTRUMENTATION DIAGRAM (P&ID)
  • 62. Instrumentation Symbology Instruments that are board mounted (invisible). -Instruments that are mounted behind a control panel board. PIPING AND INSTRUMENTATION DIAGRAM (P&ID)
  • 63. Instrumentation Symbology Instruments that are functioned in Distributed Control System (DCS) - A distributed control system (DCS) refers to a control system usually of a manufacturing system, process or any kind of dynamic system, in which the controller elements are not central in location (like the brain) but are distributed throughout the system with each component sub-system controlled by one or more controllers. The entire system of controllers is connected by networks for communication and monitoring. PIPING AND INSTRUMENTATION DIAGRAM (P&ID)
  • 64. Instrumentation Symbology PIPING AND INSTRUMENTATION DIAGRAM (P&ID)
  • 65. FC Flow Controller PT Pressure Transmitter FE Flow Element PTD Pressure Transducer FI Flow Indicator FT Flow Transmitter LC Level Controller FS Flow Switch LG Level Gauge FIC Flow Indicating Controller LR Level Recorder FCV Flow Control Valve LT Level Transmitter FRC Flow Recording Controller LS Level Switch LIC Level Indicating Controller PC Pressure Controller LCV Level Control Valve PG Pressure Gauge LRC Level Recording Controller PI Pressure Indicator PR Pressure Recorder TE Temperature Element PIPING AND INSTRUMENTATION DIAGRAM (P&ID)
  • 66. PS Pressure Switch TI Temperature Indicator PIC Pressure Indicating Controller TR Temperature Recorder PCV Pressure Control Valve TS Temperature Switch PRC Pressure Recording Controller TC Temperature Controller PDI Pressure Differential Indicator TT Temperature Transmitter PDR Pressure Differential Recorder PDS Pressure Differential Switch PDT Pressure Differential Transmitter PIPING AND INSTRUMENTATION DIAGRAM (P&ID)
  • 67.
  • 68. Signal Lines Symbology PIPING AND INSTRUMENTATION DIAGRAM (P&ID)
  • 69. With using these following symbols; Complete control loop for LCV 101 Principal of P&ID Example 1 V-100 LCV 101 LV 100 LC LC LT PIPING AND INSTRUMENTATION DIAGRAM (P&ID)
  • 70. With using these following symbology; Draw control loop to show that PRV-100 will be activated to relief pressure when the pressure in the V-100 is higher than desired value. Example 2 V-100 PT Where PT is locally mounted Where PIC is function in DCS PRV-100 PT PIC PIC PE Where PE is locally mounted on V-100 PE The Piping & Instrumentation Diagram (P&ID) Sometimes also known as Process & Instrumentation Diagram PIPING AND INSTRUMENTATION DIAGRAM (P&ID)
  • 71. Exercise 1 TK-100 (pH adjustment tank) TK-101 (acid feed tank) The diagram shows pH adjustment; part of waste water treatment process. With using above symbols, draw control loop where the process need is: The process shall maintained at pH 6. When the process liquid states below pH 6, CV-102 will be opened to dosing NaOH to the tank TK-100. When the process liquid states above pH 6, CV-101 will be operated to dosing HCl. TK-102 (base feed tank) CV-101 CV-102 pHE 2 pHT 2 pHIC 2 pHE 1 pHT 1 pHIC 1 PIPING AND INSTRUMENTATION DIAGRAM (P&ID)
  • 72. Answer 1 TK-100 (pH adjustment tank) TK-101 (acid feed tank) The diagram shows pH adjustment; part of waste water treatment process. With using above symbols, draw control loop where the process need is: The process shall maintained at pH 6. When the process liquid states below pH 6, CV-102 will be opened to dosing NaOH in the base feed tank. When the process liquid states above pH 6, CV-101 will be operated to dosing HCl in the acid fed tank. TK-102 (base feed tank) CV-101 CV-102 pHTE 2 pHT 2 pHIC 2 pHE 1 pHT 1 pHIC 1 pHE 1 pHT 1 pHIC 1 pHE 2 pHT 2 pHIC 2 PIPING AND INSTRUMENTATION DIAGRAM (P&ID)
  • 73. Exercise 2 V-100 PCV-100 PCV-101 LT 1 TK-100 LIC 1 FC FC Where LT 1 and LIC 1 to control PCV-100 (failure close); PCV-100 close when level reached L 3 PCV-100 open when level below L3 L1 L2 L3 LT 2 LIC 2 Where LT 2 and LIC 2 to control PCV-101 (failure close); PCV-101 close when level reached L5 PCV-101 open when level below L5 L4 L5 PIPING AND INSTRUMENTATION DIAGRAM (P&ID)
  • 74. Answer 2 V-100 PRV-100 PRV-101 LT 1 TK-100 LIC 1 FC FC Where LT 1 and LIC 1 to control PRV-100 (failure close); PRV-100 close when level reached L 3 PRV-100 open when level below L3 L1 L2 L3 LT 2 LIC 2 Where LT 1 and LIC 1 to control PRV-101 (failure close); PRV-101 close when level reached L5 PRV-101 open when level below L5 L4 L5 LT 1 LIC 1 LT 2 LIC 2 PIPING AND INSTRUMENTATION DIAGRAM (P&ID)
  • 75. PROCESS DIAGRAMS Block Flow Diagram (BFD) Process Flow Diagram (PFD) Piping and Instrumentation Diagram (P&ID) Process equipments symbol and numbering
  • 76. Instrumentation Numbering  XYY CZZLL X represents a process variable to be measured. (T=temperature, F=flow, P=pressure, L=level) YY represents type of instruments. C designates the instruments area within the plant. ZZ designates the process unit number. LL designates the loop number. PIPING AND INSTRUMENTATION DIAGRAM (P&ID)
  • 77. Instrumentation Numbering  LIC 10003 L = Level shall be measured. IC = Indicating controller. 100 = Process unit no. 100 in the area of no. 1 03 = Loop number 3 PIPING AND INSTRUMENTATION DIAGRAM (P&ID)
  • 78. Instrumentation Numbering  FRC 82516 F = Flow shall be measured. RC = Recording controller 825 = Process unit no. 825 in the area of no. 8. 16 = Loop number 16 PIPING AND INSTRUMENTATION DIAGRAM (P&ID)
  • 79. PROCESS DIAGRAMS Block Flow Diagram (BFD) Process Flow Diagram (PFD) Piping and Instrumentation Diagram (P&ID) Process equipments symbol and numbering
  • 81. Type of Process Control Loop  Feedback Control  Feedforward Control  Feedforward-plus-Feedback Control  Ratio Control  Split Range Control  Cascade Control  Differential Control PIPING AND INSTRUMENTATION DIAGRAM (P&ID)
  • 82. Feedback Control  One of the simplest process control schemes.  A feedback loop measures a process variable and sends the measurement to a controller for comparison to set point. If the process variable is not at set point, control action is taken to return the process variable to set point.  The advantage of this control scheme is that it is simple using single transmitter.  This control scheme does not take into consideration any of the other variables in the process. V-100 LCV-100 LC V-100 Fluid in Fluid out LT Y PIPING AND INSTRUMENTATION DIAGRAM (P&ID)
  • 83. Feedback Control (cont…)  Feedback loop are commonly used in the process control industry.  The advantage of a feedback loop is that directly controls the desired process variable.  The disadvantage of feedback loops is that the process variable must leave set point for action to be taken. V-100 LCV-100 LC V-100 Fluid in Fluid out LT Y PIPING AND INSTRUMENTATION DIAGRAM (P&ID)
  • 84. Example 1  Figure below shows the liquid vessel for boiler system. This system has to maximum desired temperature of 120 oC (L2) where the heater will be cut off when the temperature reached desired temperature. Draw feedback control loop for the system. V-100 V 100 TC Fluid in Fluid out TT PIPING AND INSTRUMENTATION DIAGRAM (P&ID)
  • 85. Feedforward Control  Feedforward loop is a control system that anticipates load disturbances and controls them before they can impact the process variable.  For feedforward control to work, the user must have a mathematical understanding of how the manipulated variables will impact the process variable. LCV-100 FT FC Y Steam TI Process variable need to be controlled = Temperature Fluid in Fluid out PIPING AND INSTRUMENTATION DIAGRAM (P&ID)
  • 86. Feedforward Control (cont…)  An advantage of feedforward control is that error is prevented, rather than corrected.  However, it is difficult to account for all possible load disturbances in a system through feedforward control.  In general, feedforward system should be used in case where the controlled variable has the potential of being a major load disturbance on the process variable ultimately being controlled. LCV-100 FT FC Y Steam TI Process variable need to be controlled = Temperature Fluid in Fluid out PIPING AND INSTRUMENTATION DIAGRAM (P&ID)
  • 87. Example 2  Figure below shows compressed gas vessel. Process variable that need to be controlled is pressure where the vessel should maintain pressure at 60 psi. This pressure controlled through the gas flow measurement into the vessel. By using feedforward control system, draw the loop. V-100 FT Process variable need to be controlled = Pressure FC Y PI PIPING AND INSTRUMENTATION DIAGRAM (P&ID)
  • 88. Feedforward-plus-Feedback Control  Because of the difficulty of accounting for every possible load disturbance in a feedforward system, this system are often combined with feedback systems.  Controller with summing functions are used in these combined systems to total the input from both the feedforward loop and the feedback loop, and send a unified signal to the final control element. LCV-100 FT FC Y Steam TT Process variable need to be controlled = Temperature Fluid in Fluid out TC  PIPING AND INSTRUMENTATION DIAGRAM (P&ID)
  • 89. Example 3  Figure below shows compressed gas vessel. Process variable that need to be controlled is pressure where the vessel should maintain pressure at 60 psi. By using pressure controlled through both the gas flow measurement into the vessel and vessel pressure itself, draw a feedforward-plus-feedback control loop system. V-100 FT Process variable need to be controlled = Pressure FC Y PT  PIC PIPING AND INSTRUMENTATION DIAGRAM (P&ID)
  • 90. Exercise 2  Figure below shows the boiler system that used to supply hot steam to a turbine. This system need to supply 100 psi hot steam to the turbine where the PCV-100 will be opened when the pressure reached that desired pressure. With using pressure control through temperature and pressure measurement in the boiler, draw a feedforward-plus-feedback control loop system. BOILER Process variable need to be controlled = Pressure Water Hot steam PIPING AND INSTRUMENTATION DIAGRAM (P&ID)
  • 91. Answer 2 BOILER TT Process variable need to be controlled = Pressure TIC Y Water Hot steam PIC  Figure below shows the boiler system that used to supply hot steam to a turbine. This system need to supply 100 psi hot steam to the turbine where the PCV-100 will be opened when the pressure reached that desired pressure. With using pressure control through temperature and pressure measurement in the boiler, draw a feedforward-plus-feedback control loop system. PT  PIPING AND INSTRUMENTATION DIAGRAM (P&ID)
  • 92. Ratio Control  Ratio control is used to ensure that two or more flows are kept at the same ratio even if the flows are changing. Water Acid 2 part of water 1 part of acid FT FT FF FIC PIPING AND INSTRUMENTATION DIAGRAM (P&ID)
  • 93. Ratio Control (cont…) Application: - Blending two or more flows to produce a mixture with specified composition. - Blending two or more flows to produce a mixture with specified physical properties. - Maintaining correct air and fuel mixture to combustion. Water Acid 2 part of water 1 part of acid FT FT FF FIC PIPING AND INSTRUMENTATION DIAGRAM (P&ID)
  • 94. Ratio Control (Auto Adjusted) - If the physical characteristic of the mixed flow is measured, a PID controller can be used to manipulate the ratio value. - For example, a measurement of the density, gasoline octane rating, color, or other characteristic could be used to control that characteristic by manipulating the ratio. Water Acid 2 part of water 1 part of acid FT FT FF FIC AIC Remote Ratio Adjustment Remote Set Point Physical Property Measurement PIPING AND INSTRUMENTATION DIAGRAM (P&ID)
  • 95. Cascade Control  Cascade Control uses the output of the primary controller to manipulate the set point of the secondary controller as if it were the final control element. Reasons for cascade control: - Allow faster secondary controller to handle disturbances in the secondary loop. - Allow secondary controller to handle non-linear valve and other final control element problems. - Allow operator to directly control secondary loop during certain modes of operation (such as startup). PIPING AND INSTRUMENTATION DIAGRAM (P&ID)
  • 96. Cascade Control (cont…) Requirements for cascade control: - Secondary loop process dynamics must be at least four times as fast as primary loop process dynamics. - Secondary loop must have influence over the primary loop. - Secondary loop must be measured and controllable. PIPING AND INSTRUMENTATION DIAGRAM (P&ID)
  • 97. Exercise 3  Figure below shows pH adjustment process where pH 6.5 need to be maintained. pH in the tank is controlled by NaOH dosing to the tank. But somehow, the flow of waste (pH 4.5) also need to considered where excess flow of the waste shall make that pH in the tank will decrease. Draw a cascade control loop system. Process variable need to be controlled = pH NaOH Tank pH Adjustment Tank Waste, pH 4.5 pH 6.5 PIPING AND INSTRUMENTATION DIAGRAM (P&ID)
  • 98. Answer 3  Figure below shows pH adjustment process where pH 6.5 need to be maintained. pH in the tank is controlled by NaOH dosing to the tank. But somehow, the flow of waste (pH 4.5) also need to considered where excess flow of the waste shall make that pH in the tank will decrease. Draw a cascade control loop system. Process variable need to be controlled = pH pHT FT pHC FC Y NaOH Tank pH Adjustment Tank Waste, pH 4.5 pH 6.5 PIPING AND INSTRUMENTATION DIAGRAM (P&ID)
  • 99. Split Range Control FC FT Valve A Valve B PIPING AND INSTRUMENTATION DIAGRAM (P&ID)
  • 100. Split Range Control TK-100 (pH adjustment tank) TK-101 (acid feed tank) The diagram shows pH adjustment; part of waste water treatment process. The process shall maintained at pH 6. When the process liquid states below pH 6, CV-102 will be opened to dosing NaOH to the tank TK-100. When the process liquid states above pH 6, CV-101 will be operated to dosing HCl. TK-102 (base feed tank) CV-101 CV-102 pHT 1 pHIC PIPING AND INSTRUMENTATION DIAGRAM (P&ID)
  • 101. Prepared by, MISS RAHIMAH OTHMAN THANK YOU